MCL | week 49 | 1hr chart.
T.A explained -
BackSide (BS)
FrontSide (FS)
Inverse BS (Inv.BS)
Inverse FS (Inv.FS)
BS & FS levels are expected support when dashed lines, tested when dotted and resistance when solid lines.
The inverse is true for the Inv. BS Inv. FS levels, they are resistance as dashed lines, tested as dotted and support as solid lines.
Monthly timeframe is color pink
weekly grey
daily is red
4hr is orange
1hr is yellow
15min is blue
5min is green if they are shown.
strength favors the higher timeframe.
2x dotted levels are origin levels where trends have or will originate. When trends break, price will target the origin of the trend. its math, when the trend breaks, the vertex breaks too so the higher timeframe level/trend that breaks, the more volatility there could be as strength in the orders flow in to fuel the move.
Trade ideas

4H Supply & Demand | Going Long, BabyHere we have a diamond reversal pattern on the 4H.
Now that it broke out, I'm looking for a liquidity zone to retrace to and then go long for just 60 ticks on the 5m chart. Follow for more value.
- Mr. Trader-CL

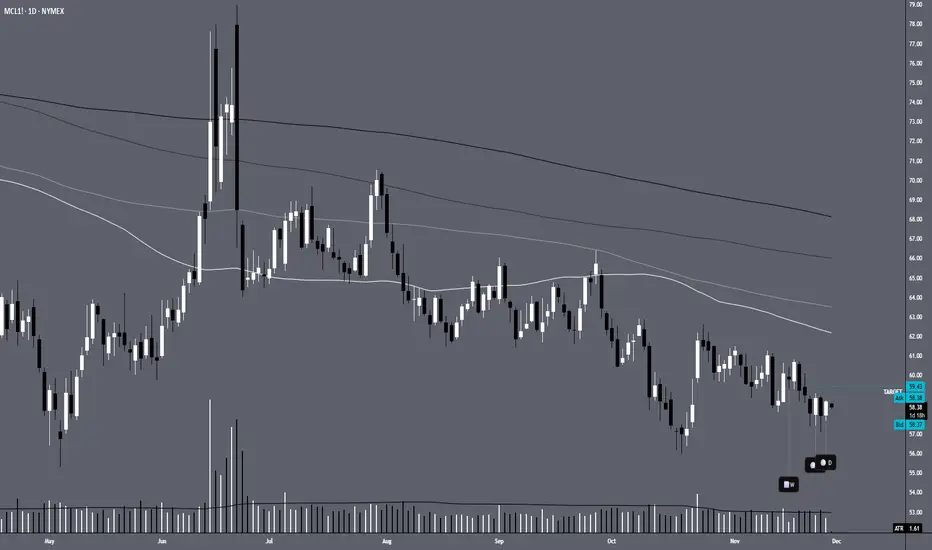
MCL1!Price is currently underneath the quarter's mark. Testing a support zone. Price could retest the November resistance zone.
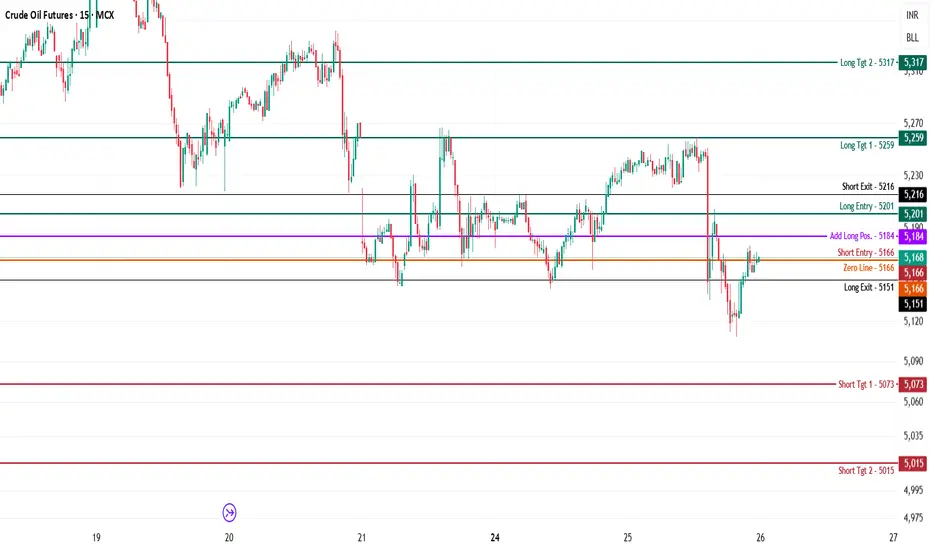
Crude Oil MCX Futures — Intraday Technical Analysis - 26 Nov. 25MCX:CRUDEOIL1!
Crude Oil MCX Futures — Intraday Levels and Technical Analysis for 26th November 2025
By Chart Pathik 26 November 2025
Market Overview
Crude Oil Futures are trading around ₹5,168, showing indecision after testing both bullish and bearish pivots. Price is consolidating near the zero line (₹5,166), with traders awaiting a decisive breakout. Momentum remains fragile, and intraday bias will depend on how price reacts around key control levels.
Key Intraday Levels and Scenarios
Bearish Structure:
- Short entry below ₹5,166 (zero line breakdown).
- Downside momentum may accelerate toward:
- ₹5,073 (Short Target 1)
- ₹5,015 (Short Target 2)
- Control: Keep stops above ₹5,216 or be ready to reverse if a sharp bounce occurs.
Bullish Structure:
- Long entry above ₹5,201 (confirmation of strength).
- Upside targets:
- ₹5,259 (Long Target 1)
- ₹5,317 (Long Target 2)
- Control: Trail stops aggressively and reduce exposure near resistance zones.
Neutral Zone:
- Between ₹5,166 and ₹5,201 — avoid heavy exposure until a clean breakout or fake‑out confirms direction.
Bias and Outlook
- Day Bias: Sell below ₹5,166; structure remains bearish as long as price trades beneath this pivot.
- Rallies are expected to face resistance and attract selling pressure unless price sustains above ₹5,201.
- Caution: A strong reclaim of the zero line could trigger volatility and short covering.
Chart Pathik View
Crude Oil is at a tactical inflection point. The bias leans negative heading into the session, but conviction is key — wait for confirmation signals before initiating fresh positions. Maintain strict risk management, as intraday reversals can be sharp. Remember, structure should guide decision‑making, not emotion.
Boost, comment, or share if these setups help you stay organized and attentive.
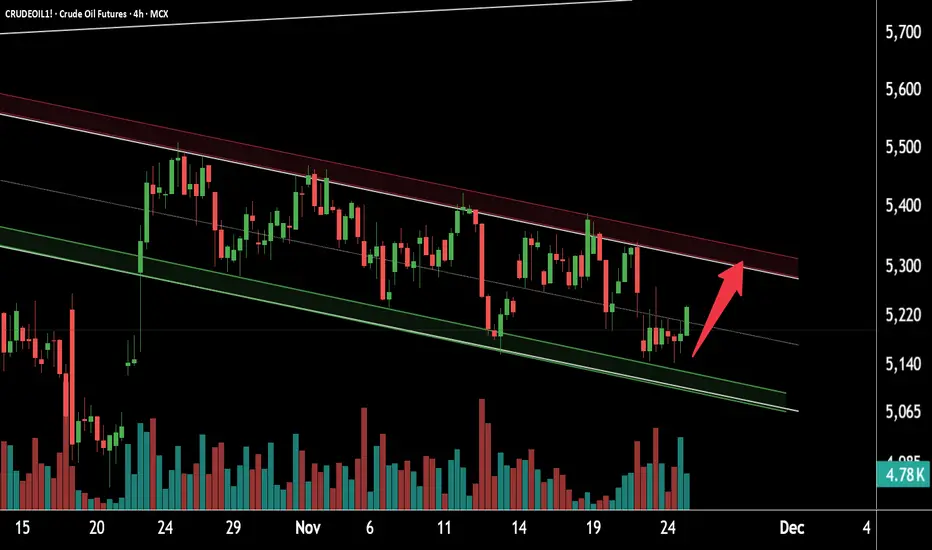
Crude Oil Showing Strong Upside SetupThis is the 4-hour timeframe support zone of Crude Oil.
The price is moving within a falling channel and is currently trading near the support zone at 5050–5100.
Crude Oil is respecting this support and has started taking a reversal.
If the momentum continues, the bullish move may extend towards the resistance zone at 5350–5400.
Thank you.
Triangle Pattern in Oil Futures
Does anyone else notice this short term triangle pattern on oil futures?
I will be watching for when it breaks one way or another but I am not that great at understanding oil movements.
If you have any insights, please share
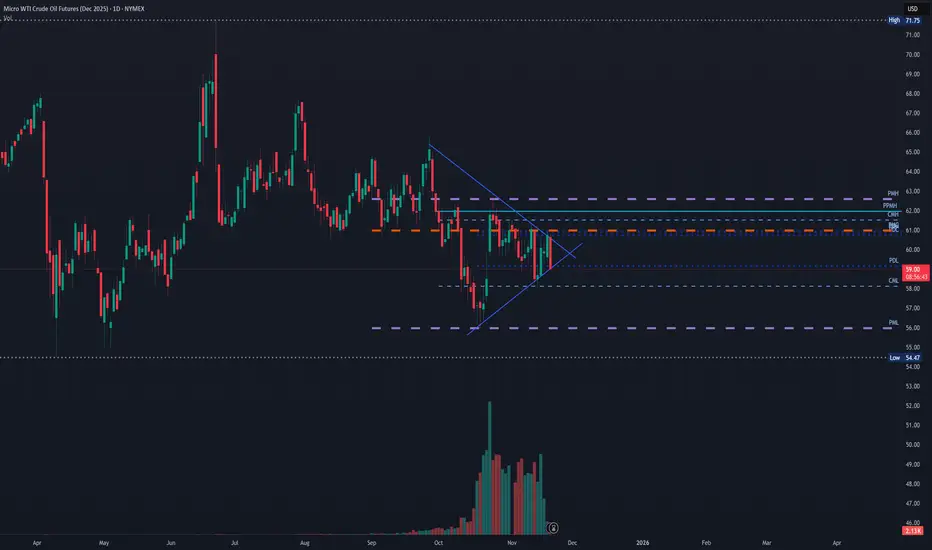
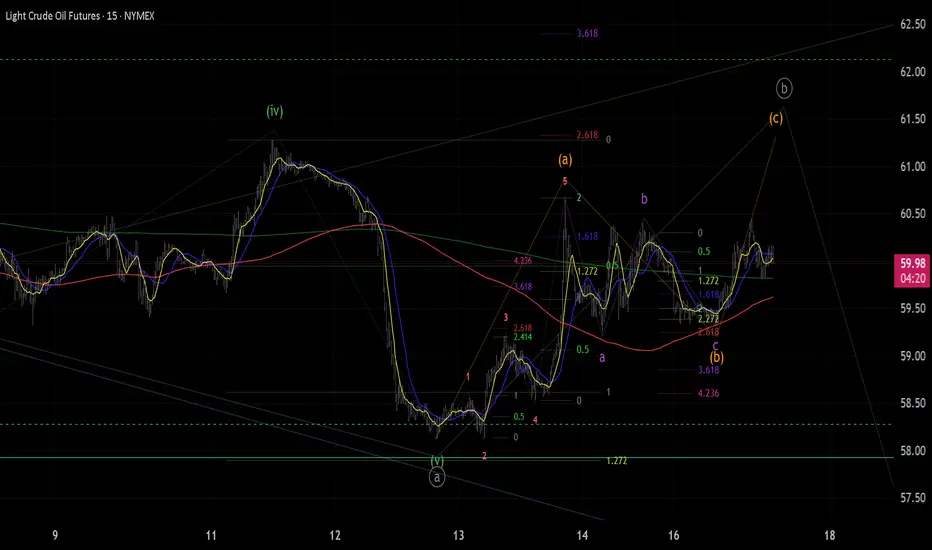
Elliott Wave - still in corrective Intermediate W(4).Should see some more range bound movement before WTI makes final W(5) down into the $40's..is my guess. Look for longer term short entries above 62.60 Let's see how it plays out. All of this since March 2022 high of $130 is a supercycle wave A.
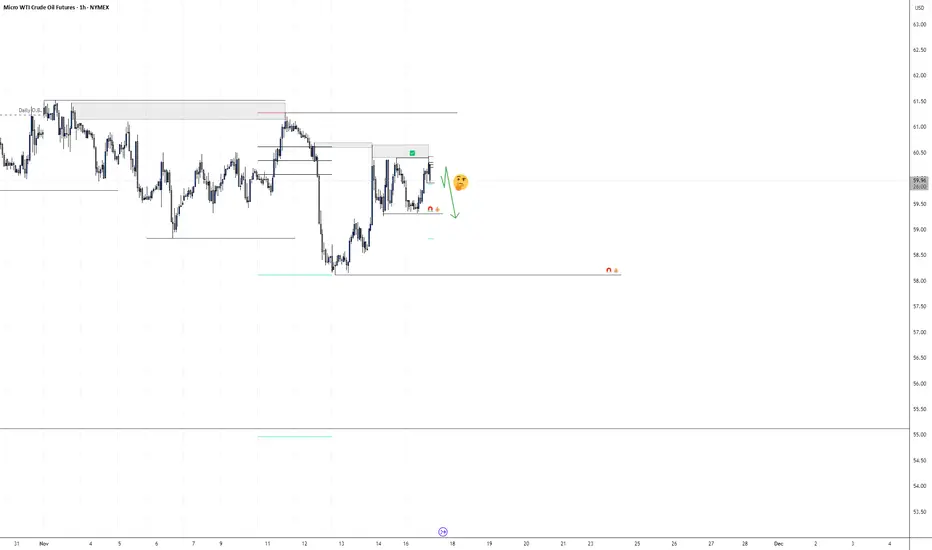
Institutional Order Flow MCl1!Institutional order flow on MCL1! is showing a draw on liquidity with relative equal lows near 55 - 55.5 pricing.
Dropping down to the lower time frame the swing structure holds true and is pointing at lower prices in the near future.
We're looking for entries on the lower time frame and following the fractal trend within the Daily.
Waiting for confirmations, it looks like today will be a bearish day with the nearest target of 59.31
As always, wait for a confirmation entry, and hold small running positions for if we get deeper profits.
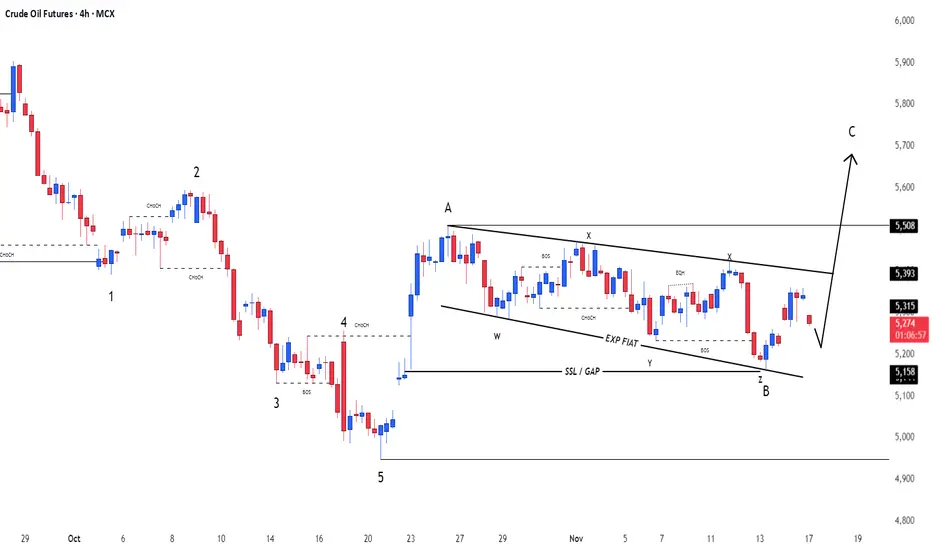
Crude OilU.S Oil Index
- Exp Fiat as an corrective pattern in Short Time Frame
- Break of Structure
- Completed " 12345 " Impulsive Waves and " AB " Corrective Waves
- Sell Side Liquidity
- Order Block

Sexy 60 - Daily - 1 st chart is 987m tf 6 pm - 10:27 NY candles. Here's a new daily - watching the dance either side of 60 she's been testing the Big blue fib grain above to try for 61.25 + .382 -65.24 . Mama bear could drop to the blue mid mth Fib barn below 57.5 to .5 - 45.09 . It's showing an implied IHS bounce would be 3rd bovine EW big bull 65.24 option . 60 is the key imo .. algos rule with blue grain above as supply or deny . I'll post smaller tf's as she might dance . Good Luck -keep your stick on the ice.

Sexy 60 Here's a new daily - watching the dance either side of 60 she's been testing the Big blue fib grain above to try for 61.25 + .382 -65.24 . Mama bear could drop to the blue mid mth Fib barn below 57.5 to .5 - 45.09 . It's showing an implied IHS bounce would be 3rd bovine EW big bull 65.24 option . 60 is the key imo .. algos rule with blue grain above as supply or deny . I'll post smaller tf's as she might dance . Good Luck -keep your stick on the ice.

Sexy 60 3 hr Here's a new daily - watching the dance either side of 60 she's been testing the Big blue fib grain above to try for 61.25 + .382 -65.24 . Mama bear could drop to the blue mid mth Fib barn below 57.5 to .5 - 45.09 . It's showing an implied IHS bounce would be 3rd bovine EW big bull 65.24 option . 60 is the key imo .. algos rule with blue grain above as supply or deny . I'll post smaller tf's as she might dance . Good Luck -keep your stick on the ice.

56.6This channel is not providing individualized trading or investment advice, nor is it a banking service, brokerage service, trading service, investment service or money management service

Crude OIL - trigger 63$Break of 63 $ area can give right push to the price to arrive untile 71/72 $ area
In this moment we have a H&S pattern but volume is above the price.
If price jump up to POC volume of the last period we can have a rally until next dinamic resistence area.


CRUDE OILPreferably suitable for scalping and accurate as long as you watch carefully the price action with the drawn areas.
With your likes and comments, you give me enough energy to provide the best analysis on an ongoing basis.
And if you needed any analysis that was not on the page, you can ask me with a comment or a personal message.
Enjoy Trading ;)

Crude Oil – Sell around 61.00, target 60.00-58.00Crude Oil Market Analysis:
Crude oil has rebounded, presenting another selling opportunity. We maintain our bearish outlook on crude oil. Today, you can sell directly at 61.00, or consider selling at 61.50. Regardless of the fluctuations, it's a sell opportunity. Crude oil volatility has been minimal in recent months, so patience is needed to enter the market. The overall trend for crude oil is unlikely to change.
Fundamental Analysis:
There are no major data releases today; all are routine data. The most important data this week is tomorrow's CPI, which has seen significant fluctuations over the past year.
Trading Recommendation:
Crude Oil – Sell around 61.00, target 60.00-58.00

Crude Oil 4H analysisBreakout confirmed above descending trendline. Monitoring retests around 60.90–60.50 for potential more long entries . Take-profit zones — 62.30 and 64.15.”
NOTE: it's not late to enter or early from 60.90&60.50🥰 confirm break and retest on LTf on the on those two levels

CRUDE OILWith your likes and comments, you give me enough energy to provide the best analysis on an ongoing basis.
And if you needed any analysis that was not on the page, you can ask me with a comment or a personal message.
Enjoy Trading ;)

CRUDE higher-low structure🛢️ CRUDE OIL – 4H CHART UPDATE
Price is testing the upper trendline resistance after forming a higher-low structure — signaling early bullish intent.
Technical Outlook:
• Multiple rejections near 5340–5360 now acting as breakout zone
• EMA 25 crossing above EMA 55 – momentum buildup
• RSI showing steady recovery from oversold levels
Setup to watch:
➡️ Bullish breakout above 5430 may open room toward 5520–5560
➡️ Rejection could trigger a retest near 5280–5320 before next move
Bias: Mildly bullish while price sustains above 5340
Short-term momentum building up — watch for breakout confirmation on volume!
This view/setup is for learning purpose only!

CRUDE OILPreferably suitable for scalping and accurate as long as you watch carefully the price action with the drawn areas.
With your likes and comments, you give me enough energy to provide the best analysis on an ongoing basis.
And if you needed any analysis that was not on the page, you can ask me with a comment or a personal message.
Enjoy Trading ;)

Crude Oil – Sell around 61.50, target 58.00-56.00Crude Oil Market Analysis:
Crude oil has recently started to decline on the daily chart, with a larger drop than before. Previously, the declines were smaller, but recently the fall has accelerated. Sell on any rebounds. Pay attention to the resistance around 61.40. The daily moving averages are starting to diverge. A break below 55 would trigger a major daily downtrend. Currently, the market is experiencing a volatile decline.
Fundamental Analysis:
Recent comments from Federal Reserve officials have signaled continued interest rate cuts. It is expected that the rapid easing policy will continue, which will support further buying and upward movement in gold.
Trading Recommendation:
Crude Oil – Sell around 61.50, target 58.00-56.00
