Alibaba Group Holding buying opportunityAlibaba is potentially in the process of making a head and shoulder patten.
Break of neckline should be with heavy volume to be successful.
BABA trade ideas

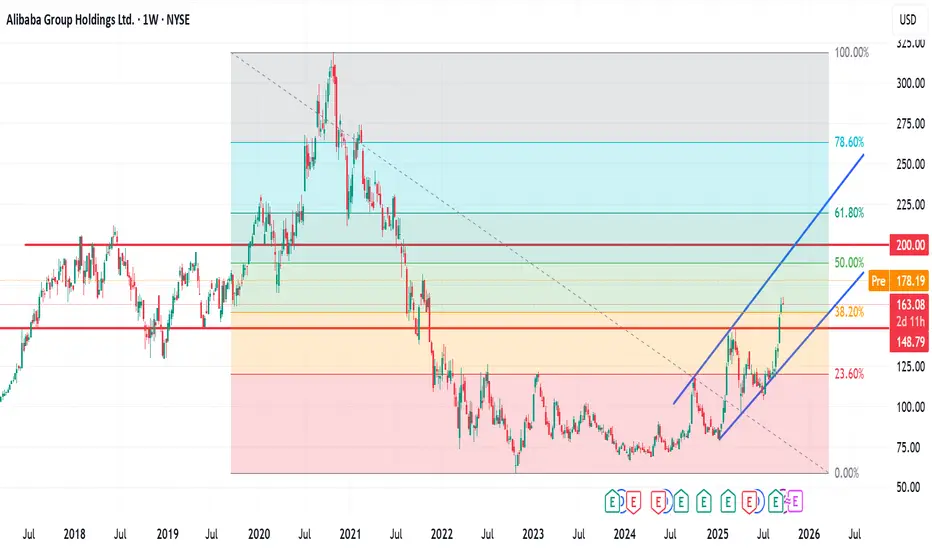
Opportunity to buy Alibaba shares For those who are regretting not getting onboard the Alibaba ship earlier, now is your opportunity. It is highly likely that when HK market opens tomorrow, this counter will head south , hopefully 5-8% as the Alibaba shares in US market was down 8% upon closing last Friday.
The first buying zone will be between 147 - 150 price level. Here, you deploy your first tranche of capital. The all important news that everyone is waiting will be how China will retaliate next week given the new tariffs will be effective on Nov 1. I expect some volatility of both countries firing at one another (trade tactics) before we see some form of settlement before Nov 1. The game is nothing new.
If we are lucky and tech shares get sell down even more , then we can the price revisit the 118-128 price level. Here, you can deploy 20% more capital to go LONG.
The above analysis is based on one's conviction in Alibaba's fundamentals and future position in the AI space.
As usual, please DYODD.

Alibaba Correction After Ant Group AI LaunchAlibaba Falls Following Ant Group’s New AI Model Launch: Opportunity or Bearish Pressure?
Ion Jauregui – Analyst at ActivTrades
Ant Group, the fintech subsidiary backed by Jack Ma and Alibaba Group (NYSE: BABA), announced the launch of Ling-1T, its new open-source artificial intelligence model designed to compete with DeepSeek V3.1 Terminus and OpenAI’s GPT-5. This model, with one trillion parameters, aims to position itself among the most powerful tools in the sector, highlighting its capabilities in complex reasoning, code generation, and advanced mathematical problem-solving. Ant Group stated that Ling-1T delivers “enhanced results” across multiple coding benchmarks, even outperforming Western competitors in technical tests. This development reinforces China’s role in the global AI race, where companies like Baidu, Tencent, and Huawei are also pushing to strengthen their technological leadership.
The move is part of a broader strategy by Beijing to boost domestic production of AI chips and processors, a key component in the country’s technological autonomy amid U.S. export restrictions. However, despite the innovative push, Alibaba (BABA) shares fell -4.11% following the announcement, reflecting investor uncertainty about the actual impact of this development on the group’s financial results, which continue to face regulatory pressure and tight margins in its e-commerce business.
Technical Analysis of Alibaba (Ticker AT: BABA)
BABA remains in a short-term downtrend after breaking the key support at $161.30, with a recent decline toward $169.53, a level close to the immediate support of its last upward move. Since the rally that began around $120, coinciding with the current Point of Control (POC), this technical rebound suggests that prices could still test lower levels due to the broad structure of its price distribution. Its inability to break previous highs may push the price toward current support, and a failure to hold this level could drive it down to the next support around $146.
RSI indicates a correction from an oversold condition toward a neutral zone at 57.72%, while the MACD histogram remains in negative territory, though its signal and average lines are currently positive, suggesting a possible short-term pause in the long-term upward move.
Moving averages maintain a bullish bias, with yesterday’s close holding above the 50-day moving average and the support of the last bullish impulse.
Resistances: Current high at $192.67
Supports: Key levels at $161.30, $145.98, and $141.34
Indicators: RSI neutral, MACD in a temporary bearish correction, moving averages maintain bullish structure.
The technical outlook suggests a potential lateral consolidation zone after the short-term correction, although the sharp pullback could present buying opportunities if the price manages to stabilize above recent highs with increasing volume.
Alibaba Leading the AI Ecosystem
Ant Group’s progress in artificial intelligence strengthens Alibaba’s position in China’s technology ecosystem, but the market still demands tangible monetization of these developments. Meanwhile, volatility and the competitive environment could continue to pressure the stock. In the medium term, the consolidation of Ling-1T and its commercial applications will be critical for Alibaba to regain investor confidence and potentially reverse the current trend.
*******************************************************************************************
The information provided does not constitute investment research. The material has not been prepared in accordance with the legal requirements designed to promote the independence of investment research and such should be considered a marketing communication.
All information has been prepared by ActivTrades ("AT"). The information does not contain a record of AT's prices, or an offer of or solicitation for a transaction in any financial instrument. No representation or warranty is given as to the accuracy or completeness of this information.
Any material provided does not have regard to the specific investment objective and financial situation of any person who may receive it. Past performance and forecasting are not a synonym of a reliable indicator of future performance. AT provides an execution-only service. Consequently, any person acting on the information provided does so at their own risk. Political risk is unpredictable. Central bank actions can vary. Platform tools do not guarantee success.

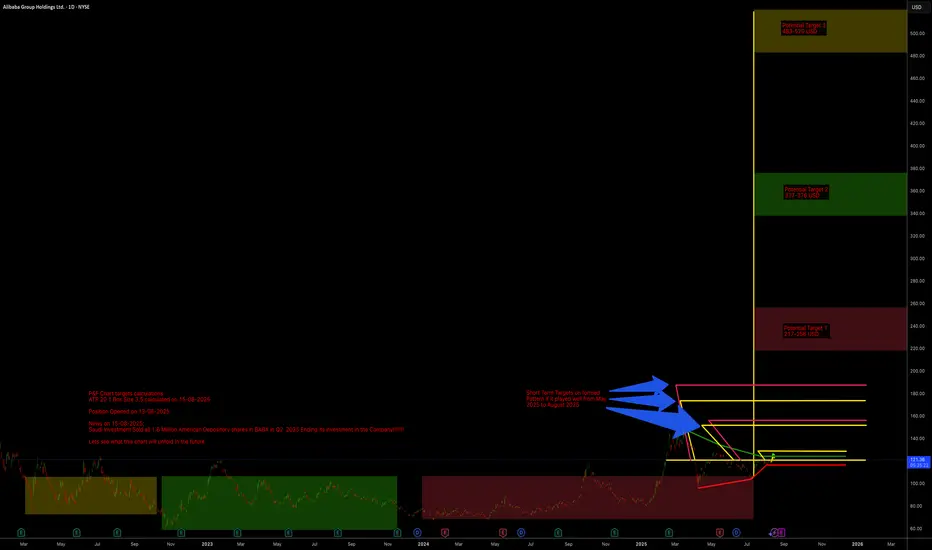
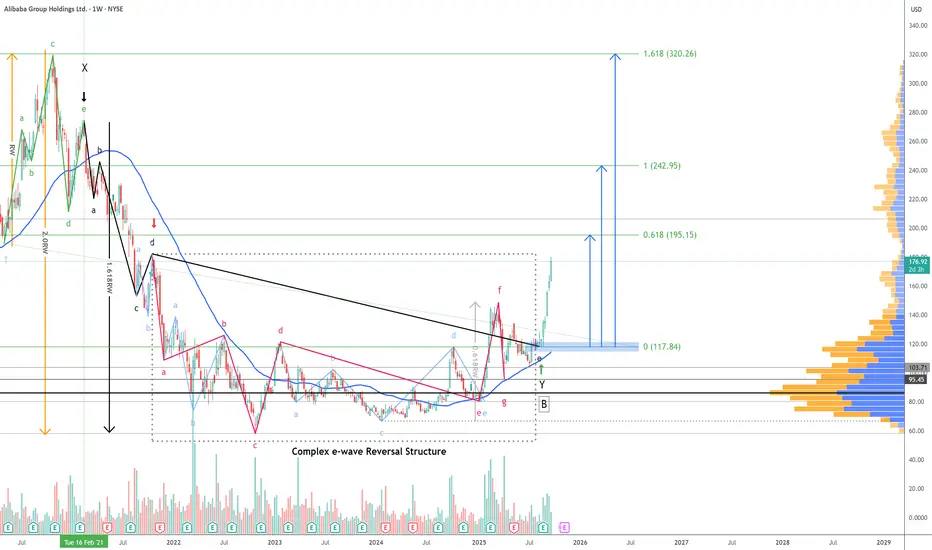
Ali BABA Potential Huge Up Targets ALi BABA have Potential Huge Up Targets with potential 3 years accumulation range from March 2022 to today 15 August 2025.
P&F Chart targets calculations
ATR 20 1 Box Size 3.5 calculated on 15-08-2025
Position Opened on 13-08-2025
News on 15-08-2025:
Saudi Investment Sold all 1.6 Million American Depository shares in BABA in Q2 2025 Ending its investment in the Company!!!!!!!
Lets see what this chart will unfold in the future
Trade With the Tide, Not the Ripple
Most traders misread the idea of “trading with the trend.” Instead of aligning with the primary trend, they zoom into the shortest time frame that agrees with their bias. That’s not discipline—it’s ego at work.
On my desk, the best tool isn’t an indicator or AI—it’s my red couch. I scroll through charts and simply ask: Is this market going up, down, or sideways? No need for clutter. The trend is obvious when you stop trying to force it.
Why do traders avoid the obvious?
FOMO makes them chase every wiggle.
Entertainment makes waiting feel unbearable.
Social media pressure tells them they must scalp or they aren’t real traders.
But real trading is patience. Jim Rogers put it best:
“I just wait until there is money lying in the corner, and all I have to do is go over there and pick it up.”
Patience costs nothing. Impulse costs everything.
Trade with the tide. Leave the ripples to the crowd.
Time for reversal?Lots of accumulation on a strong support line from 2015 and almost meets the conditions for a perfect harmonic bat pattern.

Alibaba Weekly Elliot Waves AnalysisBABA is currently in Wave 5. I believe BABA Wave 5 will be an ABC correction. With that being said, I expect a relief pump (wave B) to happen which will last for 1-2 weeks before we continue dumping. I have buy orders set for $85/$86 and at worse, $58. $100 support looks weak based on the lower Fibonacci targets. Be diligent with this one!
(Side Note: Wave 1 was also an ABC correction which is why the last wave will be similar to the first.)
You can learn more about this analysis by researching ABC corrections and Zigzags. Thank you!

BABA Perfect long positionNYSE:BABA is at a strong level ahead of its next upcoming earnings, I am looking for it to continue within its already formed parallel channel on the weekly chart. The daily shows a strong rejection of its 50ema, consequently breaking a previous swing high. the break indicates possibility of bullish momentum through the level. The current consolidation phase into the long term trend and the consolidation occurring on the long term volume profile POC, all act as positive confluence to the general idea of a mid-long term buy position on BABA. CN50 is also showing great strength on the monthly chart, which is a great confluence with BABA's overall performance.
Constriction of Bollinger daily bands is an added confluence, indicating the potential for increased volatility and a large move to come out of this consolidation phase in the near term.
I have entered a large long position, with stops shown at levels shown on chart to allow the trade to breath in the midst of unexpected volatility around earnings etc. Stops and tp may be adjusted as conditions change.
Goodluck trading ;)
BABAMy view of the stock BABA for the coming period may be that during the next month, the goals will be achieved

BABA: triangle with tensionOn the weekly chart, BABA has already formed a golden cross - price is above both MA50 and MA200, confirming a bullish trend shift. The stock is now approaching the upper edge of the symmetrical triangle and the key resistance at $122, which also aligns with the 0.5 Fibonacci level.
The numbers inside the triangle represent the contraction phases, not Elliott waves. This is a classical consolidation before a potential breakout. If the $122 level is broken and retested, upside targets are $128 (0.618), $137 (0.786), and eventually $148–181 (1.0–1.618 extension).
Volume is rising, MACD is flipping bullish, and RSI is climbing out of oversold territory — all signs point to growing bullish momentum.
Fundamentally, Alibaba benefits from China's economic rebound, possible regulatory relief, and ongoing share buybacks. With Chinese tech rotating back into favor, BABA could lead the rally.
So if you're still waiting for a signal - it's already here. The golden cross is done, price is flying above moving averages, and all that’s left is a clean breakout. Watch $122 — that’s the launchpad.

Alibaba probably near “bottom”. 19/Oct/22As Alibaba previous long term impulsive move was a “leading diagonal” pattern. So there is high “possibility” that its stock price “might hold” above 57.20..

BABA ending a very clean Wyckoff Acumulation schematic here?As the title says. Appears to be a very clean accumulation schematic. Currently in the SOS area. Consolidation could continue for months here. Timing is hard, let's see what happens over the next weeks and months.

Alibaba - Here we have the final bottom!🏮Alibaba ( NYSE:BABA ) finally created its bottom:
🔎Analysis summary:
As we are speaking, Alibaba finally managed to create a long term bottom formation. Specifically with the recent bullish break and retest, bulls are picking up momentum. We just have to see a break above the current key resistance level in the foreseeable future!
📝Levels to watch:
$140
SwingTraderPhil
SwingTrading.Simplified. | Investing.Simplified. | #LONGTERMVISION

BABA Alibaba Group Holding Limited Options Ahead of EarningsIf you haven`t bought the dip on BABA:
Now analyzing the options chain and the chart patterns of BABA Alibaba Group Holding Limited prior to the earnings report this week,
I would consider purchasing the 135usd strike price Calls with
an expiration date of 2025-9-19,
for a premium of approximately $14.25.
If these options prove to be profitable prior to the earnings release, I would sell at least half of them.

$BABA - Structure Confirmed, Targets In Motion - 9/24/2025Back in February, we discussed how NYSE:BABA was approaching the final stages of a reversal pattern. That call has now been confirmed with the structure concluding at $117. What followed was nothing short of explosive—a 51% upswing rally that’s currently unfolding with strong momentum. 📈
Note: The stock bounced twice off the 50-week moving average, signaling strong support as the correction neared its end.
The chart highlights the projected targets for this new rally, and for transparency and educational value, the internal wave structure and labeling have been intentionally left visible. This is especially insightful for traders exploring Modern Trading Algorithms and their structural variations.
Let the rally do the talking! 📊. 🚀
Happy Trading!
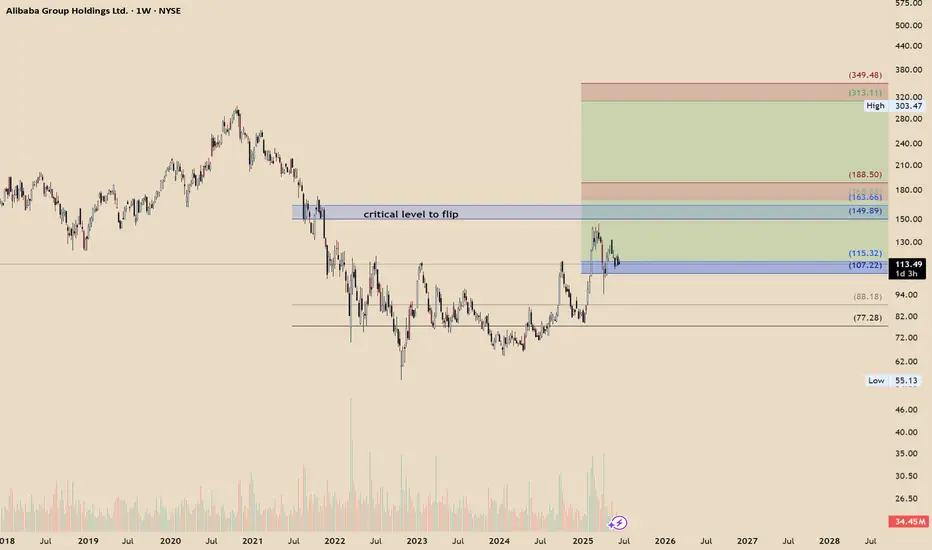
BABA undervaluedHello
BABA has invalidated any corrective attempts due to its price action — a 3-month bullish breaker is in play, and the price has yet to test the first level of algorithmic targets around 163–168.
There’s also a critical level to flip near 149, and I’m fairly confident it will be reclaimed if market conditions permit.
NFA
Short-Term Bear, Long-Term Bull: BABA Short-Term Bearish Case
The short-term outlook carries cautionary signals primarily due to technical factors and current macroeconomic risks:
Overbought Technical Signals: The stock's recent strong rise has pushed the Relative Strength Index (RSI) to high levels (e.g., above 70 in one short-term analysis), which can signal that the stock is overbought and may be due for a short-term pullback or consolidation.
Risk of Pullback: A sell signal has been noted from a recent pivot top, and the stock is trading in the upper part of its strong short-term rising trend, which some short-term traders may view as a selling opportunity before a reaction back towards support levels.
Macroeconomic and Geopolitical Headwinds: The stock remains sensitive to China's consumer cycle, which is in an uneven recovery, and execution risks on new strategic plans could prompt caution from the market. Geopolitical tensions and evolving regulations also continue to be an overhang.
Long-Term Bullish Case
The long-term case is overwhelmingly bullish, supported by strong analyst consensus, strategic investments, and fundamental valuation:
Strong Analyst Confidence and Price Targets: The vast majority of analysts rate BABA a "Strong Buy" or "Buy". The average 12-month price target from multiple Wall Street analysts is approximately $164.64 to $169.32.
Significant Investment in AI and Cloud: Alibaba's strategic priority is shifting toward AI and efficiency.
The company has announced a large investment plan, committing over $53 billion to enhance AI and cloud infrastructure over three years.
Alibaba Cloud is a rapidly growing market, and its division is reportedly turning profitable, which is seen as a major long-term tailwind.
Positive sentiment surrounds its Qwen 2.5-Max AI model and confirmed AI partnership with Apple for iPhones in China.
Compelling Valuation and Free Cash Flow (FCF): The company is characterized as a cash-rich, free-cash-flow compounder. Revenue and free cash flow are forecast to expand significantly through fiscal 2030.
Market Leadership and Diversification: Alibaba is a global e-commerce leader with diversified operations. Its ecosystem integrates e-commerce, cloud computing, digital media, and entertainment, supported by a large user base.
Technical Bottom and Growth Trajectory: Technical analyses suggest the stock has created a long-term bottom formation and is poised to resume its growth trajectory, with some long-term views anticipating a return to previous highs.
Trade Idea:
Entry Point (Short) At or near $183.90 (Red Arrow) The red arrow indicates a resistance/reversal point near the upper boundary of the channel/trend line.
Exit/Target Price At or near $159.69 (Green Arrow) The green arrow indicates a support level, which would be the target for this short-term pullback.

“BABA’s 10% Surge: Institutional Override or Retail FOMO?”Date: 24th September 2025
Time: 09:00 PM IST
🔹 Fundamental News
Alibaba (BABA) soared +10% intraday after reports of structural reforms and government-backed stimulus supporting Chinese tech giants. Positive earnings whisper + buyback speculation added fuel.
🔹 Public Sentiment & Behavior
Retail: Chasing the gap, heavy FOMO entries near 180.
Institutions: Smart money accumulated in the 160–165 zone last week, distributing partial at resistance.
Social Signal: Headlines scream “Tech Recovery!”, but structure shows override-driven breakout rather than organic rescue.
🔹 Current Structure
Macro :
Resistance: 185–190
Support: 160–162
Micro :
Resistance: 180 barrier zone tested.
Support: 172.5–174.2 micro floor.
Behavior: Controlled pullback already attempted; override path extended momentum.
🔹 Projection
Primary Path (65%): Pullback to 174–175 → continuation toward 185–190.
Alternate Path (25%): Breakdown under 172.5 → collapse back to 165–167.
Low Path (10%): Direct extension above 190 → only with follow-through sentiment surge.
🔹 Pullback Levels
Shallow: 175–176.2
Medium: 172.5–174.2
Deep: 165–167 (rescue-driven)
🔹 Final View
Bias: Bullish Override confirmed. Path remains higher unless 172.5 breaks. Macro structure supports 185–190.
🔹 Essence
“Market isn’t running on retail FOMO, but on institutional override. Pullbacks are reloads, not rescues. Unless 172.5 breaks, bulls hold the throne.”
⚠️ Disclaimer: This analysis is for educational and research purposes only. Not financial advice. Market decisions are your sole responsibility.
BABA: We have a bounce but is it temporary? Too many questions but dss forecasts a price growth near-term on ticker symbol $BABA. We will see where it goes. Another one on the watch is NASDAQ:PDD
$190 -$200 a possible level for BABA$190 -$200 a possible level for BABA.
I woke up to the news of possible collaboration between Alibaba and Nvidia AI collaboration.
With the AI demand and this news, I think the fundamental is great.
Technically, I will be looking at BABA pushing towards $190 zone, or to a psychological level of $200.
Remail positive and trade with care
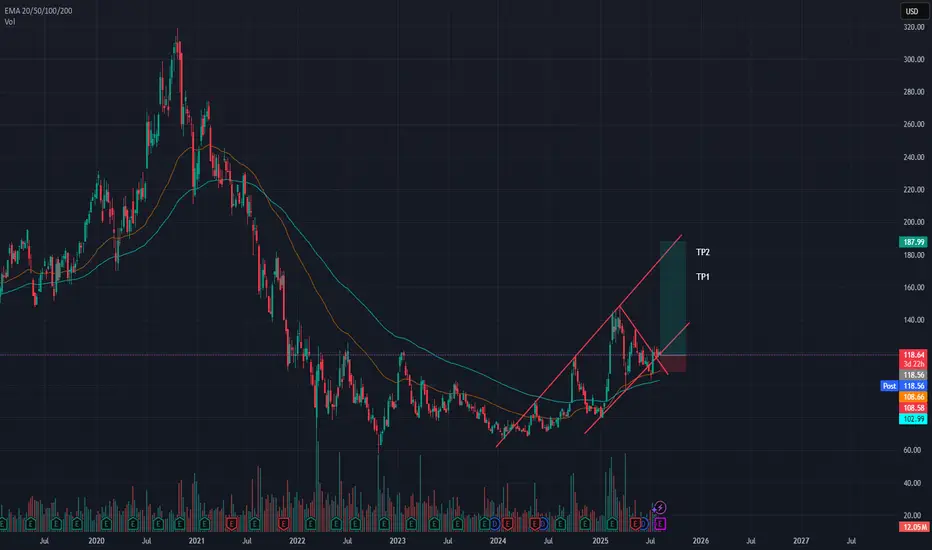
BABA – Dollar Cost Averaging Opportunityhi Traders,
Let's have a look at BABA.
Alibaba (BABA) appears to be approaching the end of its correction phase within a well-defined ascending channel. Based on the current price action and technical setup, we believe now is a good time to begin dollar cost averaging into this stock.
Our identified buy zone lies between $108 and $100, where price intersects the lower trendline support and key EMAs (20/50/100/200). This area offers a strong risk-reward setup for medium- and long-term investors.
The mid-term target for this trade is $160, which aligns with the upper channel resistance and previous price structure. However, from a long-term perspective, we anticipate that BABA will resume its growth trajectory and eventually surpass its previous all-time highs.
Supporting this idea, the RSI is stabilizing in neutral territory, suggesting that momentum is resetting and may shift bullish as price finds support.
Summary:
🔁 Strategy: Dollar cost averaging
🟩 Buy zone: $108 – $100
🎯 Mid-term target: $160
🚀 Long-term view: Return to growth and new ATH
📉 Correction nearing completion; bullish structure remains intact
This setup offers an attractive entry point for patient investors aiming to ride the next major upside cycle in Alibaba.

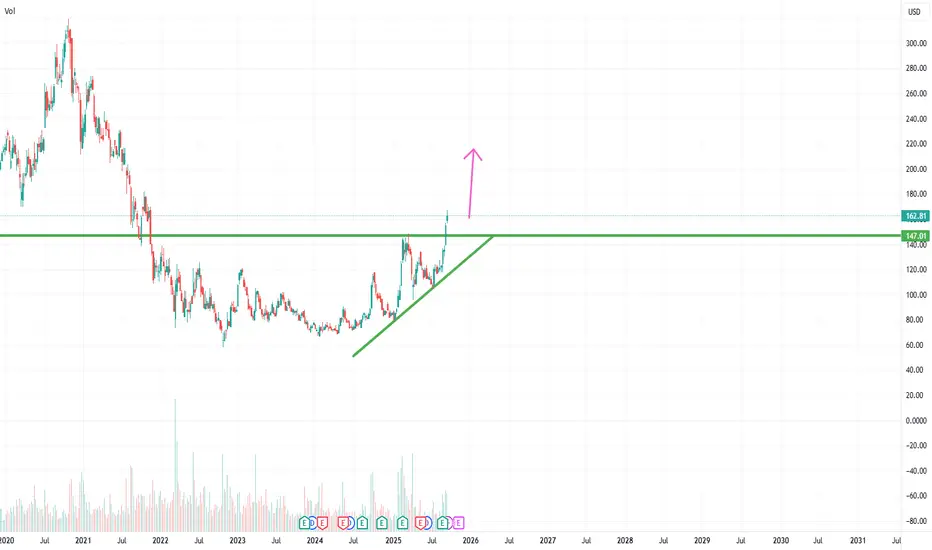
Bullish pennant on the hourlyAfter a huge rally on alibaba it is not over yet, hedgefunds are rising price targets and alibaba is currently forming a bullish pennant on the hourly time frame getting close to breakout

BABA BUY OPPORTUNITYBABA has broken out of a bullish triangle, supported by strong growth in AI , cloud business and renewed analyst optimism after earnings. With positive sentiment building around Chinese tech and AI, the breakout has momentum to continue higher.