BABA seems to have found a bottomI see multi-week accumulation from late November and 2016 resistance acting as strong support with bullish divergence on the weekly, what do you see?
BABA trade ideas

Alibaba to Keep Falling? Alibaba - Short Term - We look to Sell a break of 109.62 (stop at 117.14)
A break of 110.00 is needed to confirm follow through negative momentum. Closed below the 20-day EMA. The trend of lower highs is located at 128.00. Our overall sentiment remains bearish looking for lower levels. The primary trend remains bearish.
Our profit targets will be 89.94 and 85.50
Resistance: 128.00 / 140.00 / 150.00
Support: 110.00 / 90.00 / 80.00
Alibaba is due to report earnings on the 8th February 2022. Trading over earnings releases carries additional risk and volatility is expected.
Disclaimer – Saxo Bank Group. Please be reminded – you alone are responsible for your trading – both gains and losses. There is a very high degree of risk involved in trading. The technical analysis, like any and all indicators, strategies, columns, articles and other features accessible on/though this site (including those from Signal Centre) are for informational purposes only and should not be construed as investment advice by you. Such technical analysis are believed to be obtained from sources believed to be reliable, but not warrant their respective completeness or accuracy, or warrant any results from the use of the information. Your use of the technical analysis, as would also your use of any and all mentioned indicators, strategies, columns, articles and all other features, is entirely at your own risk and it is your sole responsibility to evaluate the accuracy, completeness and usefulness (including suitability) of the information. You should assess the risk of any trade with your financial adviser and make your own independent decision(s) regarding any tradable products which may be the subject matter of the technical analysis or any of the said indicators, strategies, columns, articles and all other features.
Please also be reminded that if despite the above, any of the said technical analysis (or any of the said indicators, strategies, columns, articles and other features accessible on/through this site) is found to be advisory or a recommendation; and not merely informational in nature, the same is in any event provided with the intention of being for general circulation and availability only. As such it is not intended to and does not form part of any offer or recommendation directed at you specifically, or have any regard to the investment objectives, financial situation or needs of yourself or any other specific person. Before committing to a trade or investment therefore, please seek advice from a financial or other professional adviser regarding the suitability of the product for you and (where available) read the relevant product offer/description documents, including the risk disclosures. If you do not wish to seek such financial advice, please still exercise your mind and consider carefully whether the product is suitable for you because you alone remain responsible for your trading – both gains and losses.

BABA BEAR PATTERNAs posted previously, BABA is in this bear flag pattern.
Previously, I was looking for BABA to break to the upside. However, it seems that it may go down even further. It is almost testing a KEY support level around the 110 mark.
If it breaks to the downside, there is going to be HUGE trouble for BABA.
Look for that 110 mark. A close below on the daily is trouble. One might be able to play long from this bottom support line if they're feeling risky.

BABA SoftBank to Sell Its Huge Stake ???Additional American depositary share registration in the U.S. was translated by Citigroup`s analysts as SoftBank Group intention to sell part of its stake.
Softbank was a pre-initial public offering investor in BABA, owning 5.39 billion ordinary Alibaba shares, or a 24.8% stake,
The can drop to the $109 support, if not even lower.
Looking forward to read your opinion about it.

BABA finally found a bottom??????My updated analysis on BABA...It had a nice A,B,C correction that turned into a more complex W,X,Y that is looking for a 4th test of support at the $109ish area...I was initially thinking this could fall to the $80 range but I'm leaning on the retest of support for a potential long with my 1rst price target at the $161 mark to fill the GAP...Happy Trading!!!

Great Long Opportunity on BABA
Great Long Opportunity on NYSE:BABA , but wait and see if VMC green buy indicator keep showing at the end of the month!
Potential 150% gains if BABA reach ATH!
**I think NYSE:BABA is a great mid-long term hold although there is "delisting risk" with the chinese stocks on NYSE**
NYSE:BABA
www.tradingview.com

$BABA downside riskWhile $BABA has had a nice gap up movement in the past few days, perhaps caused by anticipation to their earnings coming due, I expect the stock to have continued upward pressure. Therefore, I expect there to be more 'time and price' and filling of previous pricing areas as notated on the chart around the 115 TO 113-ish area.
The complexion of China has not changed; therefore, it's a 'sit on the sidelines' until we acquire some movement from the country.

BABA winter Olympics & earnings soonThe Beijing 2022 Olympic Winter Games officially open this Friday, 2/4. Although competition will start tomorrow, 2/2 prior to the Opening Ceremony with preliminary games in Curling and Ice Hockey. I cannot find any exact date for earnings, but it's somewhere between tomorrow, 2/11 or 2/18 from what I saw. Alibaba Group Holding ADR (BABA) reported Q2 September 2021 earnings of $1.70 per share on revenue of $31.1 billion. The consensus earnings estimate was $1.87 per share on revenue of $32 billion. Revenue grew 36.4% on a year-over-year basis. The company said it now expects fiscal 2022 revenue of $131.38 billion to $134.66 billion. The company's previous guidance was revenue of more than $144.1 billion and the current consensus revenue estimate is $141.29 billion for the year ending March 31, 2022. I'm cautiously long because of a speculative concept that BABA will get an Olympics bounce, it has outstanding fundamentals, the technical entry here is looking good after a triple bottom 12/3/21, 12/29/21, 1/27/22 yet the PRC can be a geopolitical risk and hence a risk for the ADR shares.
Q3 Consensus:
EPS = $1.92
Revenue = $39.13B
Fundamentals:
P/E = 17.98
EPS = $1.70
Revenue = $31.1B
Cash = $48.16B
D/A = .10
Div /Yld = ---
52 week high = $274.29
52 week low = $108.70
SMA200 = $174.08
SMA150 = $158.88
SMA100 = $142.69
SMA50 = $124.27
breakout = $152.27
R3 = $145.93
R2 = $139.58
R1 = $133.24
pivot = $126.89
S1 = $120.55
S2 = $114.21
S3 = $107.86
breakdown = $101.52
Do your own due diligence, your risk is 100% your responsibility. This is for educational and entertainment purposes only. You win some or you learn some. Consider being charitable with some of your profit to help humankind. Good luck and happy trading friends...
*3x lucky 7s of trading*
7pt Trading compass:
Price action, entry/exit
Volume average/direction
Trend, patterns, momentum
Newsworthy current events
Revenue
Earnings
Balance sheet
7 Common mistakes:
+5% portfolio trades, capital risk management
Beware of analyst's motives
Emotions & Opinions
FOMO : bad timing, the market is ruthless, be shrewd
Lack of planning & discipline
Forgetting restraint
Obdurate repetitive errors, no adaptation
7 Important tools:
Trading View app!, Brokerage UI
Accurate indicators & settings
Wide screen monitor/s
Trading log (pencil & graph paper)
Big, organized desk
Reading books, playing chess
Sorted watch-list
Checkout my indicators:
Fibonacci VIP - volume
Fibonacci MA7 - price
pi RSI - trend momentum
TTC - trend channel
AlertiT - notification
tickerTracker - MFI Oscillator
www.tradingview.com

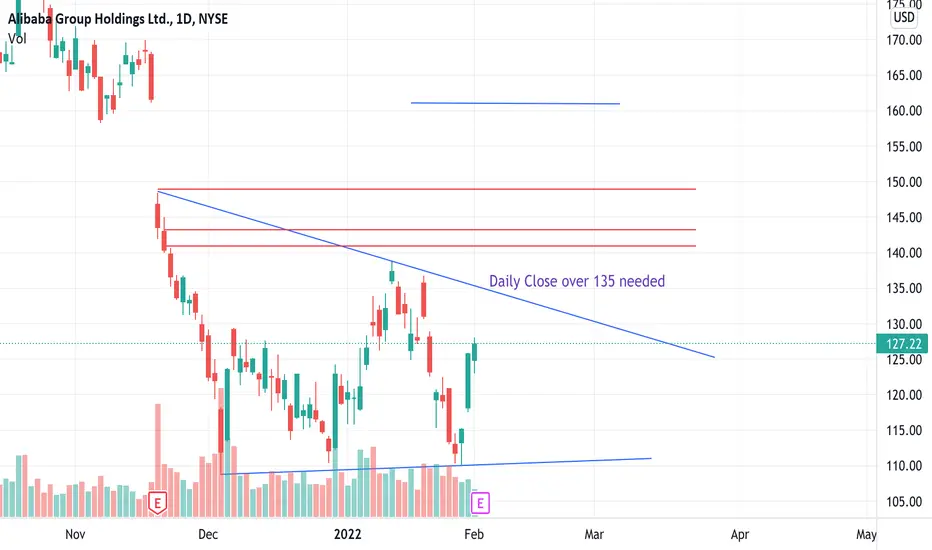
BABA Bear Pattern BreakupThis has been such a frustrating ticker to play I'm sure for most people.
We're still in this bear pattern. And it wants to blow. I can feel it.
It's just not ready yet.
Updated level is 135 on the daily close. Then needs to consolidate and break up decisively to go back and fill the gap upwards.
Mr. Market needs to cooperate too b/c China stonks have been beaten up too much.
BABA convergence in long term trends: bottom signs Hello,
the upper band is the exact same size as the below,
the same holds for the down trend bands.
horizontally we have also an old support.
It looks like a convergence in bottoming.

strategy for BABA Tuesday 02/01/2022BABA: bullish continuity price ( 127.00 )
If they continue, we will take profits close to the sell zone (138.70) (136.75)
bearish entry: will be below (124.00)

$109 was the bottom? $BABA RSI hinting a breakout!Hey Traders,
As evident on the Weekly Chart of Alibaba (BABA), the Fibonacci Retracement looks like it matches up almost perfectly! Next, the Weekly RSI has something very interesting.. A descending resistance line is clearly present and if we are to break it, BABA would have a rebound to the golden pocket. The target is at .618-.65 ($238-$246) so set TP's/ Sell Orders there.
Safe Trading,
-Pulkanator

100% transparency: My Monthly Performance for Long Ideas..!If your position were equally in size (as recommended) your monthly outcome should be +6% if you took all the trades!
Position size recommended for all trades was 5% of the trading capital:
6% * (0.05%) = +0.3%
you may think it is not good but when you compare it with market performance in January 2022 it will shine..!
In January 2022:
S&P 500: -6.06%
NASDAQ: -10.31%
DOW JONES: -4.25%
Russell 2000: -10.74%
Compare the result with the celebrity fund manager at ARK: All their funds lost 21-23% of their value in 1 month..!
These ideas were not published publicly..!
Best,
Moshkelgosha
DISCLAIMER
I’m not a certified financial planner/advisor, a certified financial analyst, an economist, a CPA, an accountant, or a lawyer. I’m not a finance professional through formal education. The contents on this site are for informational purposes only and do not constitute financial, accounting, or legal advice. I can’t promise that the information shared on my posts is appropriate for you or anyone else. By using this site, you agree to hold me harmless from any ramifications, financial or otherwise, that occur to you as a result of acting on information found on this site.

BABA - Long - possible phase C of accumulation If Baba found the bottom during the past 2 months, then the past week is test to the process (C).
See the suggested price movement from here.

BABA Back at Median Line after distibutionHello Traders,
Here is an analysis on Alibaba. As you can see in the chart Baba has completed a Wyckoff cycle of accumulation and distribution. Now that the price action is back at the median line it seems to be forming a triple bottom base and taking a break from its recent sell off. We will want to see more bullish volume grow in this area to confirm this base before looking for any buying opportunities. As the price action sits on the baseline in the middle of the structure the longer it holds the stonger it becomes and a buying opporitunity will approach.
Patience is the only key to opening the door to profits.
Savvy

Alibaba Longterm Investment PlanHey Trader,
please see my idea on the Alibaba stock, that is currently giving us an amazing opportunity to invest.
This target is purely based on technical knowledge and this chart is more for myself in order to track my progress with this stock.
This is no financial advice,
RT
