#ONE/USDT – The Final Shakeout Before Reversal?#ONE
The price is moving within a descending channel on the hourly timeframe. It has reached the upper boundary and is heading towards breaking it. A retest of this boundary is expected.
The Relative Strength Index (RSI) is showing an upward trend, as it has approached the upper boundary. A bearis
Related pairs

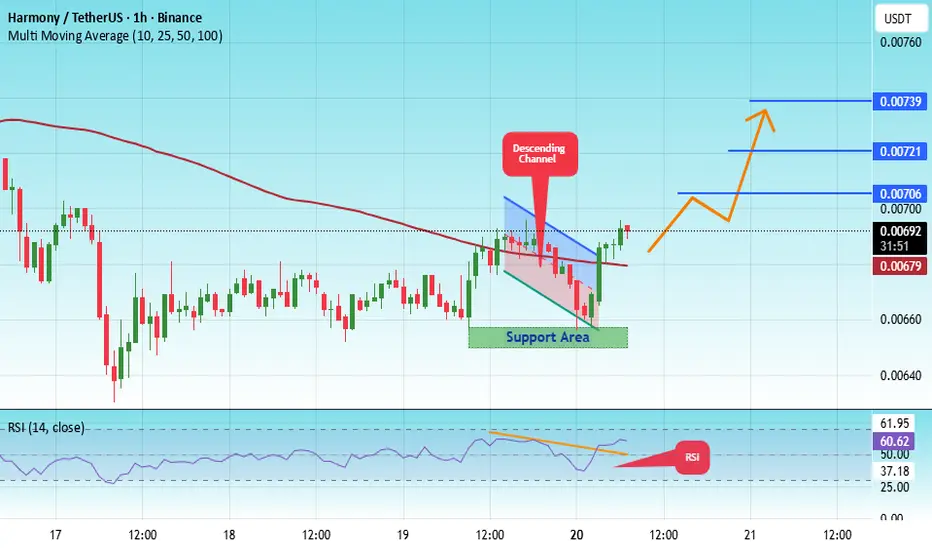
#ONE/USDT – The Final Shakeout Before Reversal?#ONE
The price is moving within a descending channel on the hourly timeframe. It has reached the lower boundary and is heading towards a breakout, with a retest of the upper boundary expected.
The Relative Strength Index (RSI) is showing a downward trend, approaching the lower boundary, and an upw
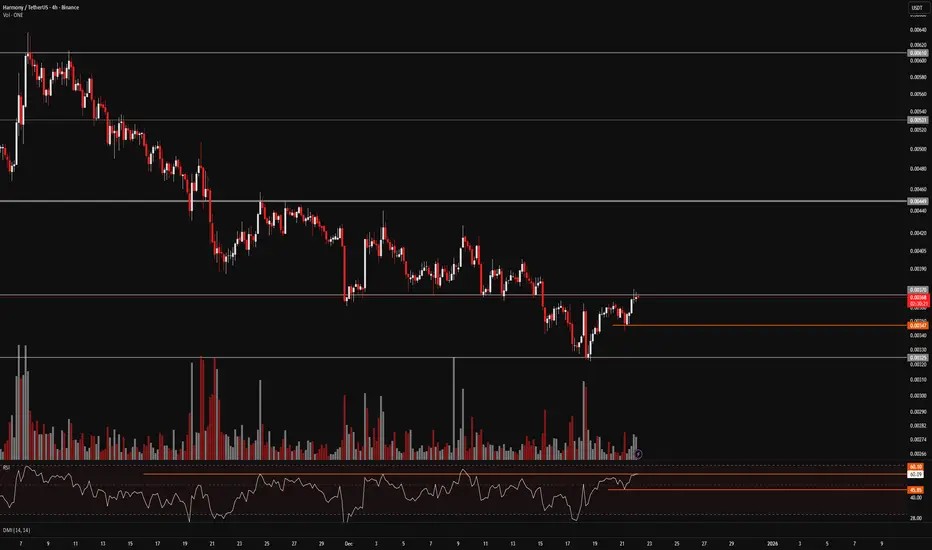
ONE/USDT at Edge: Bounce or Breakdown from Major Demand Zone?The ONE/USDT on the 1W (Weekly) timeframe shows a clear long-term bearish trend since the all-time high in 2021. Price has consistently formed lower highs and lower lows, confirming strong seller dominance over the past few years.
Currently, price is approaching a major historical demand zone, high

SPOT ONE LONG 26.12.2025Pinning after abnormal activity.
💰I enter at the market price.
I'll let you know when I record it manually.
‼️Risk per trade: 2% of the allocated funds for spot trading.

FireHoseReel | ONE Compression Below 0.0037 Signals Expansion🔥 Welcome To FireHoseReel !
Let’s dive into Harmony (ONE) analysis.
⛳️ ONE Fundamental Overview
Harmony (ONE) is a layer-1 blockchain focused on fast, low-fee transactions and sharding scalability. ONE is currently ranked around #330 on CoinMarketCap and is used for fees, staking, and governance.
Mutanabby_AI | ONEUSDT_MR1Simple question:
As a quant trader, do you think this strategy will survive in live trading?
Yes or No? And why?


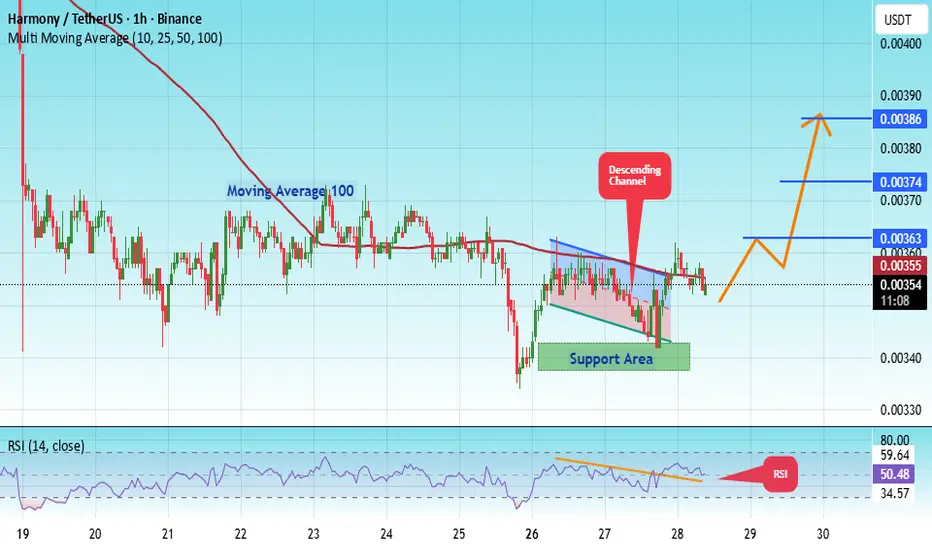
#ONE/USDT – The Final Shakeout Before Reversal?#ONE
The price is moving within a descending channel on the 1-hour frame, adhering well to it, and is heading for a strong breakout and retest.
We have a bearish trend on the RSI indicator that is about to be broken and retested, which supports the upward breakout.
There is a major support area i
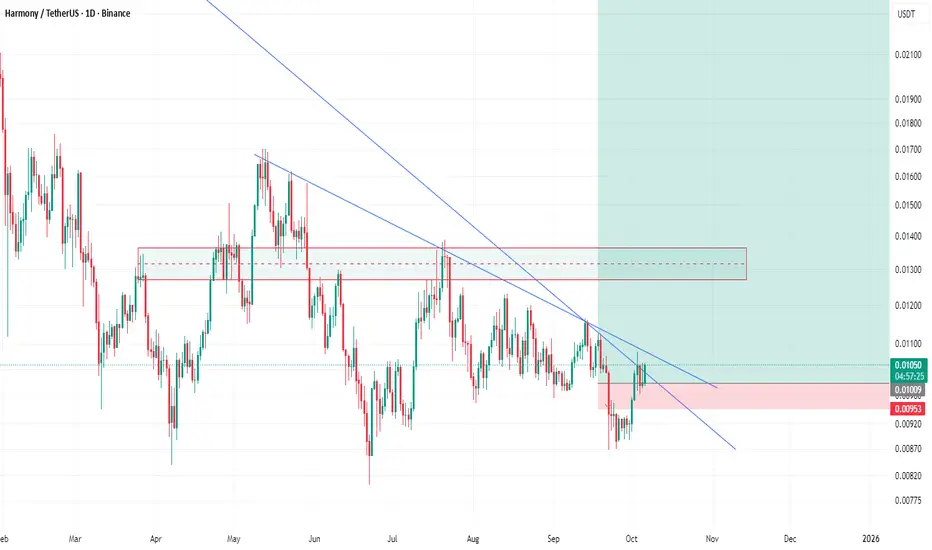
ONE/USDT – The Final Shakeout Before Reversal?The weekly chart of ONE/USDT tells the story of a full crypto market cycle:
from the euphoric highs of 2021 to a prolonged downtrend that has now brought price back into the historical accumulation zone between 0.0055 – 0.0042 — the same area that preceded ONE’s previous bull run.
The breakdown bel

350% is on wayAs you can see from the chart, two important trendlines are broken and getting ready to hit 350% easily, but a bit of patience is required.
See all ideas
Summarizing what the indicators are suggesting.
Oscillators
Neutral
SellBuy
Strong sellStrong buy
Strong sellSellNeutralBuyStrong buy
Oscillators
Neutral
SellBuy
Strong sellStrong buy
Strong sellSellNeutralBuyStrong buy
Summary
Neutral
SellBuy
Strong sellStrong buy
Strong sellSellNeutralBuyStrong buy
Summary
Neutral
SellBuy
Strong sellStrong buy
Strong sellSellNeutralBuyStrong buy
Summary
Neutral
SellBuy
Strong sellStrong buy
Strong sellSellNeutralBuyStrong buy
Moving Averages
Neutral
SellBuy
Strong sellStrong buy
Strong sellSellNeutralBuyStrong buy
Moving Averages
Neutral
SellBuy
Strong sellStrong buy
Strong sellSellNeutralBuyStrong buy
Displays a symbol's price movements over previous years to identify recurring trends.
Frequently Asked Questions
The current price of Harmony / TetherUS (ONE) is 0.00257 USDT — it has risen 1.97% in the past 24 hours. Try placing this info into the context by checking out what coins are also gaining and losing at the moment and seeing ONE price chart.
Harmony / TetherUS price has risen by 1.57% over the last week, its month performance shows a −37.44% decrease, and as for the last year, Harmony / TetherUS has decreased by −83.22%. See more dynamics on ONE price chart.
Keep track of coins' changes with our Crypto Coins Heatmap.
Keep track of coins' changes with our Crypto Coins Heatmap.
Harmony / TetherUS (ONE) reached its highest price on Oct 26, 2021 — it amounted to 0.38000 USDT. Find more insights on the ONE price chart.
See the list of crypto gainers and choose what best fits your strategy.
See the list of crypto gainers and choose what best fits your strategy.
Harmony / TetherUS (ONE) reached the lowest price of 0.00118 USDT on Mar 13, 2020. View more Harmony / TetherUS dynamics on the price chart.
See the list of crypto losers to find unexpected opportunities.
See the list of crypto losers to find unexpected opportunities.
The safest choice when buying ONE is to go to a well-known crypto exchange. Some of the popular names are Binance, Coinbase, Kraken. But you'll have to find a reliable broker and create an account first. You can trade ONE right from TradingView charts — just choose a broker and connect to your account.
Crypto markets are famous for their volatility, so one should study all the available stats before adding crypto assets to their portfolio. Very often it's technical analysis that comes in handy. We prepared technical ratings for Harmony / TetherUS (ONE): today its technical analysis shows the sell signal, and according to the 1 week rating ONE shows the sell signal. And you'd better dig deeper and study 1 month rating too — it's sell. Find inspiration in Harmony / TetherUS trading ideas and keep track of what's moving crypto markets with our crypto news feed.
Harmony / TetherUS (ONE) is just as reliable as any other crypto asset — this corner of the world market is highly volatile. Today, for instance, Harmony / TetherUS is estimated as 3.56% volatile. The only thing it means is that you must prepare and examine all available information before making a decision. And if you're not sure about Harmony / TetherUS, you can find more inspiration in our curated watchlists.
You can discuss Harmony / TetherUS (ONE) with other users in our public chats, Minds or in the comments to Ideas.