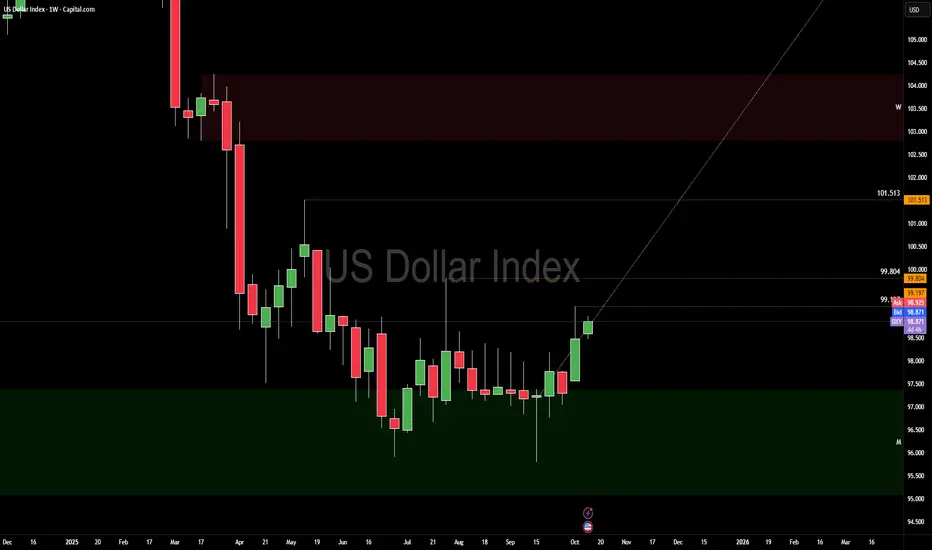
Dollar Index Big Map: Trend Is Your Friend This year, the dollar has been in the red all the way down — until it hit the strong support line of a multi-decade uptrend (white). From there, it bounced to the upside. So, what’s next?
I’d like to share with you a big map of the Dollar Index.
I assume that we are still within the large second leg ((Y)) of the ((WXY)) corrective structure (white).
Within this structure, we can see a smaller-degree (WXY) correction (blue).
Currently, the market is moving in the last leg C of the final upward move in blue wave (Y).
Many times, I’ve observed how beautifully these wave structures align with strong pivot points.
The ultimate target for wave ((Y)) is near the top of wave ((W)), around 121.
This level also matches the target where blue wave (Y) equals blue wave (X) — an amazing correlation!
There are two key confirmation levels marked on the map:
Bullish confirmation — above 110 (this would invalidate the bearish scenario).
Bearish confirmation — below 89 (this would invalidate the ((WXY)) structure).
Trade ideas

Bullish bounce off?US Dollar Index (DXY) has bounced off the pivot which is an overlap support that lines up with the 38.2% Fibonacci retracement and could rise to the 1st resistance.
Pivot: 98.77
1st Support: 98.41
1st Resistance: 100.14
Disclaimer:
The above opinions given constitute general market commentary, and do not constitute the opinion or advice of IC Markets or any form of personal or investment advice.
Any opinions, news, research, analyses, prices, other information, or links to third-party sites contained on this website are provided on an "as-is" basis, are intended only to be informative, is not an advice nor a recommendation, nor research, or a record of our trading prices, or an offer of, or solicitation for a transaction in any financial instrument and thus should not be treated as such. The information provided does not involve any specific investment objectives, financial situation and needs of any specific person who may receive it. Please be aware, that past performance is not a reliable indicator of future performance and/or results. Past Performance or Forward-looking scenarios based upon the reasonable beliefs of the third-party provider are not a guarantee of future performance. Actual results may differ materially from those anticipated in forward-looking or past performance statements. IC Markets makes no representation or warranty and assumes no liability as to the accuracy or completeness of the information provided, nor any loss arising from any investment based on a recommendation, forecast or any information supplied by any third-party.

DXY Demand Area! Buy!
Hello,Traders!
DXY pulls back into a well-defined horizontal demand area, aligning with ICT displacement logic. A bullish reaction from this level may confirm accumulation before expansion toward 99.10 liquidity. Time Frame 3H.
Buy!
Comment and subscribe to help us grow!
Check out other forecasts below too!
Disclosure: I am part of Trade Nation's Influencer program and receive a monthly fee for using their TradingView charts in my analysis.

Bullish bounce?The US Dollar Index (DXY) is falling towards the pivot which is a pullback support and could bounce to the 1st resistance.
Pivot: 98.54
1st Suport: 96.63
1st Resistance: 101.95
Disclaimer:
The above opinions given constitute general market commentary, and do not constitute the opinion or advice of IC Markets or any form of personal or investment advice.
Any opinions, news, research, analyses, prices, other information, or links to third-party sites contained on this website are provided on an "as-is" basis, are intended only to be informative, is not an advice nor a recommendation, nor research, or a record of our trading prices, or an offer of, or solicitation for a transaction in any financial instrument and thus should not be treated as such. The information provided does not involve any specific investment objectives, financial situation and needs of any specific person who may receive it. Please be aware, that past performance is not a reliable indicator of future performance and/or results. Past Performance or Forward-looking scenarios based upon the reasonable beliefs of the third-party provider are not a guarantee of future performance. Actual results may differ materially from those anticipated in forward-looking or past performance statements. IC Markets makes no representation or warranty and assumes no liability as to the accuracy or completeness of the information provided, nor any loss arising from any investment based on a recommendation, forecast or any information supplied by any third-party.

DXY Trade Plan 13/10/2025Dear Traders,
💵 U.S. Dollar Index (DXY) Analysis – 16H Timeframe
📅 October 13, 2025
The U.S. Dollar Index (DXY) remains in a mid-term consolidation phase, but recent bullish momentum suggests that a new upward leg may soon begin.
After testing resistance near 99.10, DXY is showing signs of a short-term pullback. The 97.50–97.80 area (highlighted in blue) stands out as a strong demand/support zone, aligning with previous structure and horizontal support levels.
If the index manages to hold above this area, a bullish reversal from this zone could trigger a continuation move toward the 102.00–102.10 resistance level — the next major upside target.
This scenario would align with a potential recovery in USD strength across major pairs, particularly if macro data supports tightening or a risk-off sentiment in markets.
📊 Summary:
Overall Trend: Bullish bias after correction
Key Support Zone: 97.50 – 97.80
Key Resistance Target: 102.00 – 102.10
Scenario: Waiting for a pullback into 97.5–97.8 zone for a possible long continuation toward 102
Regards,
Alireza!

2025 – The Year of the Normalized Dollar (Episode 2)2025 – The Year of the Normalized Dollar (Episode 2) 📉💵
📆 Feb 25 was just the beginning — and now we’ve got confirmation.
DXY couldn’t hold above structure, and the drop is on. What began as a quiet theme is turning into the macro headline:
The King Dollar is softening... on purpose.
🔍 Chart Context
• 🔴 Rejection at 112.3 — clean and brutal**
• 🔁 100.95 now flipped into resistance**
• 📉 Heading toward Target: 94.37** — the long-term structure low
The structure hasn’t changed — only the velocity has.
This isn’t a flash move. This is policy-meets-price.
🧨 Fundamentals: Trump’s Soft Dollar Doctrine
Back on January 23, Trump told the world exactly what he wanted:
“I’d like to see interest rates come down… a lot.”
“Oil down, prices down, inflation gone — and then rates down.”
Translation?
💵 A weaker dollar to fuel exports, ease debt loads, and juice the real economy.**
This is not weakness — it’s a recalibration.
Add in:
• Tariffs + labor policy inflation
• Pressure on Powell
• Geopolitical chess moves (Putin negotiations, Middle East detente)
→ and you’ve got a coordinated softening playbook.
📉 What’s Next?
• 🔹 Break 98 = Target 94.37 opens wide
• 🧱 If 94 cracks, we’ll re-assess — but for now, that’s the magnet
• DXY needs a miracle to reclaim strength without Fed resistance easing
2025 could be the year the dollar gets normalized by force — not finesse.
🔄 Perspective Shift 🔄
This isn’t dollar death — it’s dollar diplomacy.
Strong enough to hold global weight, soft enough to boost Main Street.
You think this isn’t coordinated? Look again. 📡
One Love,
The FXPROFESSOR 💙
First episode:
⚠️ I’m not a financial advisor — just a philosopher with better chart vision than 99% of the noise out there. What I share is my view, not a signal. You trade? You’re responsible. Just don’t blame me when I’m right again.

Will DXY Sustain The Pressure Amid Current Uncertainties?Fundamental approach:
- The US dollar retreated this week, pressured by expectations of continued Fed easing and signs of emerging economic weakness.
- The Fed's latest Beige Book revealed that economic activity remained flat, with increasing layoffs across districts, and middle- to lower-income households reducing their spending, reinforcing dovish expectations. Chair Powell's scheduled remarks and the ongoing government shutdown, which began on 1 Oct, have delayed critical data. The Sep NFP was not released, and the Sep CPI is rescheduled for Fri, 24 Oct, adding to the uncertainty surrounding the dollar's outlook.
- Meanwhile, the euro gained ground as European currencies strengthened against the greenback, with the dollar down around 10% YTD.
- The dollar may face continued downside pressure as markets await the Fed's October 28-29 meeting, where a 0.25% rate cut is widely anticipated. However, delayed economic data releases could inject volatility into near-term trading.
Technical approach:
- DXY is trading within the ascending channel and retesting the support at 98.60. The index is slightly above both EMAs, indicating the upward momentum persists.
- If DXY remains above the key support at 98.60, confluence with the ascending channel's lower bound, the index may rise to retest the psychological resistance at 100.00.
- On the contrary, breaking below the support and both EMAs may prompt the DXY to retest the following support at 97.15.
Analysis by: Dat Tong, Senior Financial Markets Strategist at Exness

DXY 4H🔹 Overall Outlook and Potential Price Movements
In the charts above, we have outlined the overall outlook and possible price movement paths.
As shown, each analysis highlights a key support or resistance zone near the current market price. The market’s reaction to these zones — whether a breakout or rejection — will likely determine the next direction of the price toward the specified levels.
⚠️ Important Note:
The purpose of these trading perspectives is to identify key upcoming price levels and assess potential market reactions. The provided analyses are not trading signals in any way.
✅ Recommendation for Use:
To make effective use of these analyses, it is advised to manually draw the marked zones on your chart. Then, on the 5-minute time frame, monitor the candlestick behavior and look for valid entry triggers before making any trading decisions.

DXY - Dollar Could Rise if Fed's Cook Wins Fight Against Her DiDollar investors would express relief if U.S. courts thwart President Trump's attacks on the Federal Reserve, Commerzbank's Thu Lan Nguyen says in a note. A court on Friday heard Fed Governor Lisa Cook's request for a temporary retraining order to block Trump from removing her from the role. The hearing ended without a ruling. Trump faces the threat of a defeat as it seems questionable whether the grounds for Cook's dismissal are legally valid, Nguyen says. If the Fed's independence holds firm and the court rules against Cook's dismissal, the dollar could rise. "However, the courts' final ruling is still pending. It's "by no means guaranteed" that Trump would accept a ruling against him, she says.

Dollar Index (DXY) Rises to Highest Level in Over Two MonthsDollar Index (DXY) Rises to Highest Level in Over Two Months
The chart shows the Dollar Index (DXY) trading above the 99-point level today — its highest since early August. The dollar’s strength is supported by the weakening of other currencies:
→ The yen is weakening amid expectations of looser monetary policy. Conservative Sanae Takaichi could become the first female prime minister in Japan’s history, pursuing substantial spending and economic stimulus.
→ The euro remains under pressure amid France’s political crisis. Following the resignation of Prime Minister Sébastien Lecornu’s government, President Emmanuel Macron stated he plans to appoint a new prime minister this week.
Will the Dollar Index continue to rise?
Technical Analysis of the DXY Chart
On 19 September, we provided a significant analysis of the DXY chart in which we:
→ Confirmed the relevance of a descending channel (shown in red), which includes intermediate QL and QH lines dividing the channel into quarters.
→ Highlighted a reversal upward from the QL line (shown with an arrow).
→ Suggested a bullish scenario aiming to reach the QH line.
This scenario has indeed unfolded:
→ On 25 September and 6 October (as shown by arrows), the QH line acted as resistance.
→ On 7 October, it was broken upward, underlining bulls’ strength.
Given this, it is reasonable to suggest that bulls remain in control, while:
→ DXY fluctuations since mid-September’s low are forming an upward channel;
→ its upper boundary may act as resistance, potentially triggering a pullback towards the Support line;
→ the upper boundary of the red channel appears to be a key target for the current rally that began last month.
This article represents the opinion of the Companies operating under the FXOpen brand only. It is not to be construed as an offer, solicitation, or recommendation with respect to products and services provided by the Companies operating under the FXOpen brand, nor is it to be considered financial advice.
DXYThe dollar just isn’t getting much love lately. It’s been losing steam, struggling to bounce, and the charts aren’t helping its case. With talk of the Fed easing up and other currencies picking up strength, there’s not much keeping the dollar afloat right now. Unless something shifts, it looks like the dollar could stay under pressure for a while.

Dxy index on high time frame
"Focusing on the DXY index on the high time frame, a downward trend is observed on the daily time frame. Utilizing the liquidity concept, the price has swept liquidity and appears poised for a decline. The first potential target could be around 97.5."
If you have more insights to share or need further assistance, feel free to let me know!

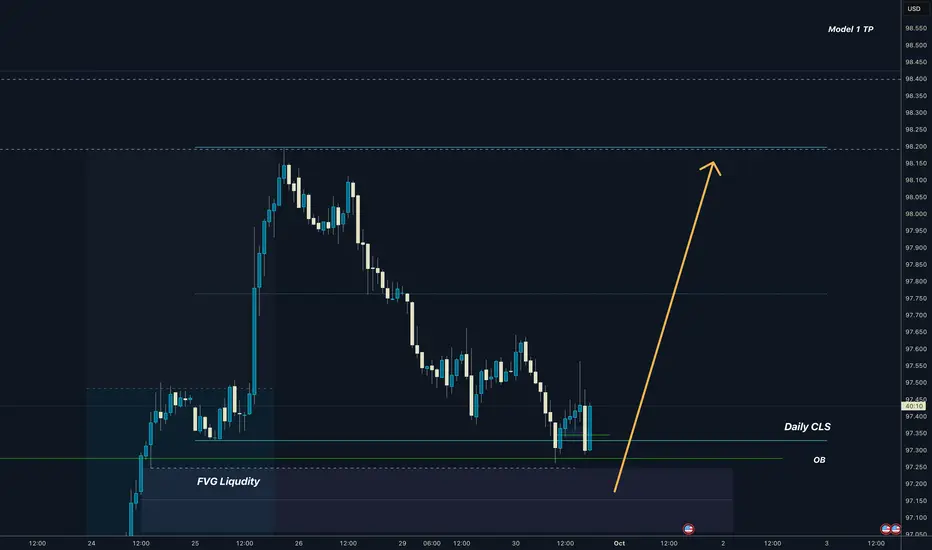
Dollar I Daily CLS I Manipulation I Bullish HTFDollar just manipulated Daily CLS range while HTF bias is nicely bullish
Im still open to the dip to FVG before it goes higher
Big picture view
Adapt useful , Reject useless add what is specifically your own.
Trade safely
Dave
Bearish drop off?US Dollar Index (DXY) has reacted off the pivot and could drop to the 1st support which is a pullback support.
Pivot: 98.91
1st Support: 98.43
1st Resistance: 99.43
Disclaimer:
The above opinions given constitute general market commentary, and do not constitute the opinion or advice of IC Markets or any form of personal or investment advice.
Any opinions, news, research, analyses, prices, other information, or links to third-party sites contained on this website are provided on an "as-is" basis, are intended only to be informative, is not an advice nor a recommendation, nor research, or a record of our trading prices, or an offer of, or solicitation for a transaction in any financial instrument and thus should not be treated as such. The information provided does not involve any specific investment objectives, financial situation and needs of any specific person who may receive it. Please be aware, that past performance is not a reliable indicator of future performance and/or results. Past Performance or Forward-looking scenarios based upon the reasonable beliefs of the third-party provider are not a guarantee of future performance. Actual results may differ materially from those anticipated in forward-looking or past performance statements. IC Markets makes no representation or warranty and assumes no liability as to the accuracy or completeness of the information provided, nor any loss arising from any investment based on a recommendation, forecast or any information supplied by any third-party.

DXYHello... According the expectations of a two-step reduction in US interest rates based on CME, as well as global geopolitical tensions, the recent China-US dispute, and the continuation of the Russia war, the demand for safe assets, including the dollar, will increase. On the other hand, we are witnessing a decrease in the interest rate of ten-year US bonds, so I expect the value of the dollar to increase in the coming days... Technically, the dollar index has broken into an upward triangle and all of indicators indicate to an upward trend. Good luck.

Out into Right-field she goes!-⚠️ Market Forewarning: Potential Weakness in the U.S. Dollar (USD)
Issued on: October 12, 2025
Prepared by:
Disclaimer: The following is for informational and educational purposes only and does not constitute financial advice. Trading and investing involve risk. Please consult a licensed financial advisor.
Overview:
Based on a convergence of technical indicators, macroeconomic factors, and cyclical analysis, we are issuing a forewarning regarding potential near- to mid-term weakness in the U.S. dollar (USD).
Recent developments in the global macroeconomic landscape—paired with emerging technical patterns—suggest that the greenback may be entering a corrective or even impulsive decline phase, particularly against major currency pairs such as the EUR/USD, GBP/USD, and JPY/USD.
🔍 Technical Analysis Breakdown:
1. Supply and Demand Ray Line Zones
The DXY (U.S. Dollar Index) is currently testing a multi-month supply zone between 108.50 – 109.30, which has historically acted as a reversal region.
Demand zones below near 104.00 – 103.20 have weakened after multiple tests, suggesting a likely breakdown and continuation of downward momentum.
The ray line trend indicates supply is overtaking demand, as evidenced by fading bullish volume and weaker retracements on rebounds.
2. Elliott Wave Pattern
The broader wave structure from the March 2024 low appears to have completed a 5-wave impulsive cycle, peaking around September 2025.
Current price action suggests we are in the early stages of an A-B-C corrective wave:
Wave A likely concluded in early October with a sharp drop.
A shallow Wave B retracement is in progress but struggling to reclaim previous highs.
If pattern symmetry holds, Wave C could extend toward the 102.00 – 101.50 zone, in line with Fibonacci projection levels (1.618 extension of Wave A).
3. Pivot Market Points
October’s monthly pivot point lies around 105.80, and price is trading consistently below it — a bearish sign.
Key support pivots reside at 104.20 (S1) and 102.75 (S2); a breach below these levels could confirm further downside.
Resistance at the 107.60 – 108.00 range remains firm and unbroken.
🔮 Forward Outlook: Bearish Bias
Given:
Sustained rejection from a known supply zone,
A likely Elliott Wave correction unfolding,
And consistent trading below pivot levels,
…we anticipate a bearish trajectory for the USD over the next 1–3 months, barring a major macroeconomic shock or intervention.
Target zones:
Short-term: 104.20
Mid-term: 102.00
Risk invalidation: Close above 109.50 with strong bullish volume
📉 Key Drivers to Watch:
U.S. Federal Reserve commentary and policy shifts
Treasury yields and bond market stress
Geopolitical developments impacting safe-haven flows
Inflation print volatility (CPI/PPI releases)

DOLLAR INDEX 97.999-98 IF RESPECTED A S A BUY FLOOR THEN consider to selll GOLD ,SILVER COPPER eurusd sell,audusd sell,usdjpy buy,gbpusd sell, usdzar buy .
the dollar index is the measure of the value of us dollar to basket of six other mejor currency and its affected by the price action of US10Y.
LAYER BY LAYER .
DONT RUSH
#DOLLAR #DXY

DOLLAR INDEX DXY The US Dollar Index (DXY) recently traded around 98.85 on October 10, 2025, experiencing a slight decline after a daily rejection from a supply roof @ 99.516 the dxy is standing on a daily support structure and lack momentum after the FOMC MEETING , the federal reserve under the chairman control of sir, Jerome Powell cut cut rate by 25basis point from 4.25%-4.5% to 4.0%-4.25%.
The next Federal Open Market Committee (FOMC) meeting is scheduled for October 28-29, 2025. During this two-day meeting, the committee will discuss and decide on U.S. monetary policy, including the federal funds rate.
Federal Funds Rate Decision Outlook:
The Fed is widely expected to cut the federal funds rate during this meeting to support economic growth amid recent uncertainties.
The current federal funds rate stands at a range of 4.00% to 4.25%. previous 4.25%-4.5% representing a 25basis point cut .
The exact size of the new rate cut and forward guidance will depend on economic data and conditions leading up to the meeting.
key Economic data tools used by FEDS .
These indicators help the Fed assess the state of the economy, inflationary pressures, employment levels, and overall growth, enabling it to set appropriate monetary policy.
(1)Inflation Measures
Consumer Price Index (CPI): Measures the average change in prices paid by consumers for goods and services.
(2)Personal Consumption Expenditures (PCE) Price Index: The Fed’s preferred inflation gauge that measures changes in prices for goods and services consumed by individuals, especially the core PCE excluding volatile food and energy prices.
(3)Employment Data
Non-Farm Payrolls: Monthly report on the number of jobs added or lost in the economy, excluding farms. It's a primary gauge of labor market health.
(4)Unemployment Rate: Percentage of the labor force that is unemployed and looking for work.
Labor Force Participation Rate: Measures the percentage of working-age population active in the labor market.
(5)Gross Domestic Product (GDP)
Measures the overall economic output and growth. The Fed looks at quarterly GDP data to understand economic momentum.
(6)Retail Sales and Consumer Spending
Consumer spending accounts for a large portion of economic activity; strong spending may indicate economic strength, influencing Fed decisions.
(7)Manufacturing and Service Sector Data
Reports like the ISM Manufacturing and Non-Manufacturing Indices provide insight into business activity.
Wage Growth and Productivity
Rising wages can signal inflationary pressures, while productivity affects economic efficiency.
(8)Stock market trends, bond yields (e.g., 10-year Treasury yield), and credit market conditions also influence the Fed’s outlook.
(9)JOHN TYLOR RULE.
The Federal Reserve looks at the Taylor Rule during rate decision-making because it provides a systematic, rules-based framework that links key economic variables to the appropriate level of the federal funds rate. the rule helps policymakers gauge whether monetary policy is too tight, too loose, or appropriate based on inflation and economic output.
Why the Fed Considers the Taylor Rule:
Framework for Monetary Policy:
The Taylor Rule offers a clear formula that relates the federal funds rate to inflation deviations from the target (usually 2%) and the output gap (difference between actual GDP and potential GDP). This helps the Fed set interest rates consistent with its goals of stable prices and maximum employment.
Balancing Inflation and Growth:
The rule suggests raising interest rates when inflation is above target or the economy is growing too rapidly (closing output gap), which can prevent overheating and inflationary pressures. Conversely, it recommends lowering rates when inflation is below target or growth is sluggish, supporting economic expansion.
Rule vs. Discretion:
While the Fed retains discretion, the Taylor Rule enhances transparency and predictability in policy decisions, providing a benchmark for evaluating whether current rates align with economic conditions.
Historical Relevance:
The Taylor Rule has been found to approximate the Fed’s policy stance over several decades and helps discipline monetary policy amid economic fluctuations.
Policy Communication:
It aids clear communication to markets and the public about the rationale behind rate moves, reducing uncertainty.
Summary
The DXY reflects the value of the US dollar versus a basket of six major currencies, with the euro composing about 57.6% of the index followed by the Japanese yen, British pound, Canadian dollar, Swedish krona, and Swiss franc.
The US 10-Year Treasury Yield (US10Y) is currently around 4.058% daily open 4.1375 daily close 4.058%, representing the yield investors receive on US government debt with a 10-year maturity. The yield level is a significant driver of financial markets and often correlates with the strength of the US dollar.
Relationship
Generally, a higher US10Y yield tends to support a stronger DXY because higher yields attract international capital, increasing demand for the US dollar.
Movements in DXY and US10Y can also be affected by geopolitical risks, monetary policy expectations, and macroeconomic data, leading to short-term deviations.
THE DXY AND US10Y ARE YOUR TRADING BAROMETER AS A TRADER.
WHEN DXY IS UP EURUSD,AUUSD,USDJPY,USDZAR,USDCAD,NZDUSD,GBPUSD,THEY GO DOWN BECAUSE OF INTERNAL CARRY TRADE ACTIVITIES, BOND YILED AND INTEREST RATE DIFFERENTIAL IN THE FX WINDOW.
WE NEED INSIGHT INTO THE BIS (BANK OF INTERNATIONAL SETTLEMENT TRANSACTION ACTIVITIES TOO.
FOREX IS EDUCATION 100%.
RISK MANAGEMNET
100% PROBABILITY BASED ON ECONOMIC DATA AND FUNDAMENTAL ANALYSIS.
#DXY #US10Y #DOLLAR #BOND #YIELD.
GOODLUCK

Resistance 100The dollar index has already covered more than half of the way to reach the 100 resistance, which it hasn't been able to approach for a long time, and it's highly likely that this will happen.

DXY: The Dollar’s Long Cycle — Heading Back to 9/11 Levels?The U.S. Dollar Index ( INDEX:DXY ) has navigated through decades of pivotal global shifts — from the end of the Gold Standard and the 1979 Oil Crisis to the Plaza Accord, the Global Financial Crisis, and now the post-pandemic monetary reset.
Each of these events marked critical macro turning points — and each time the dollar found new structural strength after major dislocations.
Now, DXY has consolidated above long-term resistance and appears to be building energy for another leg higher.
If history rhymes, we may see the dollar rally toward the levels reached during the aftermath of the September 11 attacks — a zone that historically represented both global uncertainty and U.S. capital inflows.
Bias: Bullish
Target Zone: 120–122
Timeframe: Multi-year (monthly chart perspective)

DXY-EURUSD-GBPUSDDXY seems to be the topic of much discussion in the future. An upward movement in DXY could accelerate the downward movement in the EURUSD-GBPUSD pair. (The moving averages I see on the chart are 8 and 13 exponential moving averages.)

Anticipating a Stronger DollarThe U.S. dollar ( TVC:DXY ) has been strengthening since the 2008 crisis, and I expect this trend to continue. I anticipate the Dollar Index (DXY) could reach a target of 120 by the next election or even sooner.

DOLLAR INDEX (DXY) — TECHNICALS FIRST, FUNDAMENTALS SECOND
Technically, the key level this week is 99.197. If DXY manages a bullish close above it, we should see a weekly structure shift higher. That opens the door for 99.8 → 101.5 as internal algorithmic targets. This isn’t wishful thinking — this is how systems behave when liquidity regimes flip.
Under that lens, any rejections beneath 99.197 or weak closes around it remain valid short setups — but only after structure gives the nod. Don’t force trades ahead of confirmation.
In the background, the dollar is reacting to trade-war rhetoric and political shifts. Trump’s 100 % tariffs on Chinese imports raised volatility, but he later softened his tone, suggesting more cooperation than conflict. Its complet currency war.
Meanwhile, some analysts argue a bullish case for the dollar remains due to relative U.S. productivity strength and higher real yields.
These narratives give motive, but do not override price structure.
So from CORE5’s frame: structure leads, news lags. Let clean price confirmation in the 99.197 zone tell you whether to lean into long bias or respect the risk of failure. Eyes locked.