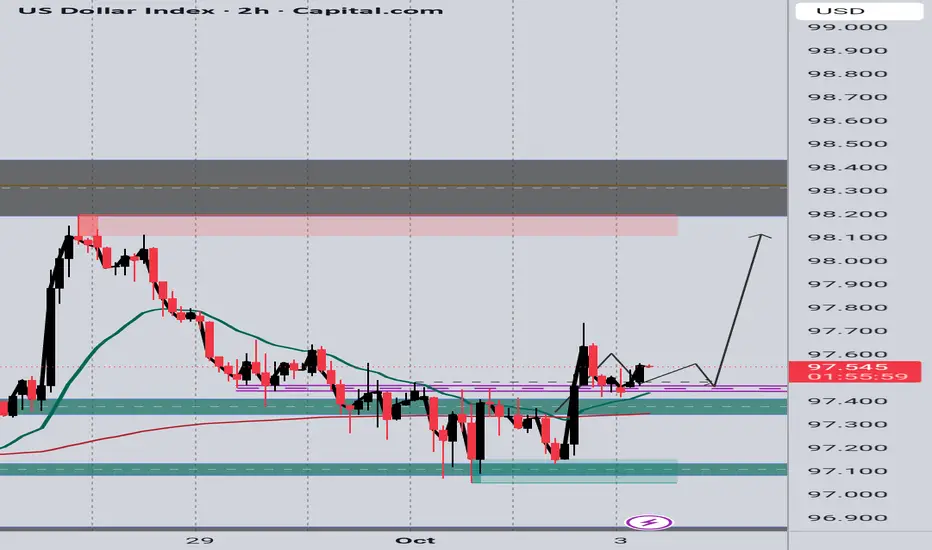
DXYClose your long positions once it hits the red liquidity line and look for a selling opportunity after it enters in to the green supply zone.
Trade ideas

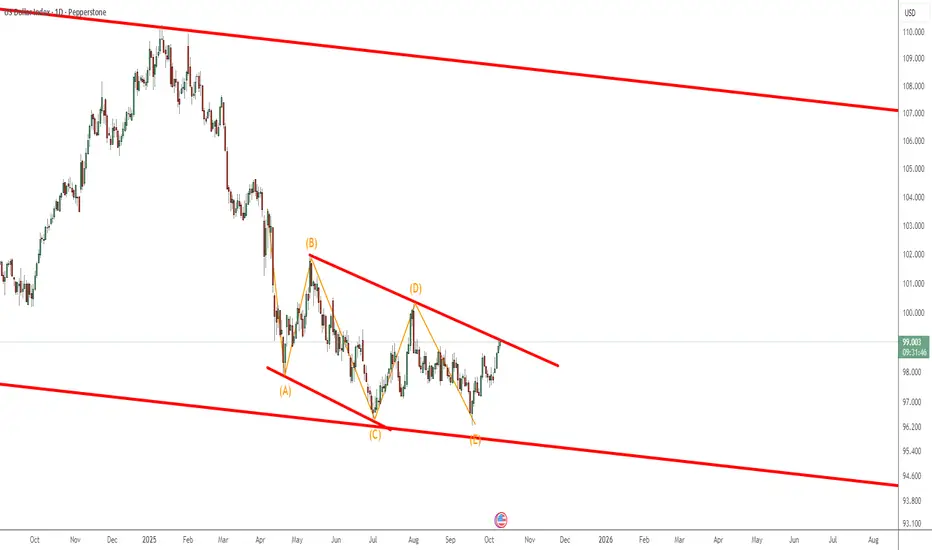
US Dollar Index (DXY) – Ending Diagonal Signals a Major Bullish The DXY is currently testing the upper boundary of a well-defined ending diagonal pattern on the daily timeframe — a structure that often appears at the end of a corrective phase, signaling the beginning of a new impulsive move.
After months of consolidation inside the narrowing wedge, momentum is now turning upward, suggesting a potential bullish breakout is underway. This diagonal likely marks the final wave of a corrective decline (Wave 5 of C) — meaning a larger bullish cycle could be ready to unfold.
Key Technical Notes:
🔹 Price is challenging the upper diagonal resistance near 99.00–99.40.
🔹 A confirmed daily close above this zone would invalidate the bearish wedge and trigger a trend reversal signal.
🔹 Next upside targets: 101.00, 103.50, and potentially 107.00 in extension.
🔹 Pullbacks toward 97.50–98.00 may offer buy-the-dip opportunities within the breakout structure.
Wave Context:
This move could represent the early stages of a new impulse (Wave 1 or Wave A) following the completion of an ending diagonal — a classic reversal signal in Elliott Wave theory.
Momentum Outlook:
Bullish divergence and a tightening structure suggest sellers are exhausted. A confirmed breakout would likely ignite short covering and renewed USD strength across the board.
Bias: ✅ Bullish / Long-biased — watching for breakout confirmation above 99.40.
Some Quick Setups for the DayJust some ideas and things to consider this week with certain instruments mentioned in this video.
Have questions? Feel free to drop me a DM
Trade Safe!

DXY & XAUUSDThe U.S. Dollar Index (DXY) is moving within a long-term upward channel but has entered a downward trend since the beginning of 2025, while gold (XAU/USD) has surged sharply (from around the $2,600 level).
Apart from the large-scale gold purchases by the People’s Bank of China on **July 17, 2015**, which increased its reserves to about **1,658 tons**—roughly **600 tons more** than the previously reported figure in 2009—it seems to me that the bullish trend in gold might (at least temporarily, for a few weeks) pause **only when the U.S. Dollar Index breaks above its short-term downward trendline**.
However, for the U.S. dollar to fully reverse its current downtrend, it would need to break above the **100.3 and 102** levels.

DXY scenarios for remainder of 2025...a simple outlook on dollar index to forecast our upcoming trades... I'm sticking to major pairs only...
let me know what USD pairs you recommend & why?

Move toward 100The Dollar Index has finally signaled a move toward the 100 zone, and we expect it to reach this important level in the next few days.

DXY ready to continue lower, buy EURUSD and coDxy has taken liquidity Buyside liquidity and it is now ready to continue lower. I was bullish till this point, I've now turned bearish.
There are many reason for this analysis, 3 drive pattern, buyside liquidity purge, 4hrs BOS with displacement
TP 1 @ 98.1
TP 2 @ 97.45
TP 3 @ 96.2
Trade accordingly
Dxy will still turn bullish, I will update you then... Enjoy

US DOLLAR TARGETS HITThe U.S. government is still shut down, so no fresh economic data is coming out. That means everyone’s trading half-blind right now—no jobs numbers, no inflation updates, just noise. But the chart still tells the truth. All the bullish dollar targets were hit exactly as planned, and now price is sitting right under that 99.8 key high. That’s the line that decides everything. If market makers push price higher than 99.8, the bullish phase stays alive a bit longer. If it fails there, we drop back into bearish discount territory, where value sits lower and sellers regain control.
Over the past four months, liquidity’s been building above those highs. Now we’re watching a classic stop run—price pushing up to take out weak hands before the real move begins. That’s why cross markets like stocks, gold, and crypto are slipping. The dollar’s acting as a safe spot while everything else bleeds. But the volume looks thin, which usually means manipulation, not genuine demand.
Without the usual USD data, it’s all a guessing game until the Fed minutes drop later today. For now, it’s simple: the 99.8 zone is the make-or-break level. Stay patient, read the structure, and let the chart talk. Price always moves to where orders are missing, and stops where they’re full. Follow that rule, and you’ll never feel lost in the noise.

Dollar Index analysisThe Dollar Index has quite an interesting chart — on the higher cycle, it’s clearly bearish, while on the lower cycles, it’s showing bullish movement. This situation can significantly increase trading risk, making stop-outs more likely, especially on the Dollar Index itself and even more so on EUR/USD.
Right now, we need to see whether it can finally break through the resistance it’s been struggling with for several months and reach 100, or not. ✅

07.10.25 AUDNZD Trade Recap/ Morning ForecastPairs on Watch
FX:AUDNZD Neutral
FX:GBPNZD Short
FX:AUDCHF Long
A short overview of the instruments i am looking at for today, Multi-timeframe analysis down to what i will be looking at for entry

DOLLAR DXYDOLLAR INDEX ON CLOSE OF FRIDAY DUE to oversight i didn't see a descending trendline cross which is also a valid structure for buy and could technically reverse EURUSD,USDJPY,AUDUSD,USDCAD,GBPUSD USDZAR.
DOLLAR OPEN on STRONG BULLISH RALLY ABOVE Friday supply roof my long for dxy will extend into 97.644 supply roof and final TP @99.081

Dollar’s Cracks Are Showing — and the Market Smells BloodThe dollar’s strength cracked in September as fundamentals turned against the greenback. Cooling U.S. inflation, softer consumer spending, and signs of a slowing labour market gave traders fresh confidence that the Fed’s tightening cycle is over.
At the same time, growing chatter about fiscal strain and a possible government shutdown eroded demand for U.S. assets.
The Dollar Index drifted lower while EUR/USD and GBP/USD gained ground, supported by steady European inflation data and improving U.K. growth signals.
By month’s end, markets weren’t chasing yield — they were repositioning for a world where the dollar no longer leads the charge.

DXY Strategy Unlocked — Will Bulls Control the Next Swing?⚡ US Dollar Index (DXY) Swing/Day Trade Setup ⚡
💹 Asset: DXY (US Dollar Index)
📈 Plan: Bullish — Pending Order Strategy
📊 US Dollar Index (DXY) Real-Time Data
Daily Change: +0.55 (+0.56%)
Day's Range: 97.62 – 98.60
52-Week Range: 96.38 – 110.18
🔔 Trade Setup (Thief Plan)
Breakout Entry: 98.800 ⚡ (Set TradingView alarm to catch the move in real time)
Stop Loss: “Thief SL” @ 24,000.0 (only after breakout confirmation).
📝 Adjust your SL based on your strategy & risk appetite, Ladies & Gentlemen (Thief OG’s).
Target: Resistance/overbought zone at 100.20
🎩 Escape target: 100.000 (take profits before market flips).
😰 Fear & Greed Sentiment
Index Level: 64 (Greed)
Market Mood: Moderately greedy, driven by:
📉 Net new 52-week highs vs. lows (bullish)
📊 VIX near averages (neutral)
🛡️ Bonds underperforming stocks (risk-on)
📈 Junk bond demand narrowing spreads (greed signal)
🌍 Fundamental & Macro Score
Fed Rate Cut Probability: 90% (Sept 18 FOMC, 25 bps cut expected)
Key Drivers:
✅ Labor Data: NFP (Sept 5) is crucial for direction.
⚠️ Trade Policy: Court ruled Trump tariffs illegal (appeal pending).
⬇️ Consumer Confidence: Michigan Index at 3-month low (58.2).
⬆️ ISM Manufacturing: Ahead of release, possible USD support.
Safe-Haven Demand: Geopolitical tensions supporting USD.
🐂 Overall Market Outlook Score
Bullish (Long): 60%
Bearish (Short): 40%
Bias: Short-term bullish as long as 97.60 holds.
USD rebound + bond yield strength + equity weakness backing USD.
⚠️ Risk: Break below 97.60 → next target 96.55 (bearish).
💡 Key Takeaways
🎯 NFP Report (Sept 5) = decisive catalyst.
⚖️ Fed debates + trade policy = medium-term uncertainty.
📉 Breakout above 98.80 is the key to bullish continuation.
🔍 Related Markets to Watch
FX:EURUSD
FX:GBPUSD
FX:USDJPY
OANDA:XAUUSD
CAPITALCOM:US30
✨ “If you find value in my analysis, a 👍 and 🚀 boost is much appreciated — it helps me share more setups with the community!”
#DXY #USD #DollarIndex #Forex #DayTrading #SwingTrading #BreakoutStrategy #ThiefTrader #TradingSetup

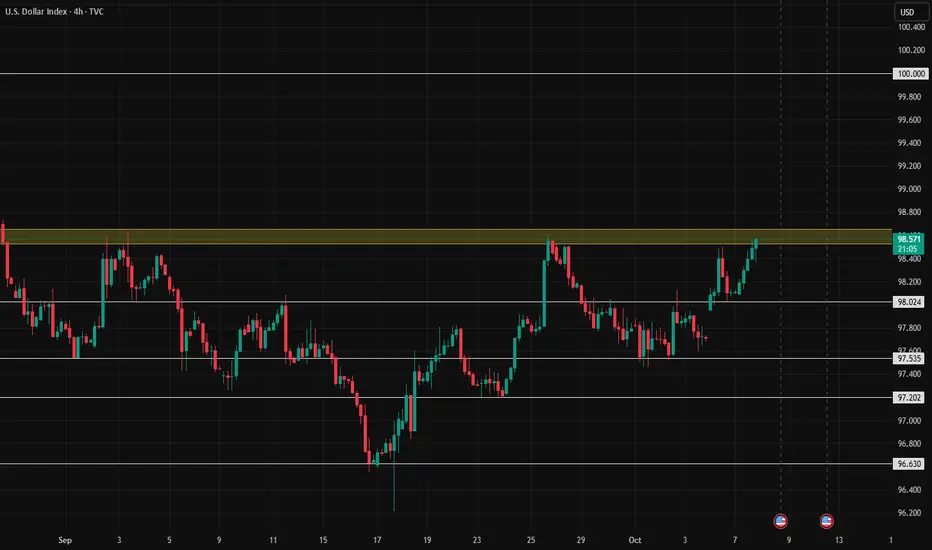
DXY - KEY LEVELS TO WATCH NEXT WEEK Last week the DXY tested the 97.500 level exactly as I forecasted over the week-end and on Thursday we saw a good breakout that pushed the price to the 98.150 area.
On Friday NFP was cancelled because of government shutdown so we didn't see a lot of volume however we had a re-test of the previous day breakout and the price closing above 97.700.
BULLISH VIEW:
Next week an important support to monitor wil be 97.513, a test of it could see the price going up to the 98.600 / 99.600 area.
BEARISH VIEW:
A break of the 97.513 with momentum could see the DXY re-testing 97.513 and the price lowering to 96.800 starting a long term selloff to the 95.000/92.000 long term support.
Please like / comment / share this idea - I will certainly follow up through the week.

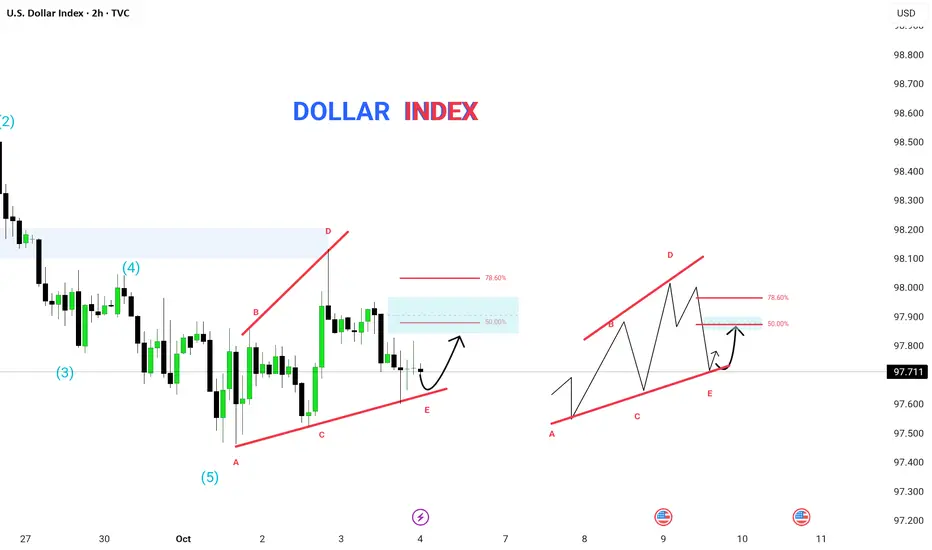
DOLLAR INDEX (DXY) – Elliott Wave & Wedge Pattern Analysis | The US Dollar Index (2H timeframe) is currently developing a corrective wedge structure (A–B–C–D–E) following a completed 5-wave bearish impulse. The current price action suggests a potential bullish correction from the E-point.
🔹 Technical Structure Breakdown:
The previous bearish leg completed a Wave (5), marking the end of an impulse cycle.
Price is now consolidating within a rising wedge pattern, forming the A–B–C–D–E structure.
The E-point is acting as a near-term support, aligning with the ascending wedge base.
Retracement targets:
50.0% → short-term correction level
78.6% → ideal reversal zone before continuation
📊 Key Levels to Watch:
Support Zone: 97.600 – 97.500
Resistance Zone: 97.900 – 98.100
Fib Targets: 50% and 78.6% retracement of the recent swing
⚡ Analyst View:
The E-point bounce could lead to a short-term bullish corrective move toward the 50–78.6% Fibonacci levels before resuming the next bearish leg as part of a broader downtrend.
Traders should monitor reaction at the wedge top for possible rejection and reversal confirmation.
🧠 Pattern: Rising Wedge inside corrective phase
🕓 Timeframe: 2H
💰 Instrument: US Dollar Index (DXY)
🎯 Bias: Short-term bullish correction → medium-term bearish continuation
DXY DOLLAR INDEX The DXY, or U.S. Dollar Index, measures the strength of the U.S. dollar relative to a basket of six major currencies. It reflects how the dollar is performing against these international peers and serves as a key indicator of the dollar’s global value.
Key Points about DXY:
It tracks the U.S. dollar against the euro (EUR), Japanese yen (JPY), British pound (GBP), Canadian dollar (CAD), Swedish krona (SEK), and Swiss franc (CHF).
The euro has the largest weighting in the index (~57.6%), making it the biggest influence on the DXY.
Movements in the DXY indicate whether the dollar is strengthening or weakening overall.
A rising DXY means the dollar is gaining value against this currency basket; a falling DXY means it is losing value.
The index impacts global trade, commodity prices (like gold and oil), and international investment flows.
Practical Use:
The DXY is widely followed by forex traders, economists, and policymakers to gauge dollar strength.
It helps assess the U.S. dollar's impact on global markets and forecast currency market trends.
#DXY #DOLLAR #US10Y

DXY – 2H Chart SetupThe Dollar Index is showing signs of strength after bouncing from the 97.20–97.30 demand zone and reclaiming short-term structure. Price is currently consolidating around 97.55, and holding above this support keeps the outlook bullish.
📈 Bullish Bias:
Above 97.50 support, price is likely to push higher.
Next upside targets are 97.80, then 98.20 – 98.40 key resistance zone.
Retests of the 97.50–97.40 area could provide buy opportunities before the next leg up.
DXY ShortThe Butterfly Harmonic pattern signals a strong bearish trend for TVC:DXY , starting at 97.9.
Eyes on potential targets: TP1 & TP2. 📉

SPX PULLBACK SOON?SP:SPX could start pulling back as soon as this monday, TVC:DXY has double bottomed and ready to run up.
SP:SPX mostly go inverse TVC:DXY
will start short position as soon as i get the confirmation.

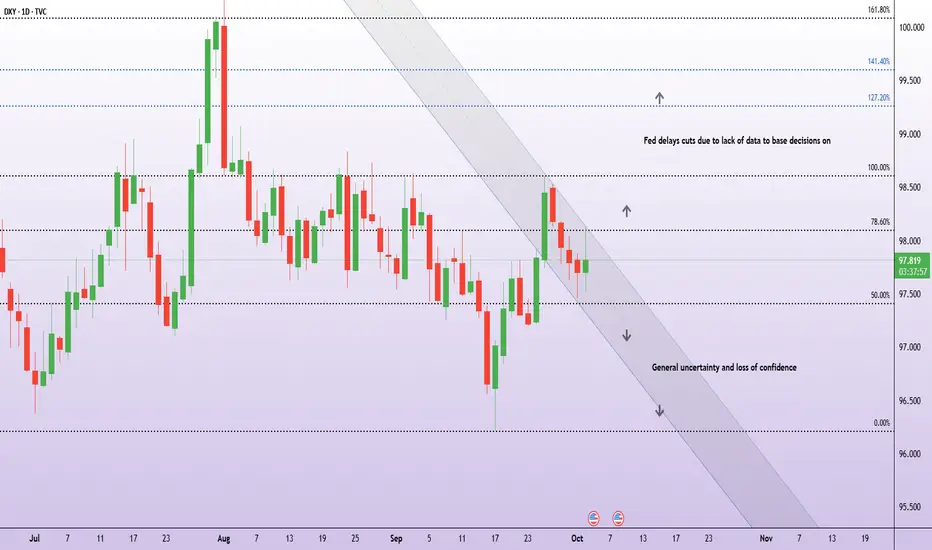
What data releases are at risk from the shutdown? The US dollar came under renewed pressure this week as the federal government entered its first shutdown in nearly seven years.
The shutdown, expected to last at least three days, means traders should not expect the September nonfarm payrolls (NFP) report this week. This key release, often one of the most closely watched on the calendar (by traders and the Federal Reserve), will now be delayed until government operations resume.
Other reports likely to be delayed or canceled include:
Wednesday, 8 October: FOMC Minutes
Wednesday, 15 October: Core and headline CPI inflation
Thursday, 16 October: Producer Price Index (PPI)
Thursday, 16 October: Retail sales
Friday, 17 October: Housing starts
EUR USD and DOLLAR UPDATE
The Dollar Index (DXY) is grinding through a daily order block and has just pierced 97.882.
Technical
If we close above 97.882, that confirms a break and opens continuation toward higher liquidity zones. With tomorrow’s heavy macro news, the setup has volume behind it for a potential massive move.
Macros
U.S. government shutdown is weighing on confidence and trimming growth forecasts (each week may shave 0.1–0.2pp off GDP).
The Fed remains cornered — markets price in rate cuts, but policy credibility is under scrutiny.
Safe-haven flows are mixed: gold at records, dollar stabilizing after Supreme Court support for Fed’s Cook.
Data releases are being delayed by the shutdown, which adds uncertainty and volatility.
EURUSD
We’re short and holding.
4-month rangebound structure remains
Be aware
Dollar strength is being fueled by technical break + macro volume. EURUSD is vulnerable if DXY confirms above 97.882.
But with policy risk and shutdown uncertainty, expect volatility spikes and liquidity hunts around tomorrow’s big data.

DOLLAR DOLLAR index 97.572 found support and GOLD corrects ,the descending trend line acted as a support structure...
