ORCA/USDT — Symmetrical Triangle Apex: The Calm Before the Storm🔎 Chart Overview
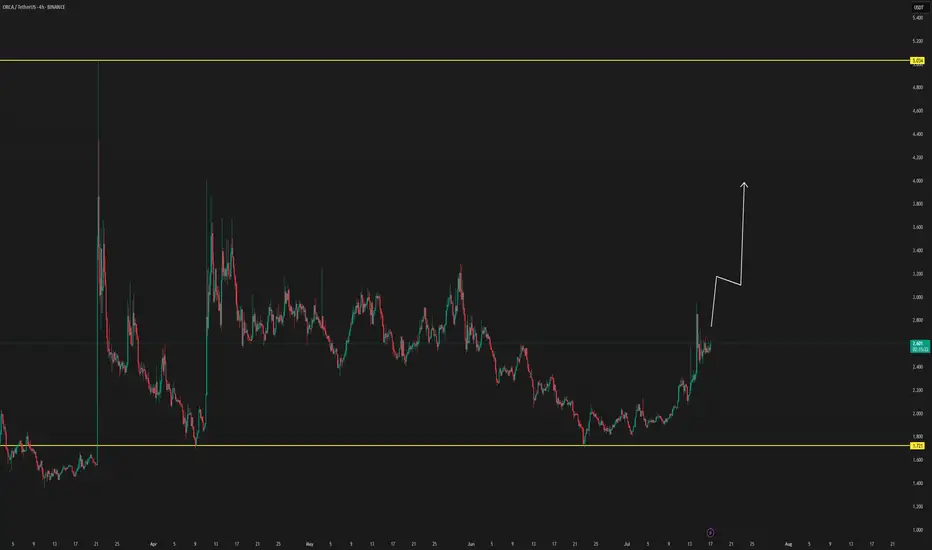
ORCA/USDT has been forming a massive Symmetrical Triangle since early 2024. The pattern is defined by lower highs (gradual selling pressure) and higher lows (steady accumulation by buyers). This represents a phase of tight consolidation, and as the price approaches the apex, the pro

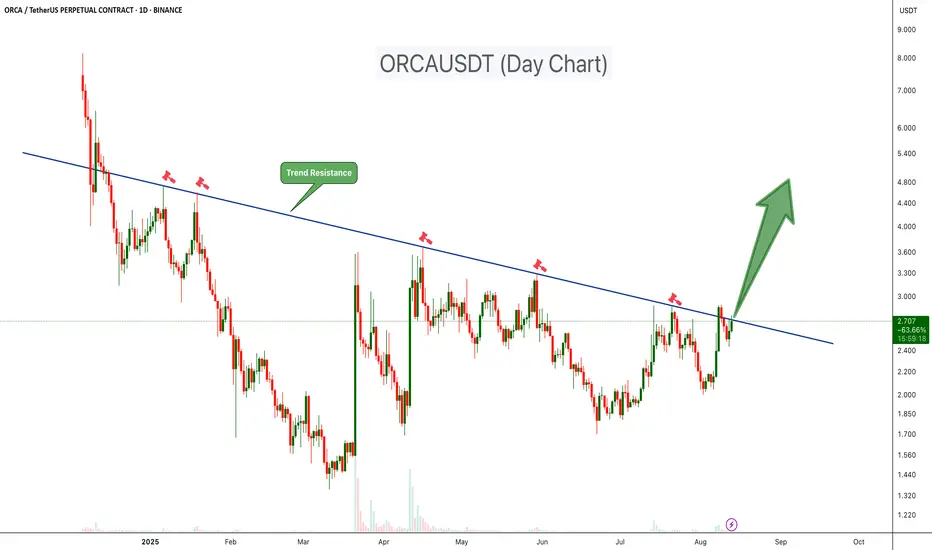
ORCAUSDT at Key Trendline: Big Move Loading!ORCAUSDT has been trading under a clear descending trendline resistance since late 2024, with multiple failed breakout attempts marked by sharp rejections. This trendline has consistently acted as a strong supply zone, pushing prices lower each time it was tested.
Key Points:
-Trend Resistance:
This is eth 2.0, grab your seat before pumpingSame chart pattern like eth 2.0
If smart money tp eth, they will move this counter next.
Grab the seat before the rocket is fire.

ORCA/USDT NEW VOLUME ENTERYORCA shows for the first time in long time ago a new volume uptrend, which can get confirmed in the next hours to a new volume.
When there are new confirmations or updates, they will be listed here below.
If there is new confirmations coming, we could see this coin soon to targets
$3.17
$4.20
B
Orca Moving Fast, Altcoins Market Heats Up (Easy 275% PP)Think fast, act fast, move fast! The altcoins market is heating up and it is not for the faint hearted. Either you take action now, fast, or the market moves away. Low prices to be available never again...
Good afternoon my fellow Cryptocurrency trader, I hope you are having a wonderful day.
A bul

ORCAUSDT Forming Symmetrical Triangle ORCAUSDT is currently forming a symmetrical triangle pattern on the daily chart, a technical setup that often signals strong breakout potential. This type of consolidation pattern typically indicates a period of indecision that could lead to a significant price move once a breakout occurs. With ORCA

ORCA SHORT TERM ANALYSISLong Orca
Stop loss 2.60
Breaking out of symmetrical triangle, target is approximately $5-5.50
Looks like a massive pump is coming.
DYOR

ORCAUSDT 1D#ORCA has bounced off the daily EMA50 and broken out of the symmetrical triangle to the upside. 📈
With bullish momentum building, here are the potential targets:
🎯 $3.511
🎯 $4.177
🎯 $4.842
🎯 $5.789
⚠️ Use a tight stop-loss to protect your capital — stay sharp.

ORCA LONG IDEAORCA has been consolidating for the past few months forming this massive triangle, and it's currently attempting to break out. Could be a very explosive pump.
Target 5$
Stop loss $2.55

ORCA Buy/Long Setup (4H)The ORCA structure is bullish and shows strong bullish momentum. Therefore, we can look for buy/long positions at the origins of the moves.
We have identified two entry points on the chart, where we will be looking for buy/long setups.
Target levels are marked on the chart.
A daily candle closing

See all ideas
Summarizing what the indicators are suggesting.
Oscillators
Neutral
SellBuy
Strong sellStrong buy
Strong sellSellNeutralBuyStrong buy
Oscillators
Neutral
SellBuy
Strong sellStrong buy
Strong sellSellNeutralBuyStrong buy
Summary
Neutral
SellBuy
Strong sellStrong buy
Strong sellSellNeutralBuyStrong buy
Summary
Neutral
SellBuy
Strong sellStrong buy
Strong sellSellNeutralBuyStrong buy
Summary
Neutral
SellBuy
Strong sellStrong buy
Strong sellSellNeutralBuyStrong buy
Moving Averages
Neutral
SellBuy
Strong sellStrong buy
Strong sellSellNeutralBuyStrong buy
Moving Averages
Neutral
SellBuy
Strong sellStrong buy
Strong sellSellNeutralBuyStrong buy