ORCA/USDT — Symmetrical Triangle Apex: The Calm Before the Storm🔎 Chart Overview
ORCA/USDT has been forming a massive Symmetrical Triangle since early 2024. The pattern is defined by lower highs (gradual selling pressure) and higher lows (steady accumulation by buyers). This represents a phase of tight consolidation, and as the price approaches the apex, the probability of a strong impulsive move ahead increases dramatically.
Currently, the price trades around 2.41 USDT, right inside the demand zone at 2.3 – 2.6 (yellow box). This zone has acted as a critical support multiple times since 2024, making it the key battleground for the next directional move.
---
🔼 Bullish Scenario (Breakout)
Trigger: A confirmed 4D candle close above the descending trendline and reclaim of the 3.00 – 3.41 USDT zone.
Confirmation: A breakout accompanied by rising volume would signal strong bullish momentum.
Upside Targets:
🎯 3.41 (first key resistance)
🎯 5.20 (psychological level)
🎯 7.48 (historical resistance)
🎯 9.90 (ATH / ultimate mid-term target)
Invalidation: A breakdown and 4D close below 2.3 USDT would invalidate the bullish setup.
---
🔽 Bearish Scenario (Breakdown)
Trigger: A breakdown below the 2.3 – 2.6 demand zone and loss of the ascending trendline support.
Downside Targets:
🛑 1.60
🛑 0.90
🛑 0.42 (historical Low) if capitulation unfolds.
Invalidation: A swift reclaim above 2.3 – 2.6 and re-entry into the triangle structure.
---
📌 Pattern Implications
The Symmetrical Triangle is a neutral pattern, but once a breakout occurs near the apex, it often leads to powerful trending moves.
The closer the price gets to the apex, the less time remains before volatility spikes.
Volume expansion will be the most reliable confirmation to separate a genuine breakout from a fakeout.
---
🎯 Extra Insight
The 2.3 – 2.6 demand zone is more than just support — it’s a strategic accumulation area where buyers have consistently defended their ground.
Holding this zone and breaking the descending resistance could trigger a multi-month rally.
Conversely, losing this zone could push ORCA into a capitulation phase before the next major cycle begins.
#ORCA #ORCAUSDT #Crypto #Altcoins #Breakout #PriceAction #TrianglePattern #TechnicalAnalysis #BullishScenario #BearishScenario
ORCAUSDT.P trade ideas

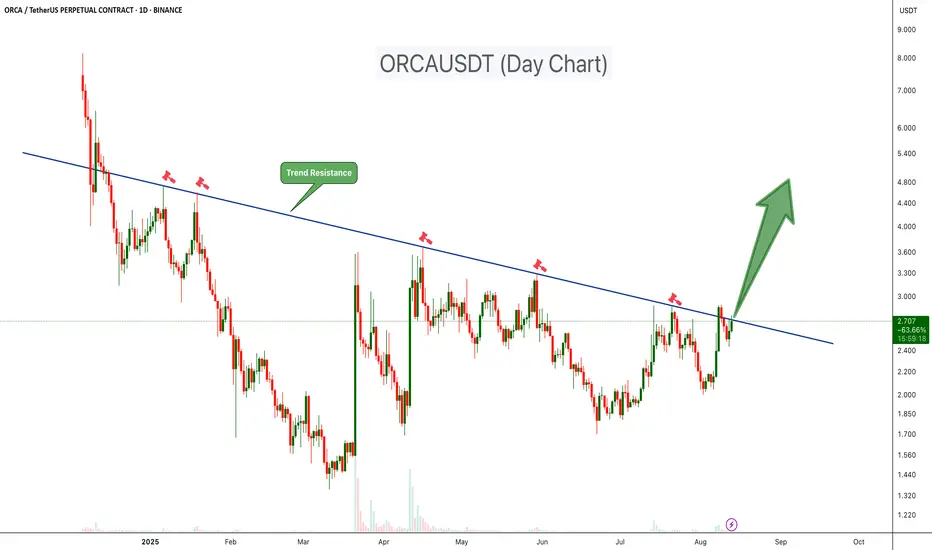
ORCAUSDT at Key Trendline: Big Move Loading!ORCAUSDT has been trading under a clear descending trendline resistance since late 2024, with multiple failed breakout attempts marked by sharp rejections. This trendline has consistently acted as a strong supply zone, pushing prices lower each time it was tested.
Key Points:
-Trend Resistance: Price is once again testing the long-term descending trendline. This level has rejected rallies multiple times in the past (January, March, May, and early August 2025).
-Volume Pickup: Recent price action shows increasing bullish volume, suggesting growing buying pressure as the resistance level is approached.
-Potential Breakout Setup: A strong daily close above $2.90 could signal a confirmed breakout, flipping long-term resistance into support.
Upside Target: If a breakout is confirmed, we could expect a 50%-200% move coming weeks
Risk Factor: A rejection from this zone could see price revisit support at $2.20–$2.00 before any renewed attempt higher.
Buy Level: Above $2.90 (After daily breakout)
ORCA is at a crucial decision point. This is the fifth test of the descending trendline since early 2025; a breakout now could trigger a significant bullish move, while another rejection may extend the consolidation phase.
Cheers
Hexa
This is eth 2.0, grab your seat before pumpingSame chart pattern like eth 2.0
If smart money tp eth, they will move this counter next.
Grab the seat before the rocket is fire.

ORCA/USDT NEW VOLUME ENTERYORCA shows for the first time in long time ago a new volume uptrend, which can get confirmed in the next hours to a new volume.
When there are new confirmations or updates, they will be listed here below.
If there is new confirmations coming, we could see this coin soon to targets
$3.17
$4.20
Best target $5
The trend study shows there is new interest in ORCA
Orca Moving Fast, Altcoins Market Heats Up (Easy 275% PP)Think fast, act fast, move fast! The altcoins market is heating up and it is not for the faint hearted. Either you take action now, fast, or the market moves away. Low prices to be available never again...
Good afternoon my fellow Cryptocurrency trader, I hope you are having a wonderful day.
A bull market means up. It means growth, up, up, up, up and then higher. Yes, some pairs will retrace but that is because these pairs already moved ahead. Once the action stops on one group, another group moves forward and this pattern will continue to repeat long-term. What this means is that there will always be something going up. And this is awesome if you are a trader as more opportunities become available every single day.
Here ORCAUSDT is already bullish, we have the higher low and the full green candle above EMA55 on the daily timeframe. This is as good as it gets. An advance is confirmed so this becomes an easy hold. But, since we are looking at it short-term, after our target hits we collect profits and move on.
Not all trades are short-term not all trading works this way. We have long-term chart setups, leveraged positions, short-term spot and so on. Make sure not to confuse one with the other to avoid mistakes.
Some projects we catch the bottom and let the bull market unravel, others we enter "in-the-action" collect profits and move on.
Whichever way works for you, that's up to you. Some people like to be relaxed while trading others want to take action.
Thanks a lot for your continued support.
Namaste.

ORCAUSDT Forming Symmetrical Triangle ORCAUSDT is currently forming a symmetrical triangle pattern on the daily chart, a technical setup that often signals strong breakout potential. This type of consolidation pattern typically indicates a period of indecision that could lead to a significant price move once a breakout occurs. With ORCA trading at the apex of the triangle and volume gradually increasing, a bullish breakout looks increasingly probable in the near term.
The volume profile supports the idea of a coming rally, as we see accumulation within the pattern and recent volume spikes suggesting renewed investor interest. ORCA’s fundamentals and recent market developments are also attracting attention from both retail and institutional players. If the upper trendline of the triangle is broken convincingly, we could expect a 40% to 50% upward surge, potentially reaching near the $4.50 zone.
Technical traders are watching closely, especially with broader market sentiment improving across altcoins. ORCA’s formation of higher lows within the triangle adds confidence to the bullish thesis. The symmetry of the pattern and breakout projection aligns with historical moves in similar market conditions, reinforcing the anticipated gain targets.
Given its current technical posture, ORCAUSDT presents a high-reward setup. A confirmed breakout could trigger momentum buying, driving price rapidly toward the target. Stay vigilant and watch for confirmation signals like increasing volume and a strong close above resistance.
✅ Show your support by hitting the like button and
✅ Leaving a comment below! (What is You opinion about this Coin)
Your feedback and engagement keep me inspired to share more insightful market analysis with you!

ORCA SHORT TERM ANALYSISLong Orca
Stop loss 2.60
Breaking out of symmetrical triangle, target is approximately $5-5.50
Looks like a massive pump is coming.
DYOR

ORCAUSDT 1D#ORCA has bounced off the daily EMA50 and broken out of the symmetrical triangle to the upside. 📈
With bullish momentum building, here are the potential targets:
🎯 $3.511
🎯 $4.177
🎯 $4.842
🎯 $5.789
⚠️ Use a tight stop-loss to protect your capital — stay sharp.

ORCA LONG IDEAORCA has been consolidating for the past few months forming this massive triangle, and it's currently attempting to break out. Could be a very explosive pump.
Target 5$
Stop loss $2.55

ORCA Buy/Long Setup (4H)The ORCA structure is bullish and shows strong bullish momentum. Therefore, we can look for buy/long positions at the origins of the moves.
We have identified two entry points on the chart, where we will be looking for buy/long setups.
Target levels are marked on the chart.
A daily candle closing below the invalidation level will invalidate this analysis.
Do not enter the position without capital management and stop setting
Comment if you have any questions
thank you

ORCA/USDTKey Level Zone: 2.560 - 2.700
HMT v8.1 detected. The setup looks promising, supported by a previous upward/downward trend with increasing volume and momentum, presenting an excellent reward-to-risk opportunity.
HMT (High Momentum Trending):
HMT is based on trend, momentum, volume, and market structure across multiple timeframes. It highlights setups with strong potential for upward movement and higher rewards.
Whenever I spot a signal for my own trading, I’ll share it. Please note that conducting a comprehensive analysis on a single timeframe chart can be quite challenging and sometimes confusing. I appreciate your understanding of the effort involved.
Important Note :
Role of Key Levels:
- These zones are critical for analyzing price trends. If the key level zone holds, the price may continue trending in the expected direction. However, momentum may increase or decrease based on subsequent patterns.
- Breakouts: If the key level zone breaks, it signals a stop-out. For reversal traders, this presents an opportunity to consider switching direction, as the price often retests these zones, which may act as strong support-turned-resistance (or vice versa).
My Trading Rules
Risk Management
- Maximum risk per trade: 2.5%.
- Leverage: 5x.
Exit Strategy
Profit-Taking:
- Sell at least 70% on the 3rd wave up (LTF Wave 5).
- Typically, sell 50% during a high-volume spike.
- Adjust stop-loss to breakeven once the trade achieves a 1.5:1 reward-to-risk ratio.
- If the market shows signs of losing momentum or divergence, ill will exit at breakeven.
The market is highly dynamic and constantly changing. HMT signals and target profit (TP) levels are based on the current price and movement, but market conditions can shift instantly, so it is crucial to remain adaptable and follow the market's movement.
If you find this signal/analysis meaningful, kindly like and share it.
Thank you for your support~
Sharing this with love!
HMT v2.0:
- Major update to the Momentum indicator
- Reduced false signals from inaccurate momentum detection
- New screener with improved accuracy and fewer signals
HMT v3.0:
- Added liquidity factor to enhance trend continuation
- Improved potential for momentum-based plays
- Increased winning probability by reducing entries during peaks
HMT v3.1:
- Enhanced entry confirmation for improved reward-to-risk ratios
HMT v4.0:
- Incorporated buying and selling pressure in lower timeframes to enhance the probability of trending moves while optimizing entry timing and scaling
HMT v4.1:
- Enhanced take-profit (TP) target by incorporating market structure analysis
HMT v5 :
Date: 23/01/2025
- Refined wave analysis for trending conditions
- Incorporated lower timeframe (LTF) momentum to strengthen trend reliability
- Re-aligned and re-balanced entry conditions for improved accuracy
HMT v6 :
Date : 15/02/2025
- Integrated strong accumulation activity into in-depth wave analysis
HMT v7 :
Date : 20/03/2025
- Refined wave analysis along with accumulation and market sentiment
HMT v8 :
Date : 16/04/2025
- Fully restructured strategy logic
HMT v8.1 :
Date : 18/04/2025
- Refined Take Profit (TP) logic to be more conservative for improved win consistency

Still Have a Chance in This Sideways MarketPrice is currently moving within a wide sideways range between 2.670 – 4.000, which is roughly a 50% price fluctuation—still a tradable range if we can identify key reversal zones and market structure.
From the structure, we can see that BINANCE:ORCAUSDT has broken the previous high and formed a Higher High (HH)—a sign of strong buying momentum. This shift suggests that the support zone around 3.164 – 3.073 could hold and prevent the price from falling back to the bottom of the range at 2.670.
If the price revisits the support area (3.164 – 3.073), we can wait for bullish confirmation candles before entering. The potential upside target would be in the 3.862 – 4.000 zone.
Additional Notes:
Watch for signs of Higher Low (HL) confirmation around support
If HL forms successfully, this could be a base for continuation to the upper range

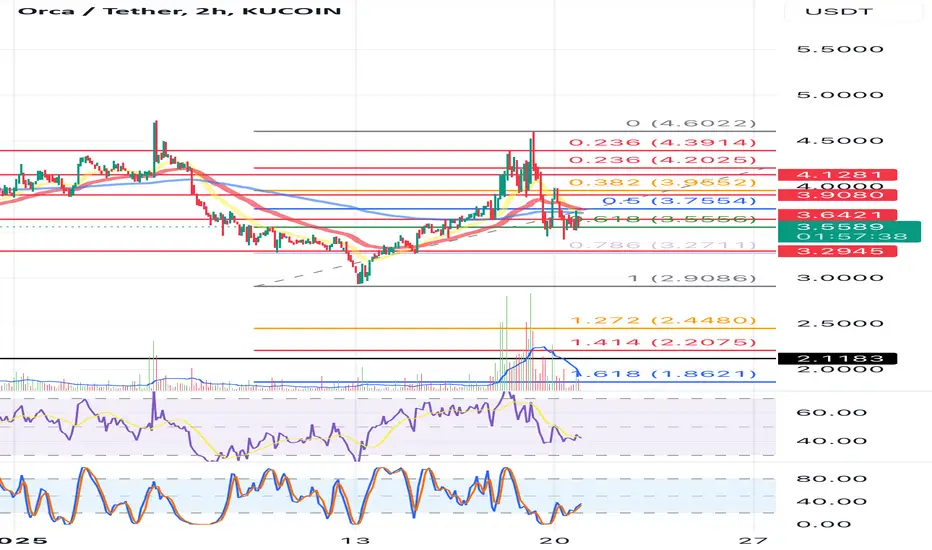
ORCA/USDT – Futures Setup: Potential Short OpportunityORCA is currently testing a resistance zone at 2.940 USDT, an area where selling pressure has historically emerged. Price action indicates a potential rejection, setting up a possible short trade targeting lower support levels.
📌 Futures Trading Levels:
Entry Zone: 2.920 - 2.940 – short positions could be considered upon confirmation of rejection.
Stop-Loss: 3.075 – placed above resistance to limit risk exposure.
Take-Profit Targets:
First TP: 2.79
Second TP: 2.665
Third TP: 2.51
This structure aligns with futures trading principles while maintaining risk management. Let me know if you’d like further refinements! 🚀📊

ORCAUSDT CHART ANALYSİS - EDUCATIONAL POSTConclusion
The NFT market is developing extremely fast, and the blockchain infrastructure has undergone significant changes over the past few years. However, today, there are still many questions about how the NFT market can function and in which areas non-fungible tokens can be used.
For example, one potential application of NFT is the blockchain recording of unique documents. Due to the reliability of the blockchain, diplomas, certificates, and various documents can be issued in NFT format, potentially helping to eliminate the risk of forgery.
NFTs are likely to have, and are already having, some impact on formats for creating and distributing content, and art objects. For now, however, it is primarily a trending investment tool for crypto enthusiasts around the world. The numerous possibilities of this technology will be revealed in the coming years.

ORCAUSDT – First Support at the Blue Box!🐋 ORCAUSDT – First Support at the Blue Box! 🚀
“Patience is key—the blue box is our first support area, but confirmation is everything!”
🔥 Key Insights:
✅ Blue Box = First Support Zone – A reaction here could be a strong buy signal.
✅ No Blind Entries! – We wait for CDV, LTF breakouts & volume confirmation.
✅ If Support Holds, Expect a Strong Bounce – Otherwise, we wait for the next level.
💡 The Smart Plan:
Monitor Price Action at the Blue Box – Buyers must step in.
Wait for Market Structure Break on LTF – No breakout = No trade.
CDV & Volume Profile Must Confirm Strength – We only follow smart money.
“Discipline wins. If confirmation comes, we strike—otherwise, we wait.” 📈🔥🐋
A tiny part of my runners:
🎯 ZENUSDT.P: Patience & Profitability | %230 Reaction from the Sniper Entry
🐶 DOGEUSDT.P: Next Move
🎨 RENDERUSDT.P: Opportunity of the Month
💎 ETHUSDT.P: Where to Retrace
🟢 BNBUSDT.P: Potential Surge
📊 BTC Dominance: Reaction Zone
🌊 WAVESUSDT.P: Demand Zone Potential
🟣 UNIUSDT.P: Long-Term Trade
🔵 XRPUSDT.P: Entry Zones
🔗 LINKUSDT.P: Follow The River
📈 BTCUSDT.P: Two Key Demand Zones
🟩 POLUSDT: Bullish Momentum
🌟 PENDLEUSDT.P: Where Opportunity Meets Precision
🔥 BTCUSDT.P: Liquidation of Highly Leveraged Longs
🌊 SOLUSDT.P: SOL's Dip - Your Opportunity
🐸 1000PEPEUSDT.P: Prime Bounce Zone Unlocked
🚀 ETHUSDT.P: Set to Explode - Don't Miss This Game Changer
🤖 IQUSDT: Smart Plan
⚡️ PONDUSDT: A Trade Not Taken Is Better Than a Losing One
💼 STMXUSDT: 2 Buying Areas
🐢 TURBOUSDT: Buy Zones and Buyer Presence
🌍 ICPUSDT.P: Massive Upside Potential | Check the Trade Update For Seeing Results
🟠 IDEXUSDT: Spot Buy Area | %26 Profit if You Trade with MSB
📌 USUALUSDT: Buyers Are Active + %70 Profit in Total
🌟 FORTHUSDT: Sniper Entry +%26 Reaction
🐳 QKCUSDT: Sniper Entry +%57 Reaction
📊 BTC.D: Retest of Key Area Highly Likely
I stopped adding to the list because it's kinda tiring to add 5-10 charts in every move but you can check my profile and see that it goes on..

ORCAUSDT(ORCA) Updated till 21-03-25ORCAUSDT(ORCA) Daily timeframe range. we can see a massive pump today, peoples filled their bags. alltho the pump retraced if PA can stay above 2.578 it can pull back to 4.433. local support still at 1.446.

ORCA/USDT – Final Leg Up Before a Potential Reversal ORCA/USDT – Final Leg Up Before a Potential Reversal
1. Price action suggests ORCA is making one last upward move before a possible trend reversal.
2. Recent momentum indicates buying strength, but selling pressure could soon dominate.
3. A key resistance zone is approaching, which might trigger a decline.
4. This area could be a good opportunity for traders to exit long positions or prepare for short setups.
5. A small pullback is expected before a significant downtrend potentially begins.
6. Short-term traders may take advantage of the final leg up, but risk management is essential.
7. Swing traders should watch for signs of rejection at resistance before considering short entries.
8. Monitoring volume and price action near resistance levels will be crucial.
9. Setting stop-loss orders can help minimize risk in case of unexpected price action.
10. Market conditions should be closely observed to confirm whether a full reversal is happening.

ORCAwhoever understands what is going into the market, this is an example of whats going on.
most of the projects are going rug, slow rug, exchanges, devs, whales all are manipulating the market.
if you sit and analyze binance projects, 85-90% are sinking, in a very strange way, selling slowly and making retail traders regret, because all are loosing money in spot trade.
while we all are waiting for alts bull market, this is not happening and very possibly wont happen, you could ask why and i would say very simply, billionaires are making money over small wallets and are manipulating the whole shit.
be very carefully where you do invest, never leave you wallet without SL.
the example is in front of you.

ORCAORCA is waking up
and i think it will make a huge rally up during this week.
patience, analyze and lock in...
nfa
dyor

ORCA/USDTKey Level Zone: 3.850 - 3.900
HMT v4.1 detected. The setup looks promising, supported by a previous upward/downward trend with increasing volume and momentum, presenting an excellent reward-to-risk opportunity.
HMT (High Momentum Trending):
HMT is based on trend, momentum, volume, and market structure across multiple timeframes. It highlights setups with strong potential for upward movement and higher rewards.
Whenever I spot a signal for my own trading, I’ll share it. Please note that conducting a comprehensive analysis on a single timeframe chart can be quite challenging and sometimes confusing. I appreciate your understanding of the effort involved.
Important Note :
Role of Key Levels:
- These zones are critical for analyzing price trends. If the key level zone holds, the price may continue trending in the expected direction. However, momentum may increase or decrease based on subsequent patterns.
- Breakouts: If the key level zone breaks, it signals a stop-out. For reversal traders, this presents an opportunity to consider switching direction, as the price often retests these zones, which may act as strong support-turned-resistance (or vice versa).
My Trading Rules
Risk Management
- Maximum risk per trade: 2.5%.
- Leverage: 5x.
Exit Strategy
Profit-Taking:
- Sell at least 70% on the 3rd wave up (LTF Wave 5).
- Typically, sell 50% during a high-volume spike.
- Adjust stop-loss to breakeven once the trade achieves a 1.5:1 reward-to-risk ratio.
- If the market shows signs of losing momentum or divergence, ill will exit at breakeven.
The market is highly dynamic and constantly changing. HMT signals and target profit (TP) levels are based on the current price and movement, but market conditions can shift instantly, so it is crucial to remain adaptable and follow the market's movement.
If you find this signal/analysis meaningful, kindly like and share it.
Thank you for your support~
Sharing this with love!
HMT v2.0:
- Major update to the Momentum indicator
- Reduced false signals from inaccurate momentum detection
- New screener with improved accuracy and fewer signals
HMT v3.0:
- Added liquidity factor to enhance trend continuation
- Improved potential for momentum-based plays
- Increased winning probability by reducing entries during peaks
HMT v3.1:
- Enhanced entry confirmation for improved reward-to-risk ratios
HMT v4.0:
- Incorporated buying and selling pressure in lower timeframes to enhance the probability of trending moves while optimizing entry timing and scaling
HMT v4.1:
- Enhanced take-profit (TP) target by incorporating market structure analysis

ORCAThis currency is likely to fall another 25%
It is a very good opportunity to buy and hold
My price prediction for this currency in a bullrun 2025 is $8-$10

Immediate Scalp Short On OrcaOrca Heavy pump deserves a small pullback and we will utilise it for short. Let's bring that dip in...
