Market Watch: NASDAQ at a Critical JunctureToday, all eyes are on the NASDAQ as we head into a key earnings release. The index is approaching a pivotal short-term level — the 55-day moving average at 24,091, which aligns closely with the August high of 23,969. With the daily RSI nearing oversold territory around 30, there's a strong chance this level could hold on the initial test.
But here's the catch: the weekly chart is flashing warning signs.
🔍 The weekly RSI has already topped out, suggesting momentum is fading. If the 55-day MA doesn't hold, we could see a deeper pullback toward the 55-week moving average at 22,035, which also aligns with the late 2024 high of 22,222.
This level could be the litmus test for the broader bull trend. A weekly close below it would be a major technical breakdown — and let’s not forget, the NASDAQ often leads the S&P.
Stay sharp. The next few sessions could be decisive.
Not trading advice
Trade ideas

US100 DAILY CHARTNASDAQ100 has a tendency to make a new low. We can see how price has been bearish for couple of days now. I expect price to drop lower therefore, a sell opportunity is envisaged
NAS100 – Bullish Shift After LL → HL Structure Change (15M)
Price created a final Lower Low (LL) followed by a clean Higher Low (HL), signaling the start of a trend shift.
Market broke short-term structure with a fresh Higher High, confirming bullish intent.
EMAs are compressing and starting to fan upward, showing building momentum.
RSI is trending above the mid-line, supporting continued upside pressure.
A small FVG (Fair Value Gap) below may act as support if price retests.
Trade Plan
Buy Zone: 24,600 – 24,630
Take-Profit (TP): 24,783.3
Stop-Loss (SL): 24,548 – 24,566 (below FVG + EMA cluster)
Why This Setup Makes Sense
Clear structure transition from bearish to bullish.
Fresh HH confirms continuation potential.
EMAs aligned upward with improving momentum.
Clean upside liquidity target at 24,783.
Invalidation
Break and close below 24,548 invalidates the bullish structure.

NAS100 Algo-Driven Breakout & Volatility Matrix# 🚀 NAS100 19th Nov 2025: 🐂 Algo-Driven Breakout & Volatility Matrix 📊
Asset Class: NAS100 (CFD SPOT) | Price: 24,472 | Time: 10:25 AM UTC+4
Executive Summary
Bias: 🐂 Bullish Continuation / Momentum Breakout
Signal: 🟢 Long on Consolidation Break
Confidence: ⭐ High (Volume Confirmation)
Technical Analysis Methodology
Trend: The macro structure remains strongly bullish with price action respecting the ascending channel on the 4H timeframe. Intraday (15m/1H) reveals a Bullish Pennant contracting near all-time highs. 📈
Momentum: RSI (14) hovers at 58.0, indicating room for upside expansion before reaching overbought territory. ⚡
Volatility: Bollinger Bands are squeezing on the 1H chart, a precursor to a high-volatility expansion. VWAP is currently at 24,450, acting as dynamic support. 🌊
Patterns: A Cup and Handle formation is visible on the 1H chart, with the handle currently testing the 24,450 support zone. A successful breakout targets the 24,600 psychological barrier. ☕
Key Levels
🛑 R2: 24,650 (Fib Extension 1.618)
🚧 R1: 24,580 (Recent Swing High)
📍 Pivot: 24,472 (Current Price / POC)
🛡️ S1: 24,420 (EMA 50 / Handle Low)
🧱 S2: 24,350 (Key Structural Support)
Actionable Trade Plan
Strategy: Momentum Breakout & Trend Continuation 🚀
Entry 1 (Breakout): Buy > 24,510 (Volume Confirmation)
Entry 2 (Pullback): Buy @ 24,425 - 24,440
Stop Loss: 24,380 (Below S1/Invalidation Point)
Take Profit 1: 24,580 🎯
Take Profit 2: 24,640 🎯
Disclaimer: Trading involves risk. This analysis is for educational purposes only.
AI-bubble fears dragged USTEC lower.
Alphabet (GOOGL) CEO Sundar Pichai added to the cautious mood, noting that the current AI boom shows signs of irrationality and warning that no company would be immune if the bubble bursts.
Meanwhile, ADP data showed private-sector jobs falling by roughly 2.5k per week over the four weeks to Nov 1, fueling worries about a labor-market slowdown. Fed Governor Waller reiterated his support for a December rate cut, citing ongoing softness and stagnation in the labor market.
This week’s NFP release may shape expectations for further Fed easing and add to market volatility.
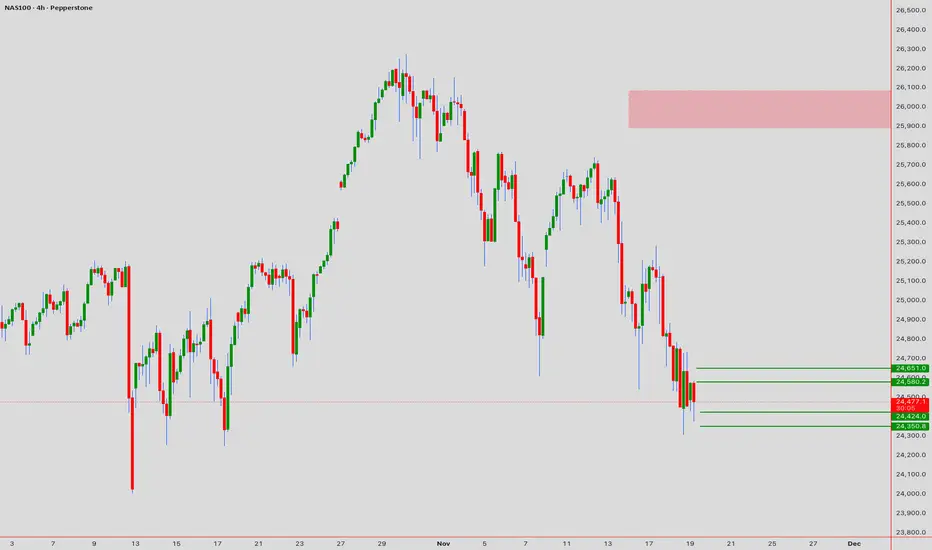
USTEC extended its downtrend, breaking below 24525. The diverging bearish EMAs indicate a potential expansion of the bearish structure.
If USTEC breaks below 24300, the index could decline further toward the next support at 24000.
Conversely, if USTEC closes back above 24525, the index may advance toward the next resistance at 25200.

NASDAQ Signal : US 100 H1 / H4 : long !!!Hello Traders! 👋
What are your thoughts on NASDAQ ?
This correction could offer a buy-the-dip opportunity, with potential for a move back toward the recent highs.
NASDAQ ( US100 ) :
Market price : 24400
Buy limit 1 : 24200
buy limit 2 : 24000
Tp1 : 24600
Tp2 : 25000
Tp 3: 25700
Tp 4 : 26300
SL : 23700
Traders, Don’t forget to like and share your thoughts in the comments! ❤️
Remember this is a position that was found by me and it is a personal idea not a financial advice, you are responsible for your loss and gain.

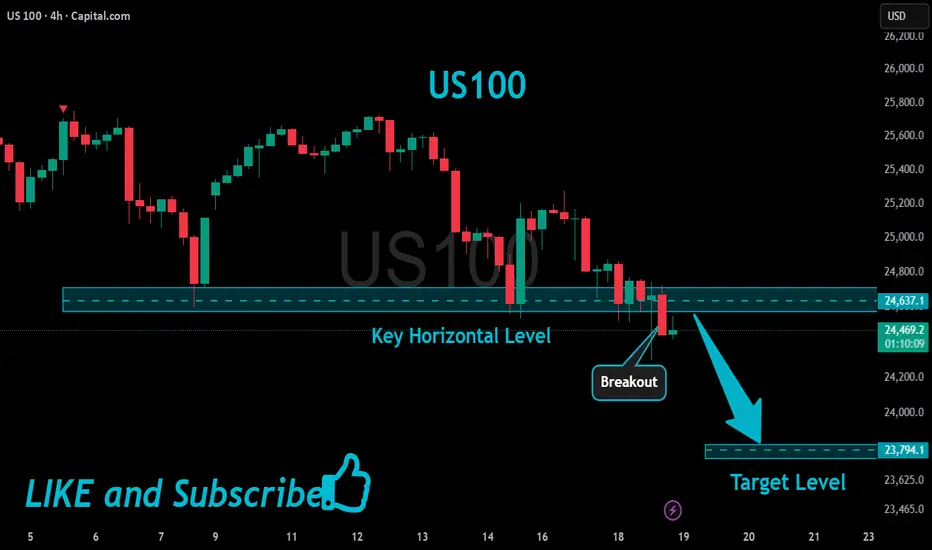
US100 Will Keep Falling!
HI,Traders !
#US100 keeps falling down
And made a strong
Bearish breakout of the key
Horizontal key level of 24637.1
And the breakout is confirmed
So we are bearish biased and
We will be expecting a further
Bearish move down !
Comment and subscribe to help us grow !
Double zig-zag wavecountThe wavecount may be wrong, but I think we are still in wave Y. Maybe it will reach 24300 in it's final move down. Anyway it doesn't look like a reversal, this decline looks corrective.

US100 Resistance Cluster!
HI,Traders !
#US100 made a bullish
Rebound But has now Near hit a resistance
Cluster of the horizontal and
Falling resistance lines
Around 25395.4 area From where we will be
Expecting a bearish move down !
Comment and subscribe to help us grow !

US100 Technical Outlook: Bearish Pullback Inside a Key LiquidityHey traders 👋
The US100 (NASDAQ 100) is currently sitting in a very interesting technical position on the 4-hour chart.
Let’s break it down 👇
🧭 Structure Overview
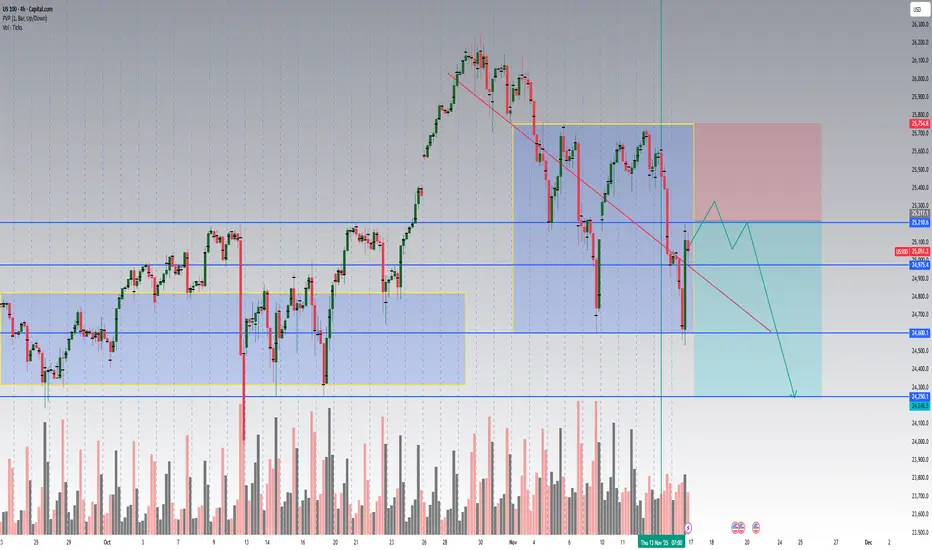
After a strong bullish leg that peaked near 25,800, the index entered a descending corrective channel.
We’ve now hit an important support cluster around 24,975 – 25,000, which previously acted as a pivot zone.
I’ve mapped two main liquidity boxes (blue & yellow) that show where buyers and sellers built positions during the last phases of consolidation.
Notice how price rejected from the upper boundary of the yellow box twice — confirming short-term supply pressure.
📊 Volume Analysis
Volume has been elevated on each red candle, confirming that this down-move isn’t just a retracement without conviction.
However, the most recent bar shows a strong bullish reaction on higher volume, indicating potential absorption — smart money may be defending the 25K handle.
If we see declining volume on the next two green candles → likely dead cat bounce.
If volume expands again above 25,200 → we might get a break and retest of the red trendline for a short-term continuation toward 25,600–25,750.
🧱 Key Levels
Zone Bias Comment
25 210 – 25 220 Resistance Prior liquidity flip zone, possible rejection area
24 975 – 25 000 Current support Reaction zone, watch for confirmation candle
24 600 Target 1 Measured-move projection
24 250 – 24 300 Target 2 Major daily demand zone / possible higher-low base
🔻 Bearish Scenario (Primary Plan)
Short bias remains valid below 25 210.
Expect a short-term bounce into 25 100–25 200, then rejection.
Targets: 24 600 → 24 250.
Invalidation: close above 25 220 on strong volume (would flip the structure bullish).
🟢 Bullish Alternative
If bulls can close a 4H candle above 25 210 – 25 220 with confirmed volume > previous red bar,
the down-channel breaks, and we may see a fast rally back to 25 600 – 25 750.
⚙️ Strategy Note
This chart is for educational & analytical purposes — not financial advice.
I’ll update if we get confirmation on the next 4-hour candle.
👉 Follow for updates and let me know your view — will the 25K zone hold or break next week?
📅 Summary
Trend: Medium-term uptrend, short-term correction
Bias: Bearish below 25 210
Setup: Channel rejection → continuation toward 24 600 / 24 250
Risk: Volume-based breakout above 25 220
Hit 👍 and follow if you found this breakdown helpful — I post detailed NAS100 / SPX / DAX updates every week with volume-based setups.
Let’s grow the community together 🚀
Would you like me to format it with hashtags and keyword tags (so it ranks better in TradingView search, like #US100 #NASDAQ #TechnicalAnalysis #PriceAction #VolumeProfile)? I can add that next.
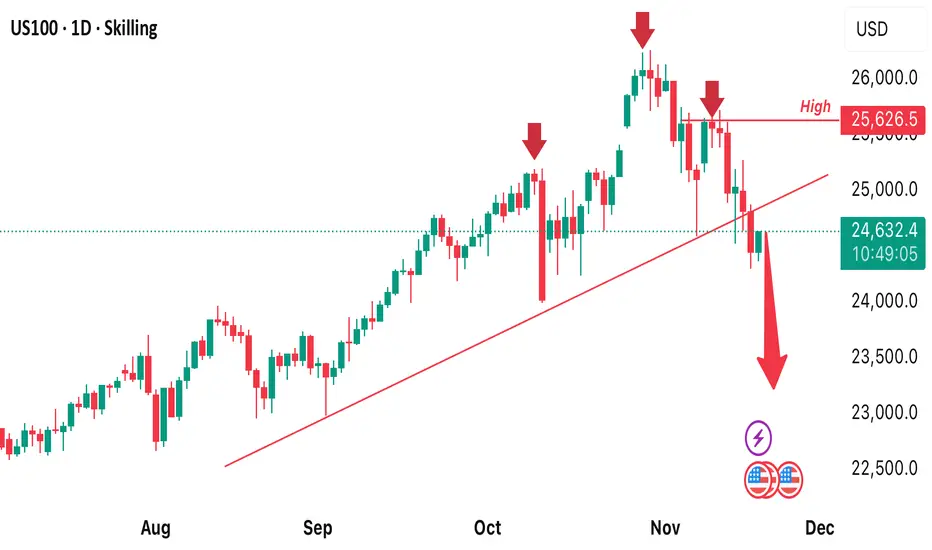
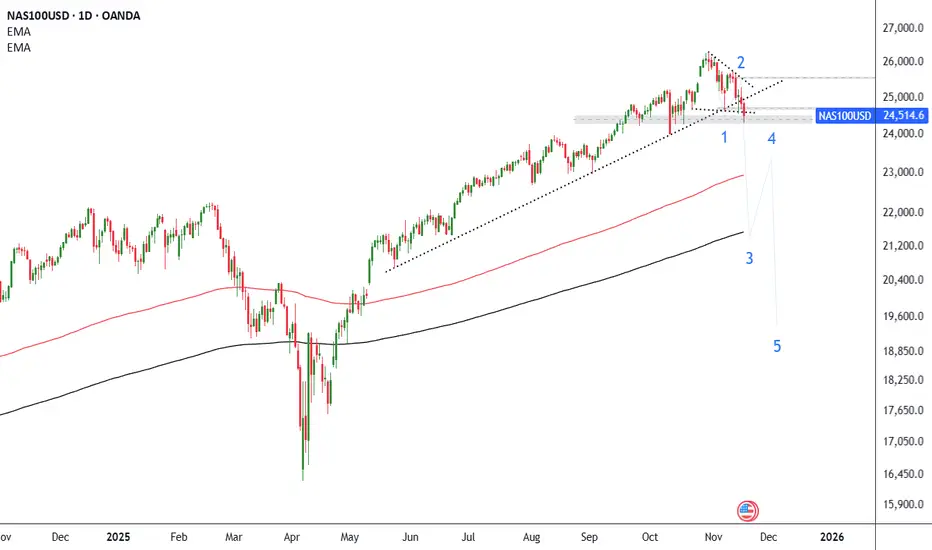
Nasdaq 100 Poised for a Deep Corrective Move After Breaking Key The Nasdaq 100 index has retreated toward a key area after a clear break below the ascending trendline that has held since mid-year, reinforcing expectations of a broader corrective wave. The current decline below the 25,000 – 24,600 zone indicates weakening bullish momentum, especially after breaking the previous low (Point 1), which supports the outlook for the index to move within a multi-leg bearish structure (five-wave decline).
The most likely scenario at this stage is a continued move lower toward the major moving averages, targeting the 22,800 – 22,200 zone as the first stage (Wave 3), followed by a limited rebound (Wave 4), before resuming the decline into Wave 5. This sequence would mark the beginning of a relatively deep correction compared to the prior bullish trend.
SHORT UNTIL LATE APRIL 2026OUR OBSERVATION
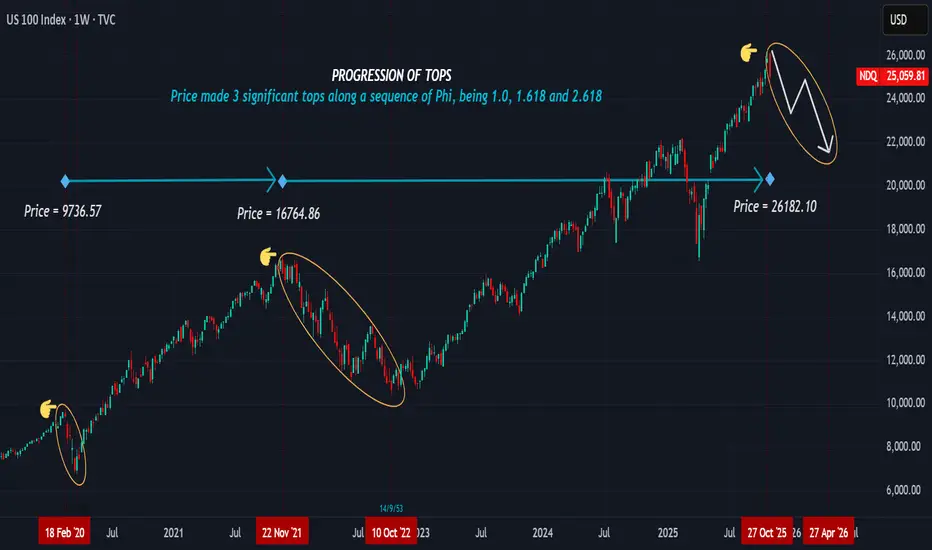
NASDAQ made three significant tops in its price action from 2009 to the present in a sequence of an expanding Phi.
February 2020 High = 9736.57 (This is the 1.0 growth level divided into a Log function)
(9736.57 / 10^4) = 0.973657 (Equivalent to 3/3 = 1.0)
November 2021 High = 16764.86
(16764.86 / 10^4) = 1.676486 ( This is the 5/3 Fibonacci sequence or a variation of 1.618)
Current High at 27th October 2025 = 26182.10
(26182.10 / 10^4) = 2.618210 (This level indicates the 8/3 growth sequence or 2.618 level)
TRADE PLAN
If we project a sequence of thirds, (1/3, 2/3, 3/3), then the three tops from 2009 made an expanding sequence along 3/3, 5/3, and 8/3 nodal points , at 9736.57, 16764.86 and 26182.10 levels respectively. Each node effected a correction, and by projection, we expect price to correct steadily until late April 2026. (1,2,3,5,8...) points form the price tops. The zone between 26182.1 and 26880.XX will be our confluence zone to expect a decline.
We projected the 27th October top as far back as April 2025, where we mentioned a broader cross assets decline. If we compare NASDAQ's price to SP-500 and DJIA, then we can create a larger sequence pattern. SP-500 top reached 6920.34 being 2/3 on the sequence while DJIA reached 48040.64, the 13/3 node. Several markets reaching tops at the same time cooks a sharp long decline. Therefore, we will keep short entries for all three markets until the tops break.
NOTE: We do not trade news effects, we only trade measurable facts the charts indicate. However, we look to the news for signals that add strength to our expectations.
Trade safe, good luck
NAS100 Trade Set Up Nov 18 2025Price is still showing bearish pressure making LL/LH in the 1h and 15m but first id like to see BSL swept followed by IFVG/CISD on the 1m-5m before looking for sells back down to lower SSL levels

Nasdaq 100 Under PressureNasdaq 100 Under Pressure
As the chart shows, the Nasdaq 100 index fell today (point 3) to its lowest level in a month, making it the weakest performer among the major US indices. The sell-off in the technology sector has been driven by a double blow:
→ A reassessment of expectations for the Federal Reserve’s next rate move. According to market observers, the probability of a Fed rate cut on 10 December continues to decline and now stands at 43%, compared with 62% a week earlier.
→ Growing scepticism about the valuations of companies linked to artificial intelligence. A Bank of America fund managers’ survey revealed heavy overcrowding in tech: 54% cited “long Magnificent 7” as the most crowded trade, while 45% viewed an AI bubble as the biggest tail risk.
Technical Analysis of the Nasdaq 100 Chart
When analysing the hourly chart of the Nasdaq 100 on 10 November, we identified an ascending channel. However, mounting selling pressure has resulted in:
→ the channel being extended downwards;
→ its former lower boundary (which acted as support) now acting as the median line and serving as resistance.
From the demand perspective:
→ The lower boundary of the expanded channel may prevent a deeper bearish move.
→ The chart shows a sequence of false bearish breakouts (1–2–3), where the price dips slightly below the previous low only to reverse sharply upward — signs of a Liquidity Grab pattern that may indicate buyer aggression.
From the supply perspective:
→ The 25220–25415 zone appears to be a confirmed FVG area, where a clear market imbalance emerged and sellers strongly dominated.
Bulls may attempt to push the Nasdaq 100 back into the ascending channel, but whether this scenario plays out will largely depend on Nvidia’s quarterly earnings report — a key event for the technology sector, scheduled for release tomorrow.
This article represents the opinion of the Companies operating under the FXOpen brand only. It is not to be construed as an offer, solicitation, or recommendation with respect to products and services provided by the Companies operating under the FXOpen brand, nor is it to be considered financial advice.

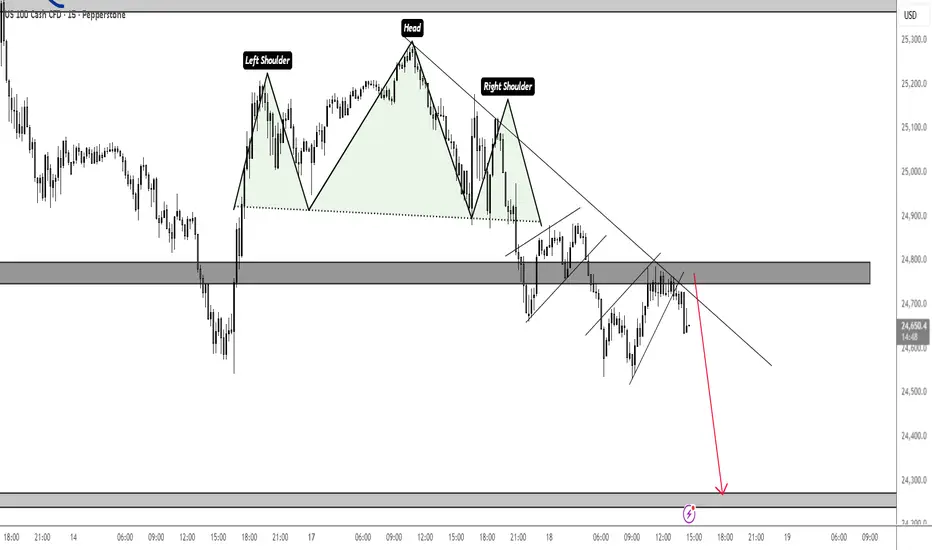
SIGNS OF WEAKNESS ON NASNAS100 1H - This pair is showing signs of weakness, it looks as though price is respecting these areas of Supply and is continuing to trade us lower. We have also been delivered with a higher timeframe break to the downside.
This is indicating further bearishness in this market, I would personally be looking for short temporarily with this pair, as you can see price is approaching an area of Supply now, this could act as an entry point.
We need to wait for price to trade in, clear this area and give us some kind of entry confirmation before getting involved. We would need to see price break structure to the downside before taking us lower.
I have set an alert and will keep you all updated on whether or not I vet a valid short entry for this pair moving forward, its important we treat this pair with caution.

NASDAQ 100 Buy Bias 18/11/2025.
Price is currently trading on the Previous Week Lows, 240 TF low, and Daily Low.
With rejection on the hourly timeframe, break of structure on the 15M and equal lows we can anticipate for a buy.

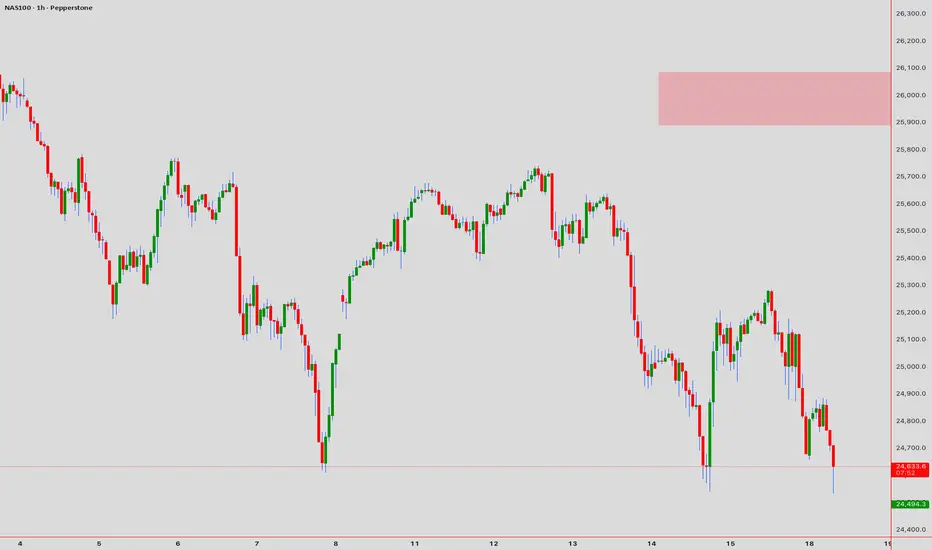
US100 SELL ANTICIPATIONUS100 has shown the willlingness of going lower. Price has violated the H1 Bullish +FVG making it an inversion. We have lots of liquidity around 24541.7 making it the most probable draw.

NAS100 Intraday Market Structure AssessmentActionable Trading Framework
Bullish Scenario (Probability: 60%)
Entry: 24,595-24,620 (consolidation breach confirmation)
Target 1:24,680 (+$62 risk/reward)
Target 2: 24,750 (+$132 profit extension)
Stop Loss: 24,550 (-$45)
Trigger: Break above 24,650 with volume confirmation on 5/15-min charts
Bearish Scenario (Probability: 40%)
Entry: 24,680-24,710 (rejection candle formation)
Target 1: 24,600 (-$80 to +$30 range)
Target 2: 24,520 (-$160 reversal)
Stop Loss: 24,760 (+$50)
Trigger: Failed breakout attempt + RSI divergence on 1-hour chart
Key Technical Confluences
✓ EMA 20/50 Crossover Zone → Dynamic support (1-hour timeframe)
✓ VWAP Alignment → Acts as pivot point at 24,635
✓ Harmonic Pattern → Potential bullish AB=CD completion near current zone
✓ Ichimoku Tenkan-sen → Resistance pressure at 24,705
Execution Rules
1. Entry Confirmation: Engulfing or Pin Bar + Volume Spike on 5-min chart
2. Risk Management: Maximum risk per trade = 1% account size
3. Time Window: Optimal trading 08:00-15:00 UTC+4 (high liquidity period)
4. Exit Protocol: Trail stop at 15-pips after Target 1 achievement
NASDAQBased on the current situation, the NASDAQ continue in bearish movement and try to break the support as marked in the chart. Looking forward to find a sell setup and seeing what happens on the next movement.

Bullish move for NasDaqI'm buying for NasDaq tomorrow, but I have 2 Key Levels that I'm eyeing. But looking at the daily time frame I'm leaning more towards the 2nd area to enter the market tomorrow.

Nasdaq 100: Bulls on the Back Foot as 50DMA Gives WayOur Nasdaq 100 contract is looking heavy. Very heavy.
The price action has been increasingly unconvincing for bulls in November, culminating on Monday with the price closing beneath the 50-day moving average for the first time since April. That’s a noticeable departure from what was seen when tested in the recent past, with the price often reversing higher immediately after. Not on this occasion.
Should the price remain below the 50-day moving average, the next focal point is uptrend support that’s been in place for over six months. In each of the past two sessions the price has traded through the level only to reverse higher, attracting buyers on dips beneath 24650—that’s the battleground to watch in the near term.
If the price were to close beneath uptrend support and 24650, it would bolster conviction that a deeper downside flush may be coming, allowing for shorts to be established with a stop above the uptrend to protect against reversal. 24000 provided support and resistance earlier this year, making it a potential initial target.
Of course, should the price remain above the uptrend, the setup could be flipped with longs set above it or the 50DMA, should the price reclaim it. 25200, downtrend resistance from the record highs, or 25715 are all potential targets. Given the unconvincing price action recently, an obvious bullish reversal signal would be preferable before considering long setups.
The message from RSI (14) and MACD is tilted lower when it comes to directional bias, with the former trending beneath 50, indicating building bearish pressure. MACD remains in positive territory, although having already crossed the signal line from above, at the very least it’s indicating waning topside strength. Given its trajectory, it may soon confirm the bearish signal.
Good luck!
DS

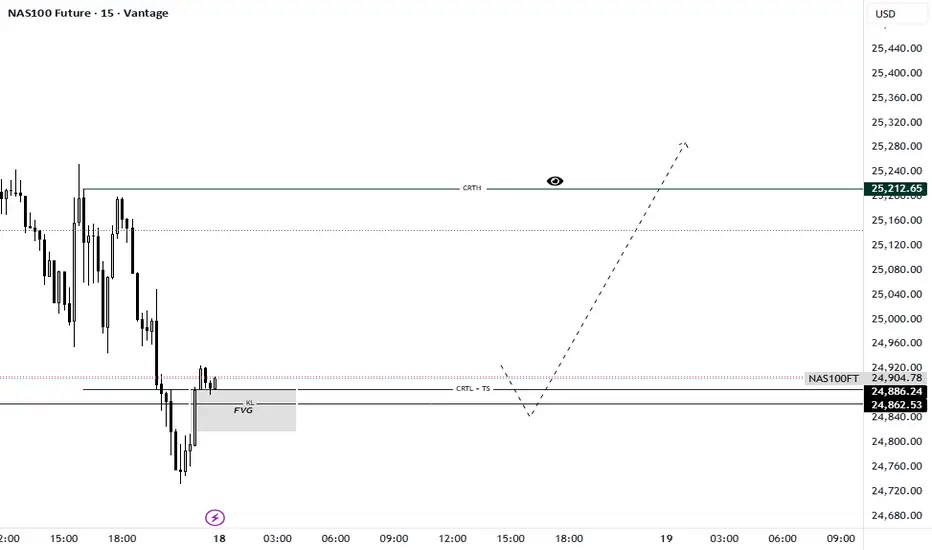
NAS100 Future: The Model #1 Bounce at CRTL SupportTimeframe: 15M | Model: CRT Model #1 / Turtle Soup Reversal
The Nasdaq Index is presenting a high-probability Candle Range Theory (CRT) setup after an aggressive drop. The price action perfectly encapsulates the Manipulation (Candle 2) phase and is setting up for the explosive Distribution (Candle 3) move.
The market has completed a textbook Turtle Soup (TS), aggressively pushing below the structural support to liquidate short-term positions. This hunt was contained by the confluence of the CRTL (Candle Range Theory Low) and a strong underlying Fair Value Gap (FVG).
Here’s the step-by-step breakdown (The CRT Checklist):
Liquidity Sweep: The deep wick confirms the Turtle Soup, clearing the stops below the previous support area around 24,862.53.
Confluence: The reversal attempt is happening right off the FVG area, giving high confidence to the long thesis, as outlined in the CRT Secrets Series (Episode 5: Key Levels).
The Trigger: We are now waiting for the final confirmation—the bullish Model #1 candle close. This candle must reverse the market structure and close decisively above the manipulation low (back into the range).
Targets:
Primary Objective (CRTH): The target is the CRTH (Candle Range Theory High) at 25,217.65, aiming to fill the liquidity above the initial range high.
Mindset: As the chart suggests, this reversal setup has the potential for a swift expansion move, seeking higher liquidity pools.
Discipline: Avoid the temptation to enter early. We must wait for the Model #1 candle to close and confirm the shift in control from sellers back to buyers. Trade what you see, not what you think!
Trade Smart. Trust the Candle Close.
Greetings,
MrYounity