US100How to become successful in forex and stock trading:
1.Master fundamentals and technical analysis.
2.Build and follow a solid trading plan.
3.Apply strict risk management (4–6% rule).
4.Stay disciplined—control fear and greed.
5.Record and analyze every trade.
6.Focus on high-quality setups only.
7.Diversify across assets and markets.
8.Keep evolving—study, adapt, and grow daily.
Trade ideas

NASDAQ100 HIGH PROBABILITY SETUPS SOON!!!🚨 NAS100 HIGH PROBABILITY BUY SETUP 🚨
* Here We Can See Clearly The Next Potential Moves For US100 Coming Hours/Days.
* Keep Your Eyes Close On Your Trading Positions.
* Happy PIP Hunting Traders.
FXKILLA.

NAS100 (1H) Market Outlook📈 NAS100 (1H) Market Outlook
NASDAQ is approaching a major resistance zone, with price currently extending within the upper boundary of a rising channel.
We may see a short-term bullish continuation into the top trendline, followed by a potential corrective drop back toward the 25,300–25,400 demand zone.
🧭 Key Levels:
🟥 Resistance Zone: 26,100 – 26,200
🟩 Support Zone: 25,300 – 25,400
⚙️ Potential setup: Wait for rejection confirmation before short entry.
📊 Market structure remains bullish overall, but extended exhaustion near the top trendline could trigger a pullback before continuation.
✨ Precision. Patience. Profit.
#NAS100 #US100 #IndexTrading #Forex #StressFreeTrading

US NAS 100Preferably suitable for scalping and accurate as long as you watch carefully the price action with the drawn areas.
With your likes and comments, you give me enough energy to provide the best analysis on an ongoing basis.
And if you needed any analysis that was not on the page, you can ask me with a comment or a personal message.
Enjoy Trading ;)

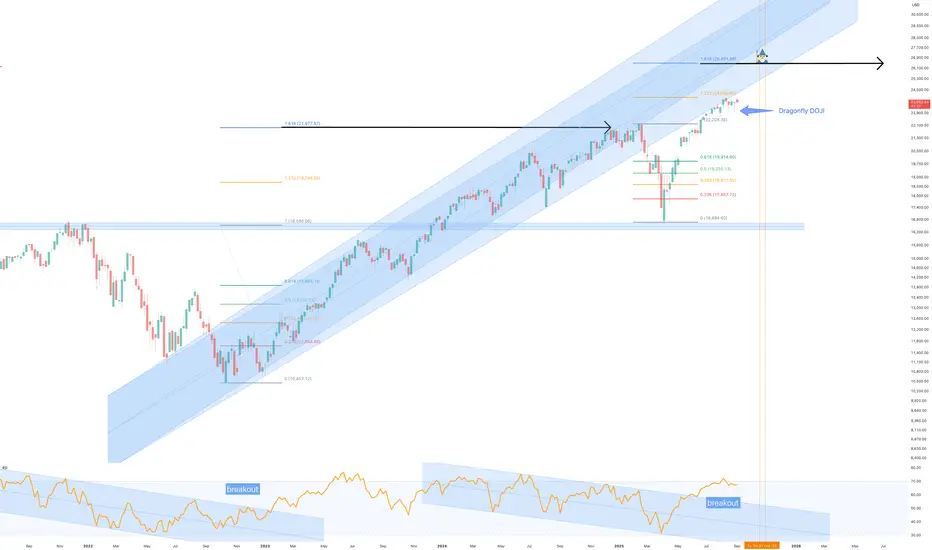
NASDAQ to 26,000 before year end - September, 2025No doubt this idea will be controversial as a majority of ideas published on the platform call for a bearish outlook.
Earlier this year paper hands were flushed out of the market on tariff scares. They couldn’t exit the market fast enough, some didn’t actually know why they were selling as emotions were in full control.
Today those same traders and investors sit in cash as they wait for an opportunity to buy in. Others betting heavily against the trend for Armageddon. All the while the market grinds upwards and onwards.
Two very simple questions everyone must ask when entering or betting against the market:
1. What is the trend?
2. Support and resistance, which is it?
You cannot maintain a bearish bias should you answer both of those questions positively. That’s emotion. Do you find yourself scanning lower timeframes to look for bias confirmation? You'd be in majority then. Notice how many published ideas you see operating in the 15 and 30 minute charts with 2 to 3 month forecasts? Always makes me smile, but it will not change the facts of the chart.
The Trend
Higher lows are evident on the daily chart below, marked out in black. The trend is your friend until the end.
Support & resistance
Look left. On the daily chart we can see multiple support tests with confirmation on past resistance. If the levels do not at first appear, zoom out using a higher timeframe. A majority will zoom in instead to confirm bias, that’s a red flag.
The Put / Call ratio
Retail traders are aggressive in their attempts to “short” this market. Nowhere is that more evident than the Put/Call ratio. Anytime you see dumb money move the put call ratio to 90 and above, the market rips. Just recently short sellers moved the ratio beyond this level. The chart below provides a comparison with the NDX to show what happens next. The rally that follows will typically last up to 2 months on average after this signal.
Why 26000?
The market entered price discovery after the previous all time high breakout of 22k. The forecast area was previously published, see linked ideas. The same conditions that allowed those forecasts now repeat. In addition the Fibonacci extensions; the NDX repeatably rallies to the 1.618 extension after each and every emotional flush out. It’s a gift horse of an opportunity.
Previous years:
Conclusion
Markets climb walls of worry, and this moment is no different. The loudest voices today call for collapse, but the charts, price action, and sentiment data are telling another story entirely. Higher lows, confirmed support, extreme put/call ratios, and Fibonacci extensions all align with one clear outcome: continuation.
A move to 26,000 on the NASDAQ before year-end is not a wild stretch of imagination, but the logical conclusion of repeating market behaviour. Every emotional flush out has historically created the runway for price discovery to the 1.618 extension, and this time is no different.
If you’re betting against the trend, you’re not fighting the market, you’re fighting math, structure, and history. The bears may dominate headlines but that just News. The market is not listening to fear. It’s grinding higher, and the destination is 26,000.
Ww
USNAS100 ForecastThe US100 chart shows strong bullish momentum, breaking above key resistance levels. Price is expected to retrace slightly toward the 25,750–25,500 support zone before resuming its upward move toward the 26,400–26,500 target area. Overall trend remains bullish with higher highs and higher lows formation.
"Thank you for your support! If you found this idea valuable or learned something new, please consider liking and leaving a comment. I’d really appreciate hearing your feedback and thoughts."

NASDAQ100 HIGH PROBABILITY SETUP SOON!!!🚨 NAS100 HIGH PROBABILITY SELL/BUY SETUP 🚨
* Here We Can See Clearly The Next Potential Moves For US100 Coming Hours/Days.
* Keep Your Eyes Close On Your Trading Positions.
* Happy PIP Hunting Traders.
FXKILLA.

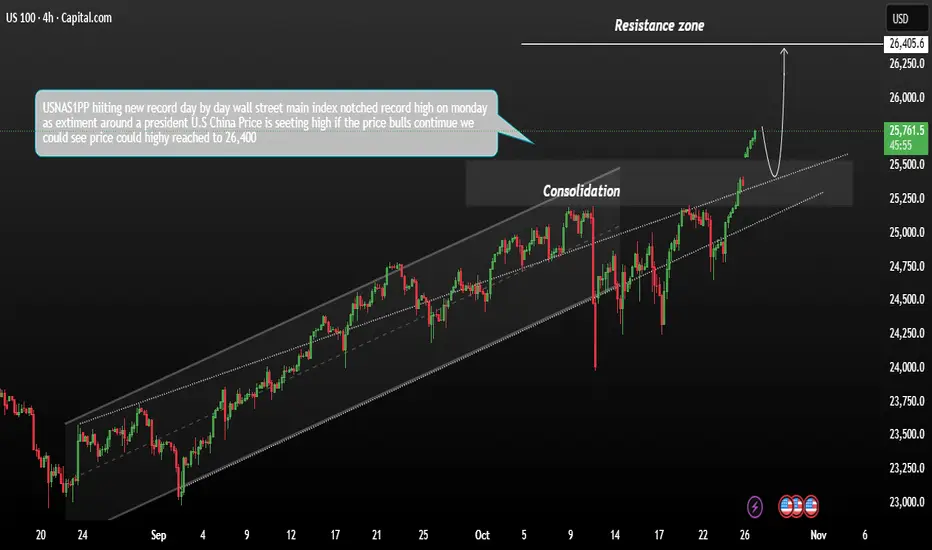
USNAS100 Consolidation Growth pattern The USNAS100 hit a new record high on Monday, driven by growing expectations of U.S. Federal Reserve interest rate cuts that continue to boost risk appetite. Optimism surrounding a potential U.S.–China trade agreement also supported sentiment at the start of a week dominated by major tech earnings.
Technically, the Wall Street index extended its bullish run, confirming strong upward momentum. However, a price test of near-term support could occur before the next leg higher. If the price holds and reacts positively at support, it could open the path toward the next resistance level at 26,400.
You my find more details in the chart.
Trade wisely best of Luck Buddies.
Ps; Support with like and comments for better analysis Thanks for Supporting.
NAS100 Bearish Setup | Momentum Weakness Detected before FOMCNAS100 is showing early signs of a potential reversal after a strong bullish rally. Price action has formed a bearish divergence on the RSI — with price making higher highs while RSI prints lower highs — signaling fading momentum among buyers.
Volume has also declined during the recent upswing, suggesting weak participation in the continuation move and potential exhaustion near the recent top. A sell setup is active with the stop loss marked in red above the previous high to protect against false breakouts, while the target zone highlighted in green aligns with the next structural support and volume-based demand area.
A decisive close below near-term support would confirm bearish intent and open the path toward the target zone. Traders should monitor momentum indicators for confirmation of sustained weakness before continuation.

US100 consolidation a bullish Phase TrendThe US100 remains within a short-term bearish trend, though recent price action suggests a potential recovery phase if support levels hold.
Technically Wall Street futures gained on Monday, marking a positive start to November. The move was supported by renewed optimism around oil demand and hopes of progress in U.S.–China trade relations, boosting overall risk appetite.
Key technical levels:
Resistance: 26,400 — A sustained move above this level could confirm bullish momentum and open the path for further gains. 25,700 If prices retrace to this zone and hold, we could see renewed buying pressure as investors position for a rebound a decisive break below 25,700 would likely signal a continuation of the downtrend, inviting further downside. In the short term, expect some volatility as the index tests these critical levels. If buying interest remains strong near support, the US100 could resume an upward correction, giving investors an opportunity to take short- to mid-term profits.
You may find more details in the chart.
Trade wisely best of Luck Buddies.
Ps; Support with like and comments for better analysis Thanks for Supporting.

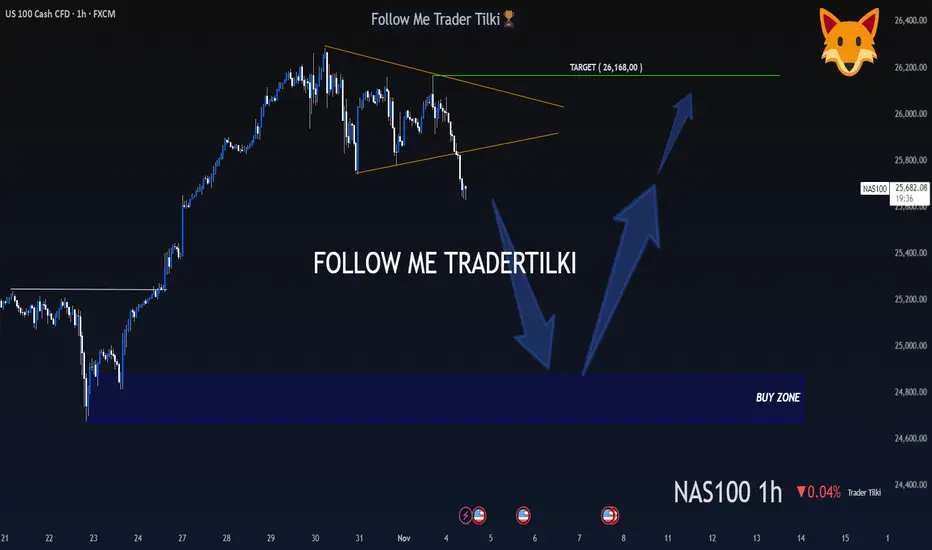
A Hunter Waits Patiently, Then Strikes Like a Lion - US100 - 1HMy dear friends, greetings,
My friends, I have set the buy levels for US100 at 24,872 and 24,677.
I will never enter a trade or put myself at unnecessary risk before these levels are reached.
My friends, in order to consistently win in this market and to become a successful trader, patience is essential.
If you act with patience and strategy, you will always be a winning trader, just like me.
I would also like you to know that my target is set at the 26,168 level.
My friends, every single like from you is my greatest motivation to share these analyses.
I sincerely thank everyone who supports me with their appreciation.
With my respect and love.
NASDAQ POTENTIAL LONG 2 NOV 2025SWING TRADE
4H structure remains BULLISH
Waiting for the swing PB to look for longs at marked potential entry areas if 15m structure shifts BULLISH in either of these zones.
15m structure is currently BEARISH and will wait for MSS before looking for longs.
I am not interested in shorting the PB but instead going with the trend.
Currently up +-2000 points on NSDQ for SEP and OCT.
Follow me TRADINGVIEW
Insta garethxsavage

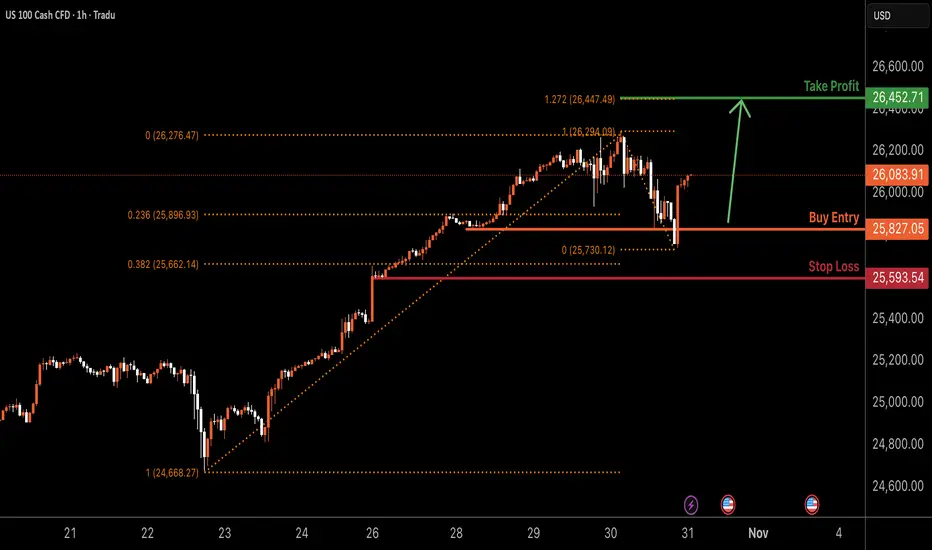
NAS100 H1 | Bullish Continuation In PlayNAS100 has bounced off the buy entry at 25,827.05, which is a pullback support that lines up with the 23.6% Fibonacci retracement and could rise from this level to the upside.
Stop loss is at 25,593.54, which is a pullback support that is slightly below the 50% Fibonacci retracement.
Take profit is at 26,452.71, which aligns with the 127.2% Fibonacci extension.
Stratos Markets Limited (tradu.com ):
CFDs are complex instruments and come with a high risk of losing money rapidly due to leverage. 68% of retail investor accounts lose money when trading CFDs with this provider. You should consider whether you understand how CFDs work and whether you can afford to take the high risk of losing your money.
Stratos Europe Ltd (tradu.com ):
CFDs are complex instruments and come with a high risk of losing money rapidly due to leverage. 70% of retail investor accounts lose money when trading CFDs with this provider. You should consider whether you understand how CFDs work and whether you can afford to take the high risk of losing your money.
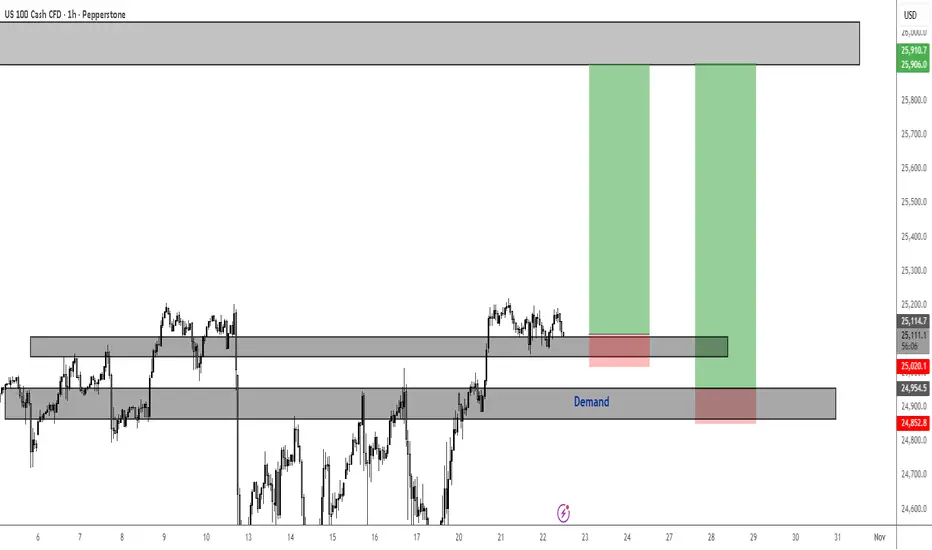
NAS100 Bullish Trend ContinuationOne of two things will happen for Nasdaq today; we will either get our entries for longs in the current support zone or in demand. The latter seems higher probability.
But either way, the uptrend will resume as price continues to claim new All Time Highs.
If the current support continues to hold throughout NYSE, then perhaps wait for resistance to break and some follow-through to get higher probability entries.
NAS100 Head and Shoulders and Gap If I am correct, and that is an M15 TF head and shoulders pattern then we might finally see a fill of that gap.

NAS100 Trade Set Up Oct 31 2025Price is forming HH/HL on the 1h so could be bullish but on the 4h its still bearish so i want to see either a sweep of EQH to then form internal 1m/5m bearish structure to target SSL or a sweep of SSL first to then target EQH

How to Trade NASDAQ NAS100 Retracements Into An Imbalance🚀 NASDAQ NAS100 Analysis – Watching for a Bullish Opportunity 📈
I'm currently focused on the Nasdaq NAS100. On the weekly timeframe, it remains in a strong bullish trend 💹. Recently, however, we've seen a sharp and aggressive retracement. Given that the market was overextended, this pullback is healthy and expected, as price seeks to tap liquidity pools and rebalance ⚖️.
Zooming into the 4-hour timeframe, we can clearly identify a bullish imbalance 🔹. This area serves as my key point of interest for a potential move lower. The ideal scenario is for price to hold above the imbalance low and then break structure bullishly 🔼.
Key conditions for a high-probability long trade:
Price must not break below the imbalance low 🚫⬇️
Price must establish higher highs and higher lows to confirm bullish momentum 🔝
If these conditions align, I will be looking for a long entry opportunity. ⚠️ Not financial advice – this is purely market analysis for educational purposes.

NASDAQ BullishOne of the remarkable characteristics of the NASDAQ is its ability to sustain rallies even at all-time highs. This resilience is largely driven by the “Big 7” tech companies, which collectively account for roughly 40% of the index’s weight. Their constant innovation continues to fuel long-term bullish momentum across the sector.
Heading into next week, I anticipate the potential formation of new all-time highs, particularly if price breaks and trades above 25,859.8 — Thursday’s daily rejection candle and the vicinity of the -27% Fibonacci extension level.
#NASDAQ #US100 #Indices #TechnicalAnalysis #TradingView

Nasdaq Holds Below the 26,300-ResistanceHaving broken above the 26,000 mark, the Nasdaq has also moved beyond the upper boundary of a channel respected since July 2025, now trading within the duplicated (parallel) channel structure.
The mid-zone of this duplicated channel represents initial resistance near 26,300, and a confirmed breakout above this level could extend gains toward the upper boundary near 26,800.
On the downside, a move back below 25,700 could trigger a sharper pullback toward 25,400, with additional support near 25,200. The daily RSI continues to diverge negatively from price action, signaling caution near current record highs.
Written by Razan Hilal, CMT

NDX - POTENTIAL PULLBACK IN PLAY - SHORT SHORT INTO LONGGood Morning,
Always trade with risk assessment in mind. You can lose money quickly without an exit strategy. I choose a 7% stop based on my risk.
We are looking for a .5% exhaustion gap into todays market to show initiation of the pullback.
Trade Safely
Enjoy!

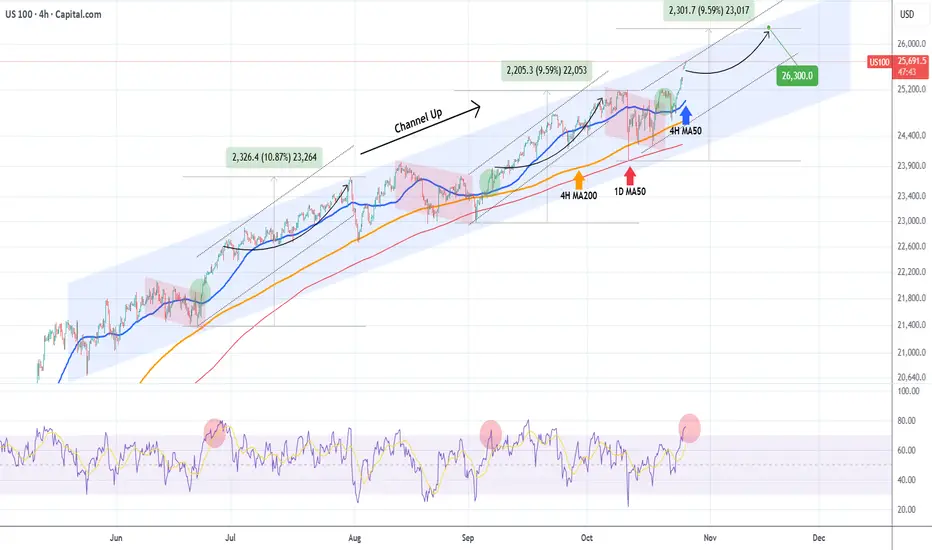
NASDAQ Needs some sideways relief but remains bullish.Nasdaq (NDX) continues to extend the new Bullish Leg of its 5-month Channel Up, having turned the 4H MA50 (blue trend-line) as its short-term Support, in line with both previous Bullish Legs.
We still expect at least a +9.59% rise, targeting 26300, to be completed before the pattern's new Higher High is priced but as the 4H RSI turned overbought (red circle), we expect the price to slow down a little, maybe seeking the 4H MA50 again as it happened in July.
In any event, the long-term trend remains bullish, until the 1D MA50 (red trend-line) breaks.
-------------------------------------------------------------------------------
** Please LIKE 👍, FOLLOW ✅, SHARE 🙌 and COMMENT ✍ if you enjoy this idea! Also share your ideas and charts in the comments section below! This is best way to keep it relevant, support us, keep the content here free and allow the idea to reach as many people as possible. **
-------------------------------------------------------------------------------
💸💸💸💸💸💸
👇 👇 👇 👇 👇 👇
NASDAQ100 | Wave 4 Correction Within ChannelPrice has respected a clean ascending channel, completing a clear 1–2–3 wave sequence. We’re now seeing a corrective pullback that aligns with the wave 4 region — testing the midline support of the channel. As long as this structure holds, the broader wave (3) remains intact.
Scenarios:
Scenario A: If the lower channel and wave 4 region hold → potential continuation higher toward wave 5 and the upper boundary near 26,600–26,800.
Scenario B: If the channel support breaks → deeper correction likely toward 25,800 before any potential resumption of trend.
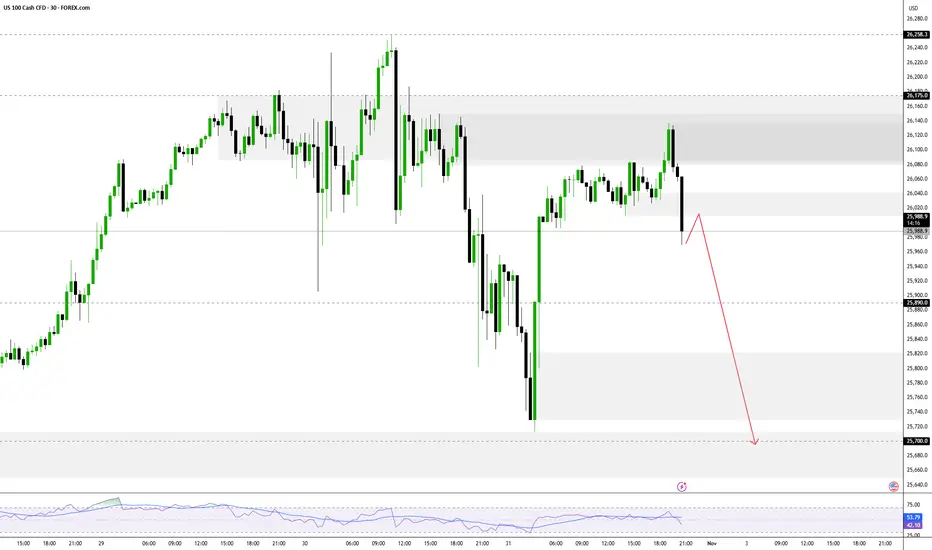
Reversal From ATH, Momentum Turns Cautious Reversal From ATH, Momentum Turns Cautious
The NASDAQ reversed from its all-time high and remains below 26,175, signaling short-term bearish momentum.
➡️ Below 26,175: Bearish bias toward 25,890 → 25,700 → 25,340.
➡️ Above 26,245: Bullish continuation toward 26,500 → 26,850.
Pivot POINT: 26,175
Support: 25,890 · 25,700 · 25,340
Resistance: 26,500 · 26,850 · 27,000
USNAS100 remains bearish while below 26,175, but a 1H close above 26,245 would confirm a bullish breakout toward higher targets.