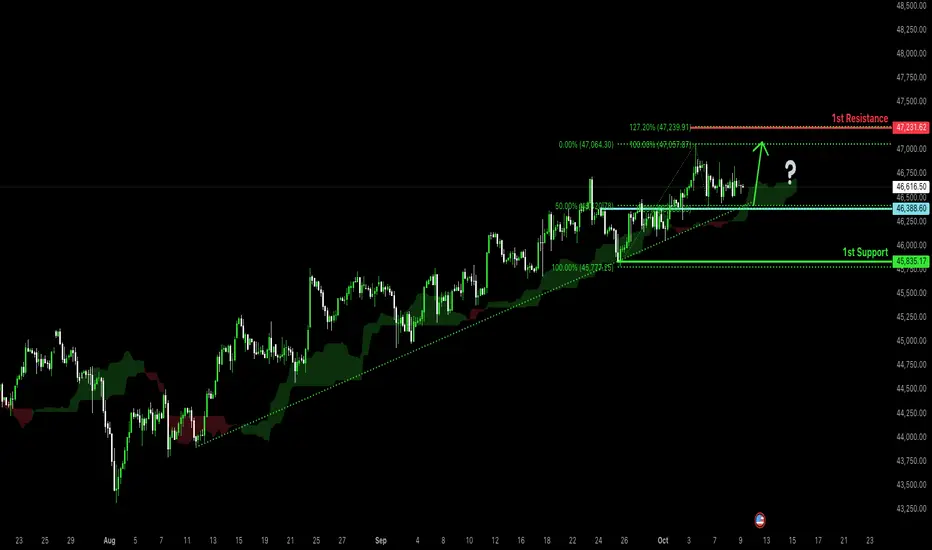
Bullish continuation?Dow Jones (US30) is falling towards the pivot, which acts as a pullback support that aligns with the 50% Fibonacci retracement and could bounce to the 1st resistance.
Pivot: 46,388.60
1st Support: 45,835.17
1st Resistance: 47,231.62
Disclaimer:
The above opinions given constitute general market commentary, and do not constitute the opinion or advice of IC Markets or any form of personal or investment advice.
Any opinions, news, research, analyses, prices, other information, or links to third-party sites contained on this website are provided on an "as-is" basis, are intended only to be informative, is not an advice nor a recommendation, nor research, or a record of our trading prices, or an offer of, or solicitation for a transaction in any financial instrument and thus should not be treated as such. The information provided does not involve any specific investment objectives, financial situation and needs of any specific person who may receive it. Please be aware, that past performance is not a reliable indicator of future performance and/or results. Past Performance or Forward-looking scenarios based upon the reasonable beliefs of the third-party provider are not a guarantee of future performance. Actual results may differ materially from those anticipated in forward-looking or past performance statements. IC Markets makes no representation or warranty and assumes no liability as to the accuracy or completeness of the information provided, nor any loss arising from any investment based on a recommendation, forecast or any information supplied by any third-party.
Trade ideas
Decrease in the first two days of the week and then a new highFor the next two days, the Dow Jones index will follow the trend shown. First, there will be a downward movement, and after the cycle closes, the movement will increase and grow towards a new price record at the ceiling.

Us30 Trade Set Up Oct 22 2025Price swept a daily BSL and closed under it and has left a lot of SSL plus a daily gap below so i will want to see a sweep of internal BSL followed by a CISD on the 1m-5m to target PDL and 50% of the daily gap

Dow bullish breakout supported at 46600Key Support and Resistance Levels
Resistance Level 1: 47156
Resistance Level 2: 47285
Resistance Level 3: 47413
Support Level 1: 46600
Support Level 2: 46460
Support Level 3: 46270
This communication is for informational purposes only and should not be viewed as any form of recommendation as to a particular course of action or as investment advice. It is not intended as an offer or solicitation for the purchase or sale of any financial instrument or as an official confirmation of any transaction. Opinions, estimates and assumptions expressed herein are made as of the date of this communication and are subject to change without notice. This communication has been prepared based upon information, including market prices, data and other information, believed to be reliable; however, Trade Nation does not warrant its completeness or accuracy. All market prices and market data contained in or attached to this communication are indicative and subject to change without notice.

US30 longI see great buying power coming.
sentiments are looking risk on and positive for US stocks as Us and china look to be interested in making a trade deal.
technicals show that at the current price levels buyers have come in to purchase driving price up
US30: Breakout or Pullback? Key zones in play
SPREADEX:DJI Technical Analysis – Price Action Scenarios Based on Supply & Demand Zones
Timeframe: 30-Minute
Chart: Wall Street Index (US30)
Source: TradingView
________________________________________
🔍 Overview
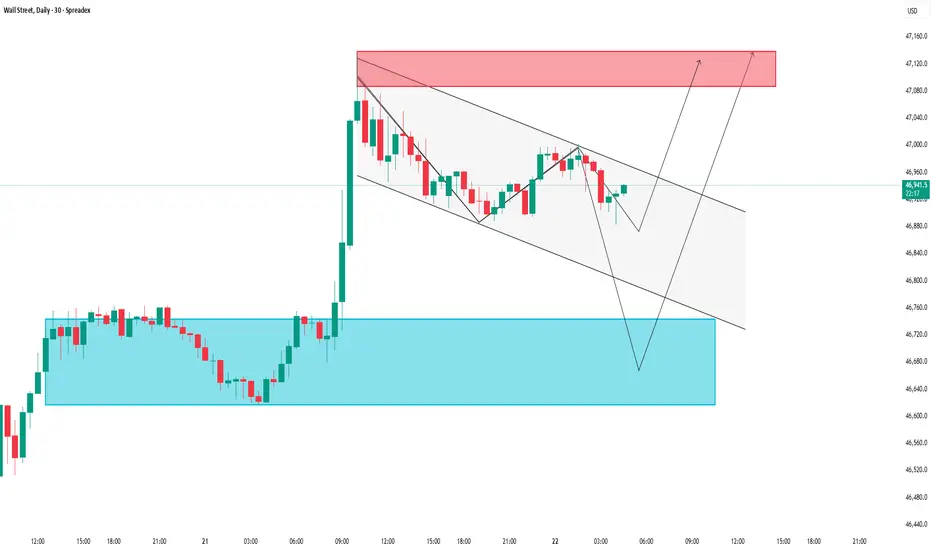
In this Wall Street index analysis, the US30 is currently consolidating within a descending price channel after a sharp bullish breakout from a key demand zone. The chart outlines potential price action scenarios based on key support and resistance levels derived from supply and demand dynamics.
________________________________________
Key Supply & Demand Zones
🔵 Demand Zone (Support Area): 46,660 – 46,720 USD
This is the deep support zone where price previously reversed sharply. It represents a high-probability buying area if retested.
🟢 Short-Term Support / Accumulation Zone: 46,880 – 46,950 USD
Price has shown multiple reactions here, indicating accumulation and temporary demand. A break below this area could lead to a move toward the lower demand zone.
🔴 Supply Zone (Resistance Area): 47,100 – 47,160 USD
This is a potential reversal zone where sellers may become active again. A breakout above this area could signal continuation of the bullish trend.
________________________________________
🧭 Technical Structure & Price Action Scenarios
The chart shows two main forecast scenarios for US30:
📉 Scenario 1: Bearish Pullback to the Lower Demand Zone
• Price gets rejected at the upper boundary of the descending channel.
• If bearish momentum continues, expect a decline toward the 46,660 – 46,720 USD zone.
• Look for bullish reversal signals such as a hammer or bullish engulfing candle before considering long positions.
📈 Scenario 2: Bullish Breakout Toward the Supply Zone
• If price sustains above 46,950 USD and breaks the descending trendline, a bullish move may be confirmed.
• Target zone: 47,100 – 47,160 USD.
• A successful breakout here could open up a continuation toward higher levels.
________________________________________
📌 Supporting Indicators
• Parabolic SAR: Dots are showing a potential shift during the retracement. Watch for dots flipping below price to support bullish continuation.
• Breakout Confirmation: The previous breakout above the 46,880 range adds weight to the current bullish outlook.
________________________________________
✅ Trading Setup Summary
Scenario Key Zone Action
📉 Pullback 46,660 – 46,720 Watch for long entry (support test)
📈 Breakout 46,950 Long toward 47,100 – 47,160
• Support Holding Above: 46,880 – 46,950 USD
• Resistance Zone to Watch: 47,100 – 47,160 USD
________________________________________
⚠️ Final Thoughts
The current structure indicates a pullback within a broader bullish context. Watch how price reacts at support zones and the descending channel. Traders should wait for clear confirmation before entering positions and maintain strict risk management.
📈 This setup is suitable for day traders and short-term swing traders looking to trade the US30 index based on clean price action and supply & demand logic.
Please like and comment below to support our traders. Your reactions will motivate us to do more analysis in the future 🙏✨
Harry Andrew @ ZuperView
Dow Jones Industrial Index (US30) Technical AnalysisThe Dow Jones is moving within a bullish corrective structure on the 2H timeframe, after sweeping downside liquidity and rebounding from a demand zone.
The price is expected to continue rising toward the 47,050 – 47,980 zone, representing the 161% – 200% Fibonacci extensions, which may act as key resistance areas for potential profit-taking.
If the price fails to break above 47,980, a short-term correction toward 46,130 could occur before any renewed bullish momentum.
📊 Fundamental Outlook:
The U.S. indices remain supported by strong corporate earnings and reduced expectations of further Fed rate hikes.
However, rising bond yields and upcoming inflation data could limit the upside momentum in the short term.
📅 Short-term Bias: Mildly Bullish with correction risk
🎯 Upside Targets: 47,050 – 47,980
📉 Pullback Target: 46,130
⛔ Invalidation Level: Below 45,900
#US30 #DowJones #TechnicalAnalysis #FundamentalAnalysis #EmaraCapital #Rami_Hajj_Bakour #Trading #Markets

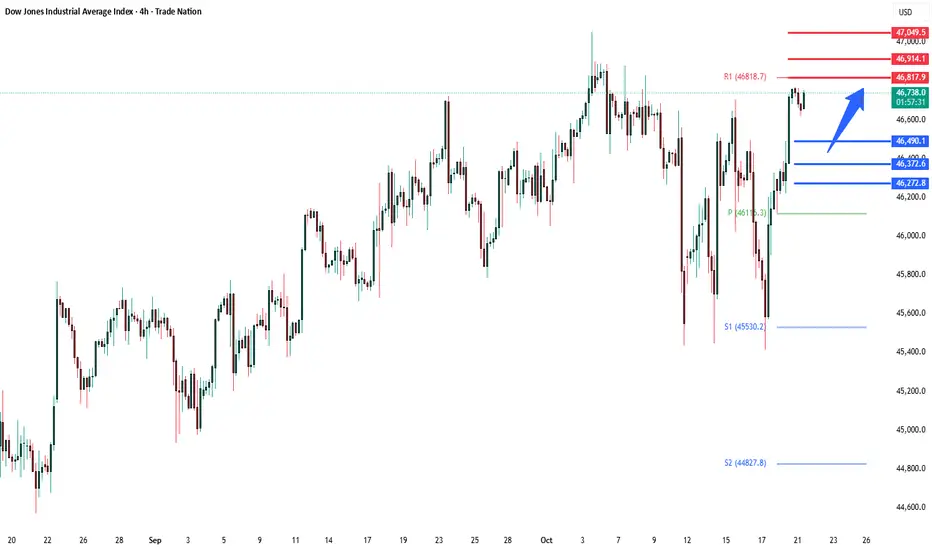
DowJones Key Trading LevelsKey Support and Resistance Levels
Resistance Level 1: 46817
Resistance Level 2: 46915
Resistance Level 3: 47050
Support Level 1: 46490
Support Level 2: 46370
Support Level 3: 46270
This communication is for informational purposes only and should not be viewed as any form of recommendation as to a particular course of action or as investment advice. It is not intended as an offer or solicitation for the purchase or sale of any financial instrument or as an official confirmation of any transaction. Opinions, estimates and assumptions expressed herein are made as of the date of this communication and are subject to change without notice. This communication has been prepared based upon information, including market prices, data and other information, believed to be reliable; however, Trade Nation does not warrant its completeness or accuracy. All market prices and market data contained in or attached to this communication are indicative and subject to change without notice.
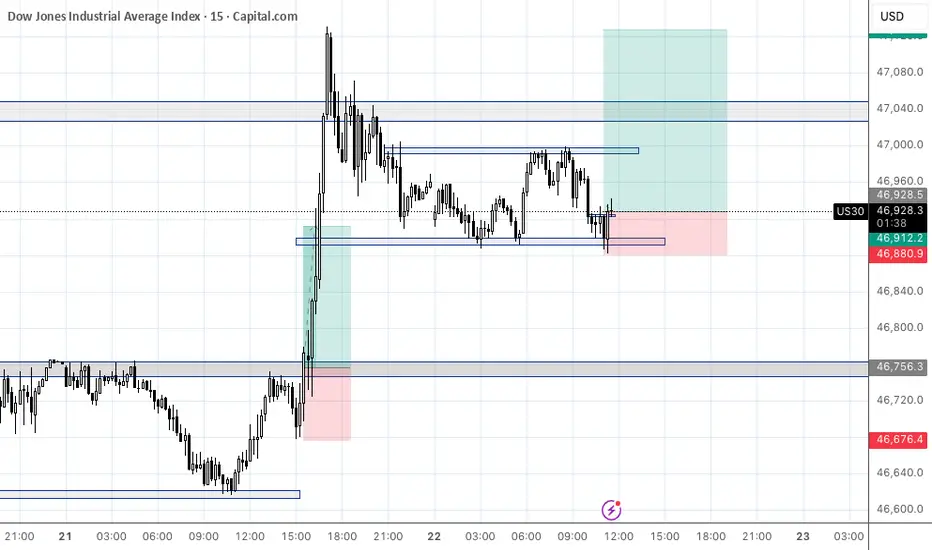
US30 Long Idea: Bullish Retest of Key Flipped LevelHello TradingView Community,
This post outlines a potential long trade setup on the Dow Jones Industrial Average Index (US30) on the 15-minute timeframe.
Technical Analysis:
The chart shows the price has been trading within a range, with a key horizontal level at approximately 46,732.10 acting as a significant resistance. We have recently seen a strong bullish breakout above this level, indicating that buyers may be taking control.
The trading idea is based on a classic "resistance-turned-support" pattern. After breaking out, the price is now pulling back to retest this former resistance from above. The expectation is that this level will hold as new support, providing a solid base for a continuation of the upward move.
Trade Setup:
The long position tool on the chart visualizes a potential trade plan for this bullish scenario:
Entry: Approximately 46,732.10 (at the retest of the new support).
Stop Loss: 46,490.84 (placed below the key support structure to invalidate the idea if the level fails to hold).
Take Profit: 47,430.58 (targeting a new higher high).
This setup provides a structured plan with a favorable risk-to-reward ratio for a potential continuation of the bullish momentum.
Disclaimer: This analysis is for educational and discussion purposes only and should not be considered as financial advice. Trading indices involves a high level of risk. Please conduct your own research and manage your risk appropriately.

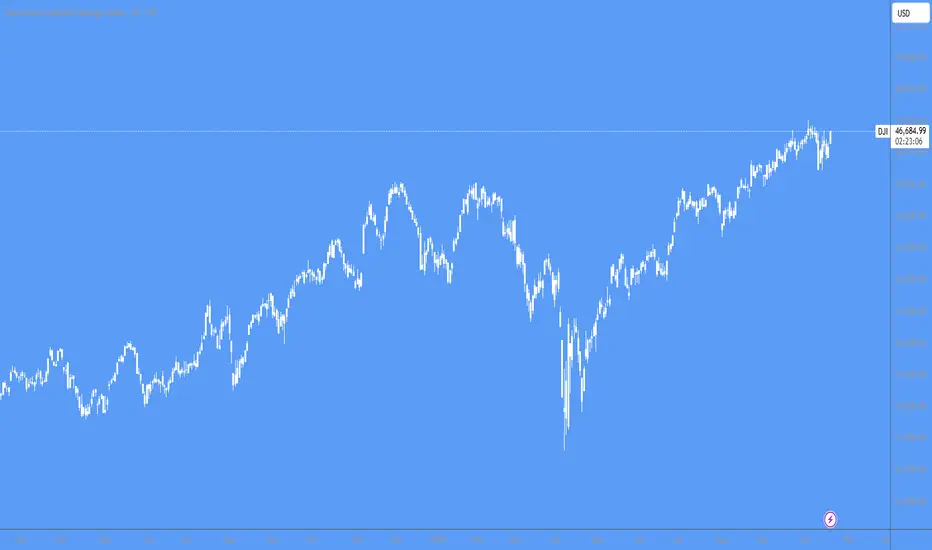
Fractal Regression Analysis 2024-2025+ ...Imitation crab is one of my favorite breakfast meals. Somebody bought me a bowl of poke and left it in my building mailroom for me with no note for cutie.
Today is a bullish enfracting candle, which I pen and coin as what you see as the latter of the 2-3 days prior.
If you understand my prior fractal analysis and have not been removed from TradingView staff in the past two weeks, you are funny to me.
Most people don't understand me. Don't expect to see anything but dollar signs in your eyes.
With love,
Mostrararte
#DJI - 2000 Points Range PlayDate: 20-10-2025
#DJI - Current Price: $46,400.00
Pivot Point: $46,002.00 Support: $45,458.57 Resistance: $46,548.59
Upside Levels:
L1: $46,905.29 L2: $47,262.00 L3: $47,734.50 L4: $48,207.00
Downside Levels:
L1: $45,100.28 L2: $44,742.00 L3: $44,269.50 L4: $43,797.00
#TradingView #Nifty #BankNifty #DJI #NDQ #SENSEX #DAX #USOIL #GOLD #SILVER

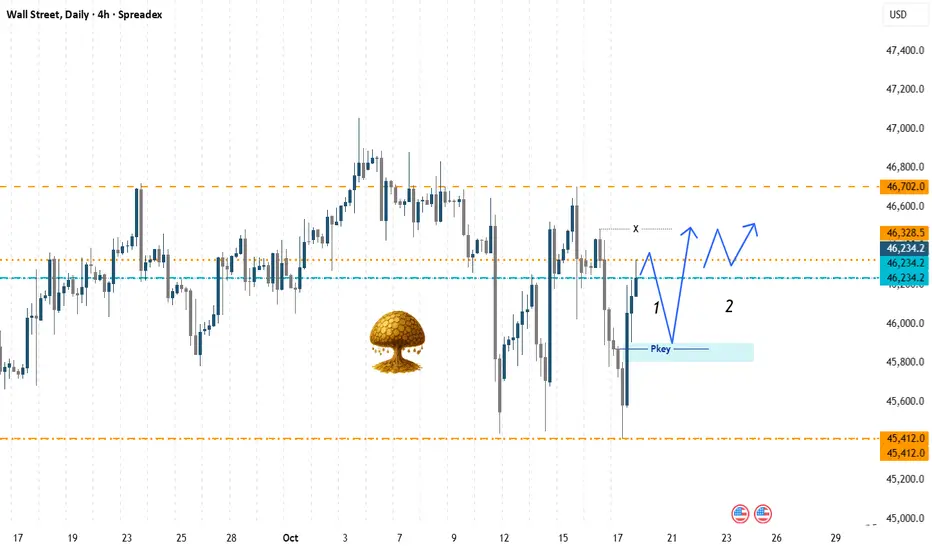
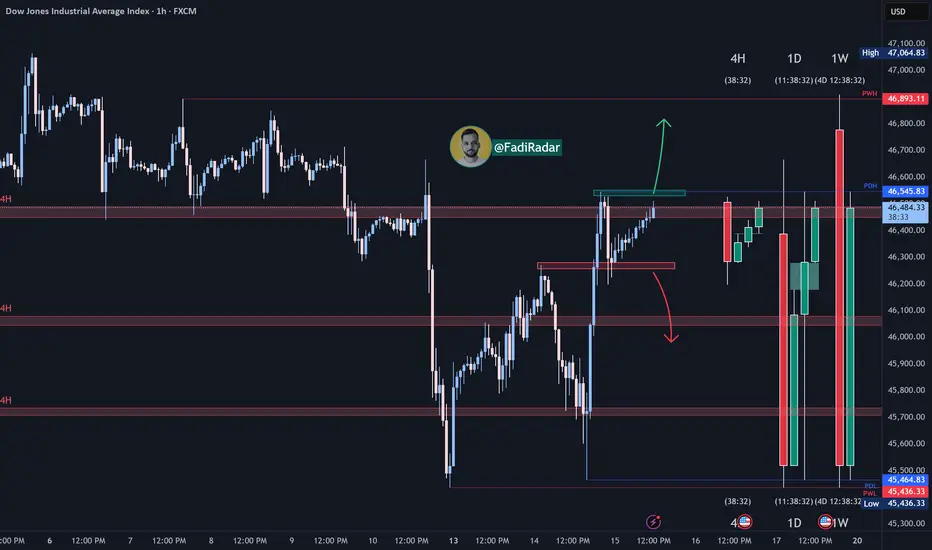
From Sweep to Surge | Dow Jones Liquidity Map Explained Dow Jones (DJI) Analysis | Monday, Oct 20st
Welcome traders! 👋
I’m glad to have you here — we’re all learning and growing together in this amazing trading journey.
Let’s dive into today’s analysis on Dow Jones (DJI) 👇
🧠 Weekly Outlook (October 20st – Monday)
On the weekly timeframe, Dow Jones remains in a bullish trend.
However, on the daily timeframe, price is still in a bearish correction phase within that broader uptrend.
As mentioned in last week’s analysis, price already swept liquidity below the double-bottom lows and turned bullish afterward.
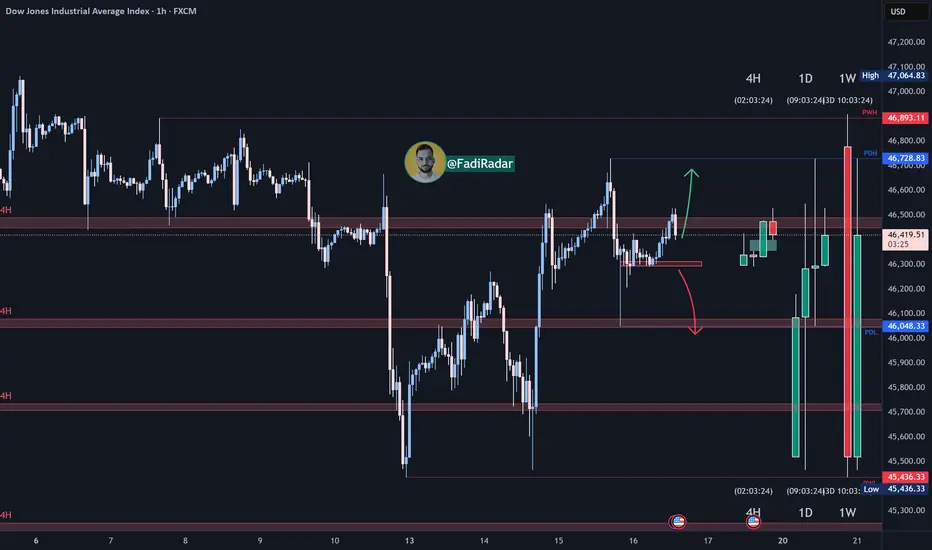
On the 4-hour timeframe, the sell-side liquidity has been taken, and price is now moving toward buy-side liquidity — showing signs of continuation to the upside.
🎯 Monday Scenarios
Here are the two possible setups I’m watching for the start of the trading week:
Scenario 1:
Price reacts to the 4H imbalance / POI. zone, giving bullish confirmation and moving upward toward the buy-side liquidity targets.
Scenario 2:
Price moves directly upward without touching the imbalance, forming higher highs and higher lows, and continues toward the upper liquidity zone.
⚠️ Keep in mind:
The market is never 100% certain.
Always wait for confirmation, manage risk carefully, and stay aware of upcoming economic news before entering any trade.
📅 This analysis is valid for Monday only.
Share your thoughts below 💬
Do you see the same scenario playing out, or are you watching a different setup?
📘 Educational Note:
This analysis is for educational and illustrative purposes only.
Always follow your own plan, confirm with your strategy, and manage risk carefully.
Success in trading comes from discipline, patience, and consistency. 💪
🚀 Empowering traders through clarity, confidence & clean charts.
Follow 👉 parisa_tl for more liquidity setups and weekly insights 💙
#DowJones #DJI #us30 #smartmoneyconcepts #forexanalysis #priceaction #tradingpsychology #liquiditytrading #marketstructure #smcstrategy #forexsetup #smartmoney #technicalanalysis #supplyanddemand #indextrading #smccommunity #forexmentor #priceactiontrader #us30analysis #fxtrader #daytrader #forexeducation #riskmanagement #forexcharts #marketoutlook #tradingview
Dow oversold bounce back supported at 45379Key Support and Resistance Levels
Resistance Level 1: 46297
Resistance Level 2: 46485
Resistance Level 3: 46695
Support Level 1: 45379
Support Level 2: 45205
Support Level 3: 45030
This communication is for informational purposes only and should not be viewed as any form of recommendation as to a particular course of action or as investment advice. It is not intended as an offer or solicitation for the purchase or sale of any financial instrument or as an official confirmation of any transaction. Opinions, estimates and assumptions expressed herein are made as of the date of this communication and are subject to change without notice. This communication has been prepared based upon information, including market prices, data and other information, believed to be reliable; however, Trade Nation does not warrant its completeness or accuracy. All market prices and market data contained in or attached to this communication are indicative and subject to change without notice.

Dow Jones (US30) Analysis:The Dow Jones index is moving in a short-term uptrend and is currently heading to test the 46,300 support zone, which is considered a good buying area if a bullish rebound occurs.
🔻 Bearish Scenario:
If the price breaks below 46,300 and holds, traders can look for short-term selling opportunities.
📈 Best Buy Zone: 46,300
📉 Best Sell Zone: below 46,300 after a confirmed break
Midnight SeekerI doubt there will be a downward manipulative move before an initial one, what do you see?


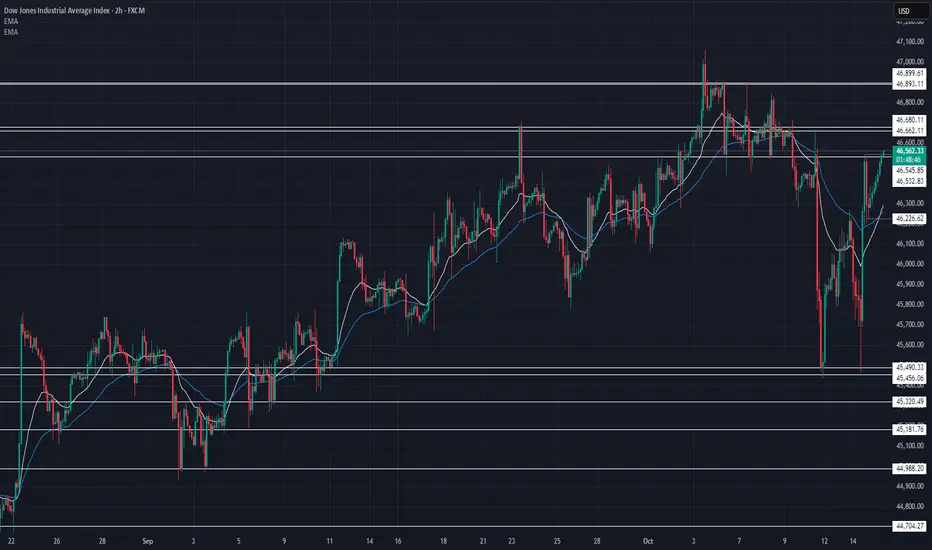
US30 Technical Breakdown – 10/15/2025📍 US30 Technical Breakdown – 10/15/2025
US30 bouncing strong from 45,600 support 🔥 — bulls pushing price back into a key resistance zone near 46,550–46,680. Momentum picking up but still under a heavy ceiling 💪📈
📊 Market Behavior:
🔹 Sharp recovery after double bottom around 45,600
🔹 EMAs turning bullish again after crossover
🔹 Price testing resistance — potential breakout or rejection zone
📌 Key Levels:
🔹 Resistance Zones:
46,545 → intraday resistance
46,662 → strong ceiling
46,680–46,900 → breakout area 🚀
🔹 Support Zones:
46,226 → short-term support
45,837 → mid-level demand
45,490 → deep pullback zone
🧠 Bias:
Bullish–Neutral 🟢
➡️ Above 46,680 → potential breakout toward 46,900
⬅️ Below 46,220 → possible retrace to 45,800
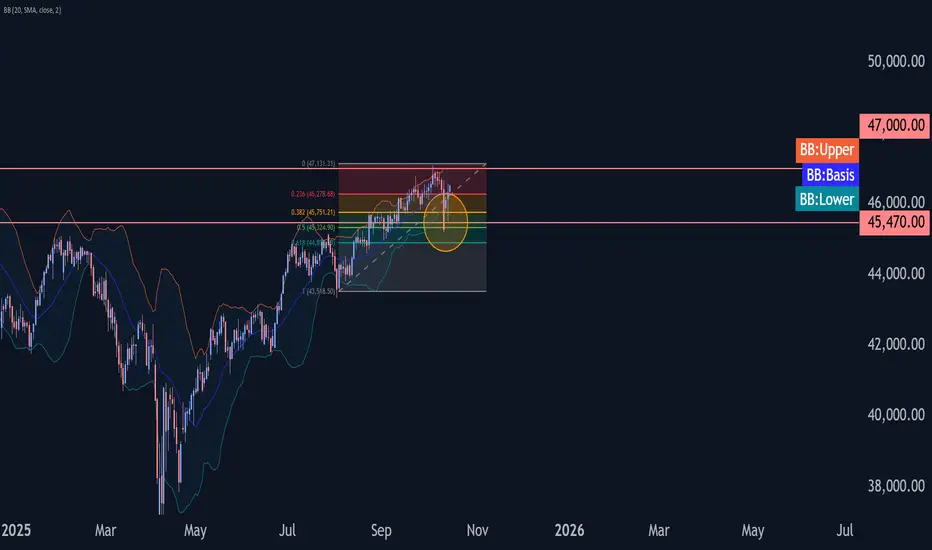
Dow Jones Wave Analysis – 15 October 2025
- Dow Jones reversed from support zone
- Likely to rise to resistance level 47000.00
Dow Jones index recently reversed up from the support zone between the key support level 45470.00 (former resistance from August), lower daily Bollinger Band and the 38.2% Fibonacci correction of the upward impulse from August.
The upward reversal from this support zone created the daily reversal pattern Hammer, which stopped earlier correction ii.
Given the strong daily uptrend, Dow Jones index can be expected to rise further to the next resistance level 47000.00 (which stopped earlier impulse wave i).
Dow Jones (US30) Analysis:The Dow Jones Index is heading toward a key resistance level at 46,550.
🔻 If the price rejects this level, it is likely to retrace back to test support at 46,250, and a break below this support could resume the bearish trend.
🔺 However, if the index breaks and holds above 46,550, this could push the price higher toward 46,700 as the first target.
📈 Best Buy Zone: After confirming a breakout above 46,550
📉 Best Sell Zone: On rejection from 46,550 or a confirmed break below 46,250
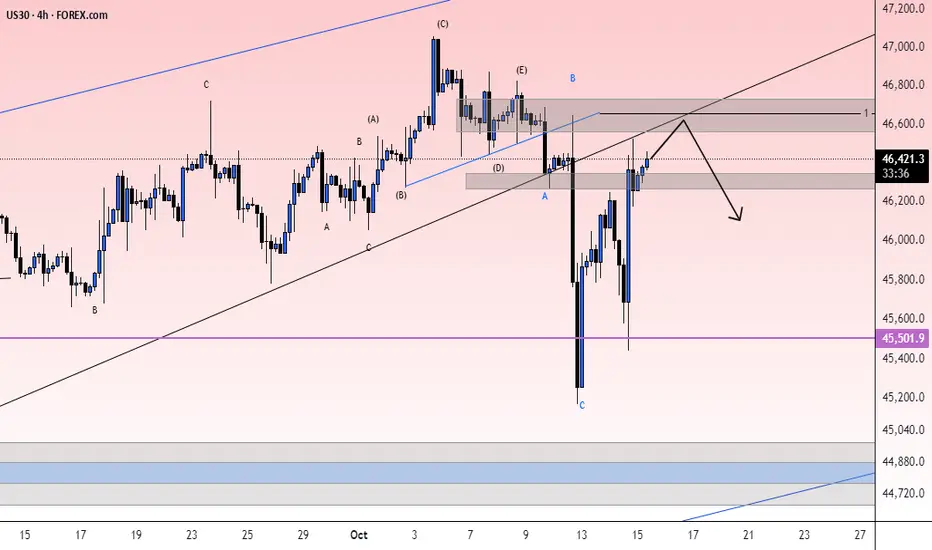
check the trendIt is expected that a trend change will form in the current resistance range and we will witness the beginning of a downward trend.
As long as the index does not stabilize above the resistance range, the continuation of the downward trend and correction will be likely.
US30 (Dow Jones) Trade UpdateTimeframe: 4-hour
Current Price: 46,385.40
Key Levels:
Resistance: 46,493 (watch for a breakout and retest for potential buy setups)
Support: 45,705.02 (watch for a breakdown and retest for potential sell setups)
Strategy:
If 46,493 is broken and price retests, I will look to add buy positions for a potential move higher, targeting resistance around 47,000.
If price fails to break above this level and breaks support at 45,705.02, I will look for sell setups on the retest, targeting lower support levels around 45,210.

MARKET RECAP-FED CHAIR POWELL SPEAKS_DOW JONES_RF+NEWS10-14-25-News-Daily Recap-Market opened up on Sunday 12, 2025. Market gapped. initally expecting gap to fill later in the week. But the market filled gap Tuesday 10/14/25/ Traded to the buyside, into higher timeframe (Daily) small FVG. Expecting some sell off, then retracement higher. News Thursday Core PPI.

Breaks Above 46,400.00 as Bulls Extend RecoveryUS30 has pushed decisively above 46,400.00, confirming strong buyer momentum after last week’s deep correction. This breakout shifts short-term sentiment firmly bullish, with price now eyeing the next resistance at 46,809.40.
Support at: 46,400.00 🔽 46,150.00 🔽
Resistance at: 46,809.40 🔼 47,000.00 🔼
🔎 Bias:
🔼 Bullish: Momentum remains with buyers while price holds above 46,400.00. A sustained move could target 46,809.40, and a break above that opens the path to 47,000.00.
🔽 Bearish: Only a drop back below 46,400.00 would weaken the current momentum and expose 46,150.00 as the next test for buyers.
📛 Disclaimer: This is not financial advice. Trade at your own risk.
