FRGNT FUN COUPON FRIDAY -Q4 | W45 | D7| Y25 | DXY📅 Q4 | W45 | D7| Y25 |
📊 DXY FRGNT Daily Forecast
FRGNT FUN COUPON FRIDAY
🔍 Analysis Approach:
I’m applying Smart Money Concepts, focusing on:
Identifying Points of Interest on the Higher Time Frames (HTFs) 🕰️
Using those POIs to define a clear trading range 📐
Refining those zones on Lower Time Frames (LTFs) 🔎
Waiting for a Break of Structure (BoS) for confirmation ✅
This method allows me to stay precise, disciplined, and aligned with the market narrative, rather than chasing price.
💡 My Motto:
"Capital management, discipline, and consistency in your trading edge."
A positive risk-to-reward ratio, paired with a high win rate, is the backbone of any solid trading plan 📈🔐
⚠️ Losses?
They’re part of the mathematical game of trading 🎲
They don’t define you — they’re necessary, they happen, and we move forward 📊➡️
🙏 I appreciate you taking the time to review my Daily Forecast.
Stay sharp, stay consistent, and protect your capital
— FRNGT 🚀
TVC:DXY
Trade ideas

DXY — London Session🧭 Market Context
Dollar capped down overnight from 99.762 to 99.704 but still trades above the key bullish structure point at 99.525. The structure remains bullish overall, yet price keeps failing to break through 99.875 — the current cap. London session has filled yesterday’s balance range, leaving us in neutral territory.
We’re sitting on zero deviation — meaning equal chance to push higher or rotate lower.
Before taking any position, we need confirmation.
📈 Technical Frame DSM + VFA
Structure stays constructive but momentum is fading.
Volume shows thinning participation near 99.875 — professionals aren’t chasing.
If we see clear volume conviction through that level, we likely drive higher and fill the capped zone. If price slips below 99.525, expect a liquidity sweep into the lower volume pocket near 99.40. Right now, this is observation mode — not engagement mode.
🌍 Fundamental Frame (Macro Logic)
Overnight softness came from mild risk-on sentiment — Asia equities up, yields down.
Still, the Fed’s tone stays restrictive, and dollar demand remains under the surface.
This move looks more like positioning ahead of NFP than any real shift in trend.
🏛️ Coach’s Lens
When the market sits in balance, patience becomes the edge.
Professionals wait for clarity; amateurs act on hope.
Bias follows structure — not emotion.
🎯 Operator Rule
Confirmation defines conviction.
— CORE5DAN
Institutional Logic. Modern Technology. Real Freedom.

Dollar Index Daily Trade SetupsIn this update, we review the recent price action in the Dollar Index and identify the next high-probability trading opportunities and price objectives to target. To review today's analysis, click here!

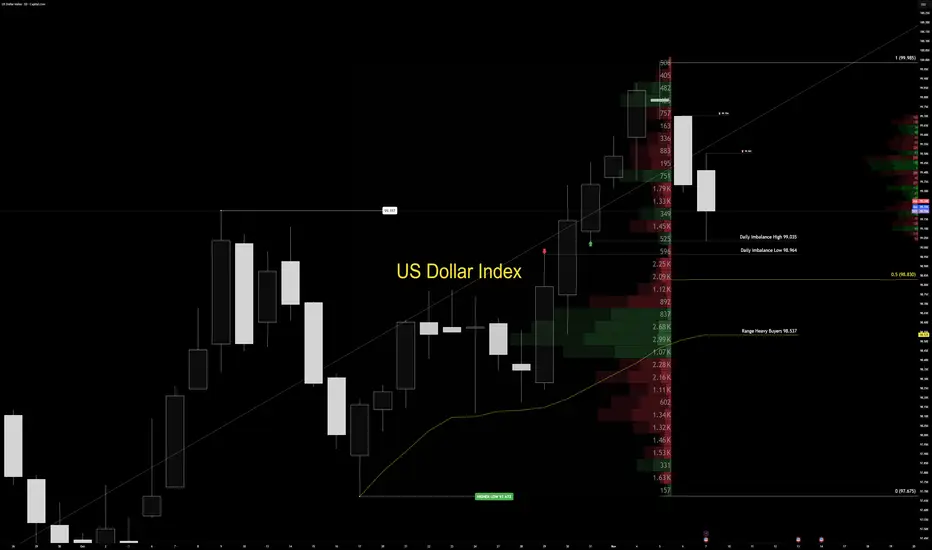
Sunday Dollar War Map | Week Ahead — DXY Structure OutlookThe US Dollar Index (DXY) continues to trade within a controlled bullish range, holding the upper half of its daily structure between 97.675 (range low) and 99.985 (range high). Price remains anchored inside premium territory, with a daily imbalance cap defined between 99.035 (high) and 98.964 (low).
Volume delta stays concentrated deep in the discount zone near 98.537, showing that institutional participation remains limited. Early in the week, price may probe deeper into that imbalance cap to trigger larger positioning before any directional expansion. Until confirmed volume steps in, the tactical stance remains clear: observe, don’t predict. Professionals wait for conviction — amateurs try to guess it.
The active order flow imbalance remains unfilled, and price typically reacts once single prints inside that imbalance get touched. However, the heavy volume concentration across the lower half of the range deserves attention — trading directly into the cap often causes reactive blowback. That’s not random; it’s how market maker logic plays out through volume flow behavior.
On the macro side, US yields continue to climb as investors demand higher compensation for duration risk. The 10-year Treasury yield hovers near 4.1%, while the 30-year sits close to 4.7%. Meanwhile, fiscal pressure continues to build — record government debt and renewed shutdown risks are keeping confidence fragile.
The outcome is a balancing act: rising yields support the dollar in the short term, while long-term credibility remains under pressure. For now, the dollar holds its ground — but each move is conditional.
Professionals trade participation, not prediction. The market doesn’t reward speed — it rewards confirmation. Let the tape show its hand before you show yours. Structure speaks first. Volume decides who listens.
— Institutional Logic. Modern Technology. Real Freedom.
DOLLAR INDEX (DXY): Too Overbought Now
Looks like Dollar Index finally starts correction.
A test of a significant hisotric daily resistance triggered
a bearish movement and an intraday change of character
on a 4H time frame.
I think that the market may drop lower.
Goal - 99.8
❤️Please, support my work with like, thank you!❤️

DXY — London SessionThe US Dollar traded through 99.357, confirming a wide range between 97.6 and 99.9.
This is already a large playing field, and today’s movement needs extra care.
It’s Friday, and with weekend flows plus U.S. politics in the mix, price can move irregularly.
Signals need double confirmation before bias.
We have our range, and the focus now is to respect it — not rush it.
The professional move: wait for structure to prove intent.
Discipline always beats impulse.
Fundamentals
Dollar strength remains supported by cautious sentiment.
Yields are steady, and investors are holding defensive exposure rather than chasing risk.
It’s less about fresh demand — more about managing positioning ahead of next week’s data.
— CORE5DAN
Institutional Logic. Modern Technology. Real Freedom.

Dxy will fall in coming months Crypto will Rise.Dxy Target of 92 is going to happen in coming months blow off top will happen before bear market starts.

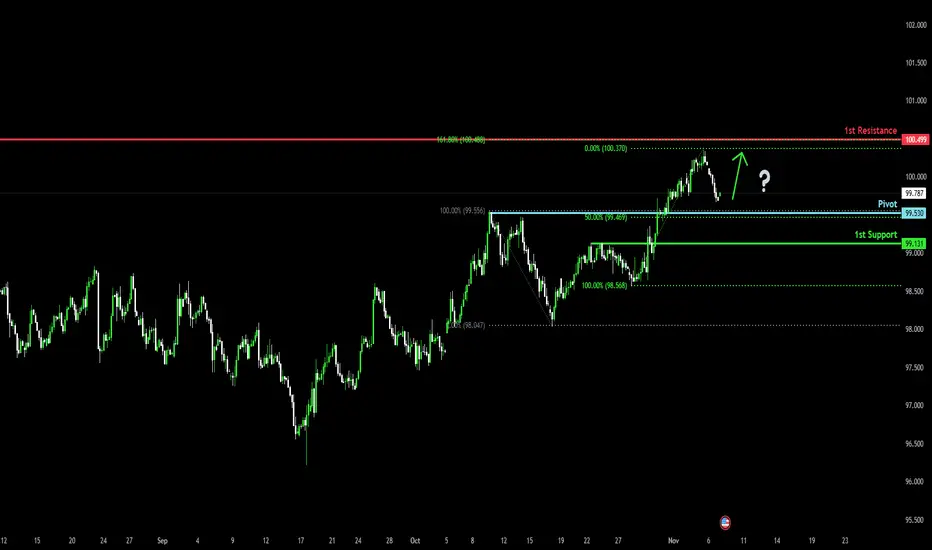
Bullish bounce off 50% Fibonacci support?The US Dollar Index (DXY) is falling towards the pivot, which has been identified as a pullback support that aligns with the 50% Fibonacci retracement and could bounce to the 1st resistance.
Pivot: 99.53
1st Support: 99.13
1st Resistance: 100.49
Disclaimer:
The above opinions given constitute general market commentary, and do not constitute the opinion or advice of IC Markets or any form of personal or investment advice.
Any opinions, news, research, analyses, prices, other information, or links to third-party sites contained on this website are provided on an "as-is" basis, are intended only to be informative, is not an advice nor a recommendation, nor research, or a record of our trading prices, or an offer of, or solicitation for a transaction in any financial instrument and thus should not be treated as such. The information provided does not involve any specific investment objectives, financial situation and needs of any specific person who may receive it. Please be aware, that past performance is not a reliable indicator of future performance and/or results. Past Performance or Forward-looking scenarios based upon the reasonable beliefs of the third-party provider are not a guarantee of future performance. Actual results may differ materially from those anticipated in forward-looking or past performance statements. IC Markets makes no representation or warranty and assumes no liability as to the accuracy or completeness of the information provided, nor any loss arising from any investment based on a recommendation, forecast or any information supplied by any third-party.
DXY Institutional Pullback Setup – Smart Money Buying the Dip!💰 DXY: The Dollar Flexing Hard - Institutional Swing Play! 🎯
📊 Market Overview
The U.S. Dollar Index (DXY) is showing serious institutional strength! After a clean pullback to the 786 Triangular Moving Average, we're locked and loaded for a bullish continuation play. This setup screams "smart money accumulation" and we're positioning for the ride up! 💪
🎯 The Setup: Bullish Confirmation ✅
Asset: DXY (U.S. Dollar Index CFD)
Bias: 🟢 BULLISH - Confirmed on institutional timeframes
Strategy Type: Swing/Day Trade Hybrid
📈 Technical Confluence:
✅ 786 TMA Pullback - Textbook institutional support zone
✅ Price action holding above key structure
✅ Volume profile showing accumulation
✅ Smart money footprint evident
🎲 The "Layered Entry" Gameplan (Thief Style 😎)
Instead of going all-in at one price, we're using multiple limit orders (layering strategy) to build our position like the institutions do:
💵 Entry Zones (Layer Your Orders):
Layer 1: 98.400
Layer 2: 98.600
Layer 3: 98.800
Note: You can add more layers based on your risk appetite and account size! The beauty of layering? You average into the move without FOMO-ing at the worst price. 🧠
Current Price Entry: Yes, you can enter at market if you're confident in the setup, but layering gives you better risk management.
🛡️ Risk Management (Thief OG Edition)
🚨 Stop Loss: 98.100
This is MY stop loss based on my risk tolerance. IMPORTANT: I'm NOT telling you to blindly copy this. Set your SL based on YOUR account size, risk percentage, and comfort level. Trade your plan, not mine! 🎰
🎯 Profit Target: 100.000 (The Big Round Number!)
🧲 Why 100.000?
Simple Moving Average acting as strong resistance
Psychological round number = liquidity magnet 🧲
Overbought conditions likely near this zone
Trap potential for late longs - we want to exit before the crowd panics!
Exit Strategy: Take profits in stages! Don't be greedy. 💰 Consider taking 50% off at 99.500 and letting the rest ride to 100.000 with a trailing stop.
DISCLAIMER: This target is MY analysis. You decide when to take profits based on your strategy. If you see your account glowing green, TAKE THE MONEY! 💸
🔗 Related Pairs to Watch (Correlation Game 🕹️)
The DXY doesn't move in isolation! Here are the correlated plays:
📉 Inverse Correlations (These typically move OPPOSITE to DXY):
FX:EURUSD - Strong negative correlation (~-95%). DXY up = EUR/USD down
FX:GBPUSD - Cable follows Euro's lead, watch for breakdown
OANDA:AUDUSD & OANDA:NZDUSD - Commodity currencies get crushed when DXY rips
Gold ( OANDA:XAUUSD ) - Dollar strength = gold weakness (classic inverse)
📈 Positive Correlations (These move WITH DXY):
FX:USDJPY - Yen pairs amplify dollar moves
OANDA:USDCHF - Swissy follows dollar strength
OANDA:USDCAD - Loonie weakens on DXY strength (unless oil goes parabolic)
Pro Tip: If DXY is pumping but EUR/USD isn't dumping proportionally, something's off - be careful! 🚩
🧠 Key Points & Edge:
Institutional Level Confirmed - The 786 TMA is a proven reversal/continuation zone used by big money
Swing Trading Sweet Spot - This isn't a scalp; give it room to breathe
Layer Like a Pro - Don't blow your load on one entry; scale in strategically
Risk First, Profits Second - Protect your capital like it's your only child 👶
Watch Correlations - DXY strength impacts EVERYTHING in Forex
⚠️ Risk Disclosure & "Thief Style" Disclaimer
THIS IS THE "THIEF STYLE" TRADING STRATEGY - JUST FOR FUN AND EDUCATIONAL PURPOSES! 🎲
This analysis represents MY personal trading plan and bias. I am NOT a financial advisor, and this is NOT financial advice. Trading involves substantial risk of loss, and you could lose more than your initial investment.
✅ Do your own research (DYOR)
✅ Never risk more than you can afford to lose
✅ Past performance ≠ future results
✅ Markets can remain irrational longer than you can remain solvent
Trade at your own risk! I'm sharing my playbook, but YOU are responsible for your account. If you make money, congrats! 🎉 If you lose money, that's on you, not me. Manage your risk like a pro! 💪
🚀 Let's Catch This Move Together!
The setup is ripe, the levels are clear, and the plan is locked in. Now we wait for the market to come to us - patience pays in this game! ⏰
✨ If you find value in my analysis, a 👍 and 🚀 boost is much appreciated — it helps me share more setups with the community!
#DXY #USDollarIndex #ForexTrading #SwingTrading #InstitutionalTrading #TechnicalAnalysis #TradingStrategy #ForexSignals #PriceAction #SupportAndResistance #RiskManagement #EURUSD #ForexCorrelation #SmartMoney #TradingView #MarketAnalysis #DayTrading #ForexLife #ThiefStyle #LayeredEntry #DollarBull
Happy Trading, Thief OGs! 💎🙌

DXY Daily Outlook — Bullish Order Flow Toward Equal HighsHello traders 👋
On the DXY daily chart, we can clearly see that price showed a strong bullish reaction after grabbing liquidity below 96.37, initiating a bullish order flow that, in my view, is still in progress.
The equal highs above the current price act as a potential draw on liquidity and serve as my first bullish target.
However, keep an eye on the trendline liquidity forming below the current price — there’s a possibility that price may sweep this liquidity before continuing higher.
Overall, my bias remains bullish for now.
💌It is my honor to share your comments with me💌
🔎 DYOR
💡Wait for the update!

DXY FRGNT Daily Forecast -Q4 | W45 | D6| Y25 |📅 Q4 | W45 | D6| Y25 |
📊 DXY FRGNT Daily Forecast
🔍 Analysis Approach:
I’m applying Smart Money Concepts, focusing on:
Identifying Points of Interest on the Higher Time Frames (HTFs) 🕰️
Using those POIs to define a clear trading range 📐
Refining those zones on Lower Time Frames (LTFs) 🔎
Waiting for a Break of Structure (BoS) for confirmation ✅
This method allows me to stay precise, disciplined, and aligned with the market narrative, rather than chasing price.
💡 My Motto:
"Capital management, discipline, and consistency in your trading edge."
A positive risk-to-reward ratio, paired with a high win rate, is the backbone of any solid trading plan 📈🔐
⚠️ Losses?
They’re part of the mathematical game of trading 🎲
They don’t define you — they’re necessary, they happen, and we move forward 📊➡️
🙏 I appreciate you taking the time to review my Daily Forecast.
Stay sharp, stay consistent, and protect your capital
— FRNGT 🚀
TVC:DXY

DXY - Long Term Trade - Double Bottom - Swing TradeTrade Plan shared on chart. 1:3 Trade Target set. Buy Stop pending Trade set at break of Neckline of the Double Bottom. Analysis shared with detail.

DXY Weekly Outlook – Two Key Scenarios AheadAs expected in the previous review, the price has reached the local point B.
Now the market stands at a crossroads, so let’s look at the possible scenarios for the upcoming week.
Plan A – Correction Within the Daily Order Flow
The first scenario suggests a slight correction.
The price may move into a small pullback within the daily order flow, find support there, and continue the movement toward point B.
As long as the market structure remains bullish, this scenario stays the main one.
Plan B – Possible Decline
However, we don’t cancel the bearish scenario.
Right now, the price is trading inside the weekly key level, and taking out the fractal high often acts as an indicator of a possible trend reversal.
That’s why, if the price breaks below the lower boundary of the daily order flow, I’ll start considering short setups.
Summary
Overall, the structure is still under pressure from major levels, and the coming week will show who takes control — buyers or sellers.
I’ll continue to monitor the reaction within the daily order flow zone and update the outlook in the next review.

The Dollar Index Near a Key HighThe Dollar Index Near a Key High
As shown on the Dollar Index (DXY) chart, the strength of the US currency is currently hovering near an important high reached in August. Market sentiment is being influenced by:
→ the ongoing government shutdown, which has already become the longest in history;
→ traders’ assessment of last week’s developments, including the Fed’s interest rate cut, the meeting between the US and Chinese presidents in South Korea, and quarterly earnings reports from major corporations.
Adding to the turbulence is the political factor: according to media reports, Democrats have achieved victories in several local elections. Notably, Zohran Mamdani – a Muslim candidate from the Democratic Party – has been elected Mayor of New York for the first time.
Technical Analysis of the DXY Chart
It is worth recalling that on 19 September we published an important analysis of the DXY chart, in which we:
→ highlighted the false breakout of the 1 July low;
→ suggested a bullish scenario.
Following this, the price rose to the upper boundary of the red channel. In our earlier analysis, we:
→ constructed an ascending channel;
→ anticipated that the upward trajectory would remain relevant.
That scenario played out – demand proved strong enough to overcome:
→ resistance around the 95-point level, where a double-top pattern (a–b) had previously formed;
→ the psychological barrier at 100 points.
It is possible that the 3.7% rise in the Dollar Index over roughly one and a half months could attract sellers. The main intrigue now lies in whether we will see an aggressive reversal accompanied by a false breakout – similar to what occurred in September, but this time in a downward direction.
This article represents the opinion of the Companies operating under the FXOpen brand only. It is not to be construed as an offer, solicitation, or recommendation with respect to products and services provided by the Companies operating under the FXOpen brand, nor is it to be considered financial advice.

DXY(DOLLAR INDEX) SHORT
Correction moved expected now after agrressive bullish momentum
12345 elliots move completed

DXY FRGNT Daily Forecast -Q4 | W45 | D4| Y25 |
📅 Q4 | W45 | D4| Y25 |
📊 DXY FRGNT Daily Forecast
🔍 Analysis Approach:
I’m applying Smart Money Concepts, focusing on:
Identifying Points of Interest on the Higher Time Frames (HTFs) 🕰️
Using those POIs to define a clear trading range 📐
Refining those zones on Lower Time Frames (LTFs) 🔎
Waiting for a Break of Structure (BoS) for confirmation ✅
This method allows me to stay precise, disciplined, and aligned with the market narrative, rather than chasing price.
💡 My Motto:
"Capital management, discipline, and consistency in your trading edge."
A positive risk-to-reward ratio, paired with a high win rate, is the backbone of any solid trading plan 📈🔐
⚠️ Losses?
They’re part of the mathematical game of trading 🎲
They don’t define you — they’re necessary, they happen, and we move forward 📊➡️
🙏 I appreciate you taking the time to review my Daily Forecast.
Stay sharp, stay consistent, and protect your capital
— FRNGT 🚀
TVC:DXY

DOLLAR INDEXTHE LONDON SESSION NIS SHOWING THE DOLLAR INDEX BREAK OF 4HR SUPPLY ROOF.,IF DOLLAR DEMAND HOLDS STRONG GOLD COULD DROP.
The DXY (US Dollar Index) is a benchmark that measures the value of the US dollar relative to a basket of six major global currencies: the euro (largest component), Japanese yen, British pound, Canadian dollar, Swedish krona, and Swiss franc. It serves as a broad indicator of the dollar’s strength or weakness against these currencies.
It reflects the impact of relatively higher US interest rates and bond yields compared to other major economies.
Geopolitical uncertainties and safe-haven demand also support the dollar's position, influencing the DXY.
Key Factors Influencing DXY
Monetary Policy: The Federal Reserve’s interest rate decisions and forward guidance are primary drivers.
Economic Performance: Relative growth, inflation, and employment trends in the US versus other economies.
Risk Sentiment: The DXY often rises during periods of global uncertainty due to flight-to-quality flows into the dollar.
Trade and Capital Flows: Trade balances and foreign investment flows contribute to fluctuations.
Summary
The DXY measures overall US dollar strength against a broad basket of key currencies and is influenced heavily by US monetary policy, economic indicators, and global risk sentiment. It currently shows moderate bullishness, reflecting the Federal Reserve’s tighter policy stance and global economic conditions.
#DXY #DOLLAR #US1Y

DXY should make clear path soonThere is a liquidation zone on number 9 TD sequential and bottom of mini channel.
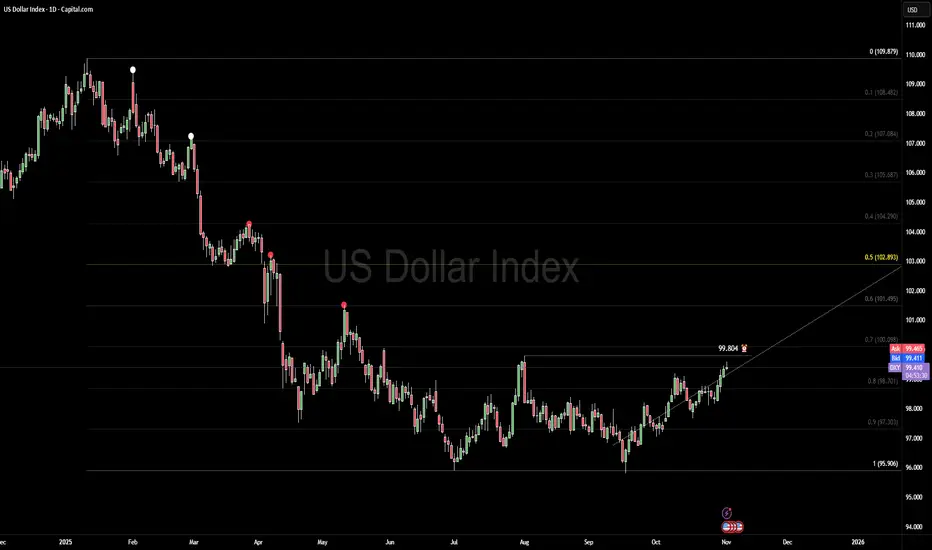
US DOLLAR — Structure Shift in Motion🧭 Context
The dollar continues to push higher while major crosses weaken. Risk sentiment remains defensive as traders lean toward safety going into the new week.
📈 Technical POV
We’re trading into the structural pivot at 99.804, not above it yet. The daily chart shows stretched momentum — near +2 deviation — but buyers still control the short-term rhythm. The broader weekly bias remains bearish, so this move likely forms a counter-rally within the larger range.
🌍 Macro View
Currency Index: DXY advancing toward 100.00, driven by steady demand for USD amid uncertain global data.
Central Bank: The Fed’s 25 bps cut came with a neutral tone, signaling a pause — enough to keep the dollar firm.
Yields: U.S. 10-year yields hover near 4%, maintaining the yield advantage over Europe and Japan.
Seasonality: Early November often favors USD flows as funds rebalance into year-end positioning.
📊 Volume / Order Flow
Liquidity behavior remains balanced near current levels. No clear exhaustion yet — market is simply rotating into the key 99.804 zone, waiting for confirmation before expansion.
🎯 Plan
If we close above 99.804, it could unlock a move toward the weekly discount-zone liquidity, potentially sparking strong reactions across major cross pairs. If rejected, expect short-term pullback before any renewed strength.
🧠 CORE5 Note
Professional traders don’t predict — they prepare. Let price prove conviction before you act.
Institutional Logic. Modern Technology. Real Freedom.
03.11.25 Morning ForecastPairs on Watch -
FX:AUDUSD
FX:NZDJPY
A short overview of the instruments I am looking at for today, multi-timeframe analysis down to what I will be looking at for an entry. Enjoy!

DXY key levels to look out for this week (WC 17/11)DXY key levels for the following week ahead.
Key fundamentals this week includes FOMC meeting minutes on Wednesday, NFP change along with unemployment rate on Thursday and to finish the week off on Friday- Manufacturing & Services PMI release on Friday.

DXY-DAily SetupPrice is expected to retest the 99.122 resistance level, where I will be looking for lower-timeframe sell confirmations. My initial target for the downside move is the 98.313 support zone. If this level breaks decisively, I will monitor the next support area for continuation.
My invalidation for the bearish scenario will be a clean break and retest of 99.339, which would signal potential bullish continuation in line with the broader trend.
While executing the sell setup, I will also be watching closely for a bullish reversal around 97.863, which aligns with my higher-timeframe bias.
