PHA/USDT – Multi-Year Accumulation at a Critical Demand Zone!
Overview:
PHA/USDT has been in a long downtrend since its 2021 peak. However, since mid-2022, price action has consistently formed a multi-year base around the 0.07 – 0.10 USDT demand zone (yellow box). This level has been tested several times, yet buyers continue to defend it, signaling strong acc
Related pairs
#PHAUSDT 4H ChartPrice had tapped perfectly into a 4h area of demand where it bounced from. MACD is showing bearish weakness and RSI is slightly sold. Price is expected to keep pushing up towards our minor supply zone at $0.108 as a short-term target.

#PHA - Price Analysis#PHA - Price Analysis
🔴 Still Bearish Beneath $0.1080–$0.1100 Resistance
🔸Structure: Bullish wedge forming 📈
🔸Daily Trend: Uptrend remains intact, continuing to support price 📈
Key Scenario:
If price continues to consolidate above $0.0980, I anticipate a potential strong move upward.
⚠️ Uncert

PHAUSDT 1D#PHA is moving within a symmetrical triangle on the daily chart and is currently facing the daily SMA100. A breakout above the SMA100 could signal further upside potential. If it breaks out above the triangle resistance, the targets are:
🎯 $0.1454
🎯 $0.1642
🎯 $0.1890
🎯 $0.2242
⚠️ As always, use a

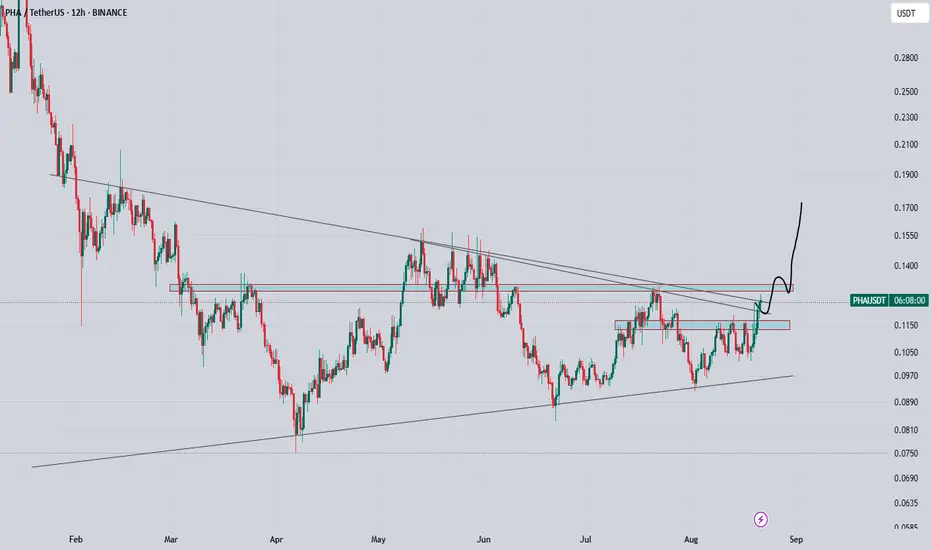
Pha finally on verge of breakout consolidating within symmetrical triangle from long time, now trying to clear these multiple lines, as long as its holding 0.11 area. i will remain bullish and after breakout it can give solid rally, expecting 2x in coming days
Phala Network ~2,000% Uptrend Missing, Why?It is hard to believe that it has been four months already since we last updated this chart. This is PHAUSDT (Phala Network) and the last update happened 15-April 2025. Let me be clear and straight forward, market conditions are the same but better.
PHAUSDT continues to consolidate at bottom prices

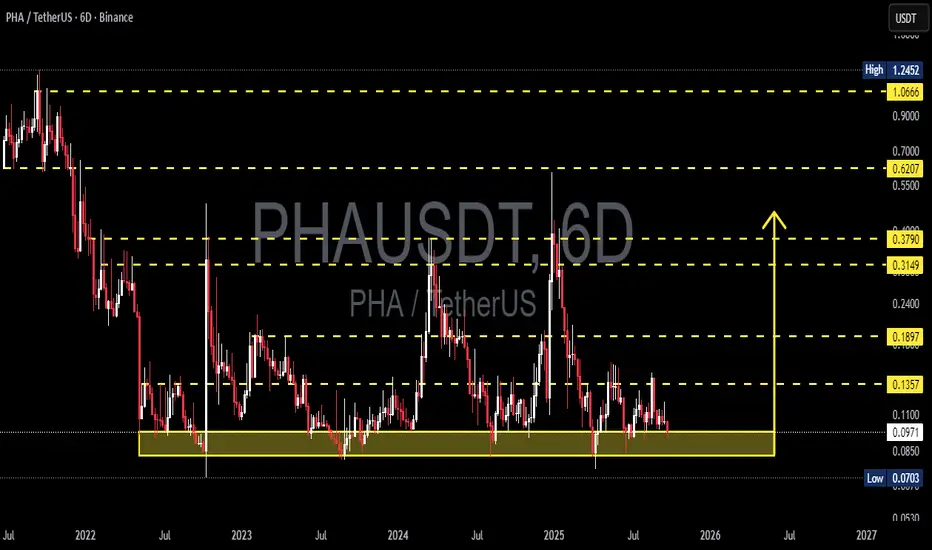
PHAUSDT at Make-or-Break Zone Is This the Calm Before the Storm?📍 Chart Overview (6D Timeframe – Binance)
PHA/USDT is currently retesting a major historical demand zone between $0.0703 - $0.0986, highlighted by the yellow box. This zone has acted as a strong base since mid-2022, repeatedly absorbing selling pressure and bouncing the price back up.
Over the pas

PHAUSDT 1D#PHA has formed a symmetrical triangle on the daily chart. It is currently trading above the Ichimoku Cloud and the daily SMA100, which is a strong bullish sign. In case of a breakout above the triangle resistance, the targets are:
🎯 $0.1454
🎯 $0.1642
🎯 $0.1890
🎯 $0.2242
⚠️ Always use a tight stop

PHA Bounce from Historical Support ZonePHA is showing signs of a potential bullish reversal after bouncing off a long-standing support zone. Price has consistently respected this support level since mid-2022, creating a strong base. Now, we’re seeing bullish momentum building as the weekly candle breaks above the 50-week EMA, which had a

LONG PHA NOWPHA ~ 1W Analysis
#PHA Buy back on retest of this support block with short term target of at least 20%+ from this support.
ENTRY : < $0.11
TP 1 : $0.5
TP 2 : $1

See all ideas
Summarizing what the indicators are suggesting.
Oscillators
Neutral
SellBuy
Strong sellStrong buy
Strong sellSellNeutralBuyStrong buy
Oscillators
Neutral
SellBuy
Strong sellStrong buy
Strong sellSellNeutralBuyStrong buy
Summary
Neutral
SellBuy
Strong sellStrong buy
Strong sellSellNeutralBuyStrong buy
Summary
Neutral
SellBuy
Strong sellStrong buy
Strong sellSellNeutralBuyStrong buy
Summary
Neutral
SellBuy
Strong sellStrong buy
Strong sellSellNeutralBuyStrong buy
Moving Averages
Neutral
SellBuy
Strong sellStrong buy
Strong sellSellNeutralBuyStrong buy
Moving Averages
Neutral
SellBuy
Strong sellStrong buy
Strong sellSellNeutralBuyStrong buy
Displays a symbol's price movements over previous years to identify recurring trends.
Frequently Asked Questions
The current price of Phala Network / Tether SPOT (PHA) is 0.0931 USDT — it has fallen −2.72% in the past 24 hours. Try placing this info into the context by checking out what coins are also gaining and losing at the moment and seeing PHA price chart.
Phala Network / Tether SPOT price has fallen by −10.84% over the last week, its month performance shows a −11.78% decrease, and as for the last year, Phala Network / Tether SPOT has decreased by −30.57%. See more dynamics on PHA price chart.
Keep track of coins' changes with our Crypto Coins Heatmap.
Keep track of coins' changes with our Crypto Coins Heatmap.
Phala Network / Tether SPOT (PHA) reached its highest price on Dec 28, 2024 — it amounted to 0.6021 USDT. Find more insights on the PHA price chart.
See the list of crypto gainers and choose what best fits your strategy.
See the list of crypto gainers and choose what best fits your strategy.
Phala Network / Tether SPOT (PHA) reached the lowest price of 0.0753 USDT on Apr 7, 2025. View more Phala Network / Tether SPOT dynamics on the price chart.
See the list of crypto losers to find unexpected opportunities.
See the list of crypto losers to find unexpected opportunities.
The safest choice when buying PHA is to go to a well-known crypto exchange. Some of the popular names are Binance, Coinbase, Kraken. But you'll have to find a reliable broker and create an account first. You can trade PHA right from TradingView charts — just choose a broker and connect to your account.
Crypto markets are famous for their volatility, so one should study all the available stats before adding crypto assets to their portfolio. Very often it's technical analysis that comes in handy. We prepared technical ratings for Phala Network / Tether SPOT (PHA): today its technical analysis shows the strong sell signal, and according to the 1 week rating PHA shows the sell signal. And you'd better dig deeper and study 1 month rating too — it's sell. Find inspiration in Phala Network / Tether SPOT trading ideas and keep track of what's moving crypto markets with our crypto news feed.
Phala Network / Tether SPOT (PHA) is just as reliable as any other crypto asset — this corner of the world market is highly volatile. Today, for instance, Phala Network / Tether SPOT is estimated as 1.63% volatile. The only thing it means is that you must prepare and examine all available information before making a decision. And if you're not sure about Phala Network / Tether SPOT, you can find more inspiration in our curated watchlists.
You can discuss Phala Network / Tether SPOT (PHA) with other users in our public chats, Minds or in the comments to Ideas.