#PHB/USDT is rejecting from the Diagonal Trendline#PHB
The price is moving within an ascending channel on the 1-hour timeframe and is adhering to it well. It is poised to break out strongly and retest the channel.
We have a downtrend line on the RSI indicator that is about to break and retest, which supports the upward move.
There is a key suppo
Related pairs

PHBPhoenix PHB, it is showing a good accumulation and strength, according to previous moves of this project, i would say that it will hit 1$
hope to have analyzed well and also the market will act as a booster..
NFA
DYOR

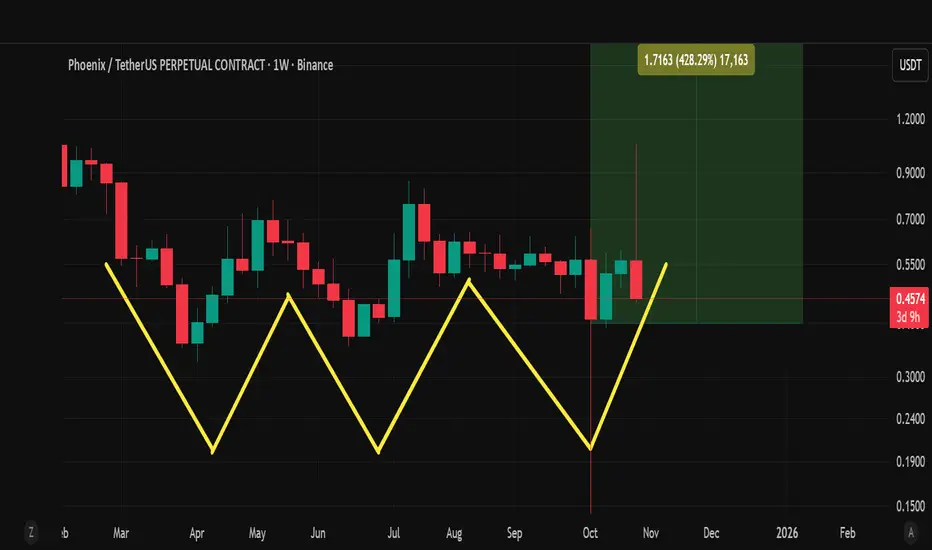
#PHB is ready to perform the Triple Bottom bullish formation#PHB is ready to perform the Triple Bottom bullish formation🕯
📌 Target Level
💵 $ 0.5275
💵 $ 0.7080
💵 $ 1.2350
💵 $ 1.916
#PHB/USDT#PHB
The price is moving within a descending channel on the 1-hour frame and is expected to break and continue upward.
We have a trend to stabilize above the 100 moving average once again.
We have a downtrend on the RSI indicator that supports the upward move with a breakout.
We have a support a

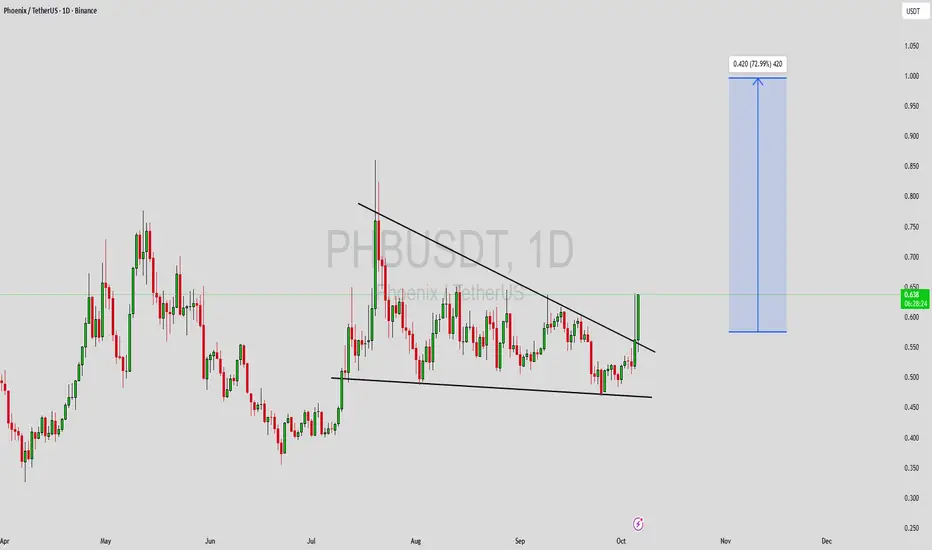
PHBUSDT 1D#PHB is moving inside a descending triangle pattern on the daily chart and has bounced off the triangle’s support line.
In case of a breakout above the daily SMA200 and the triangle resistance, the potential targets are:
🎯 $0.598
🎯 $0.747
🎯 $0.867
🎯 $0.987
🎯 $1.159
🎯 $1.377
⚠️ Always remember to u

The AI era begins!The project aims to combine AI, privacy, and Web3 technologies to build infrastructure & apps (dApps) that are fast, scalable, and privacy-preserving.

PHBUSDT Forming Falling WedgePHBUSDT is currently displaying a classic falling wedge pattern on the chart, a strong bullish signal that often indicates a trend reversal. After a prolonged consolidation phase within tightening support and resistance lines, the price seems to be preparing for a breakout to the upside. The good tr
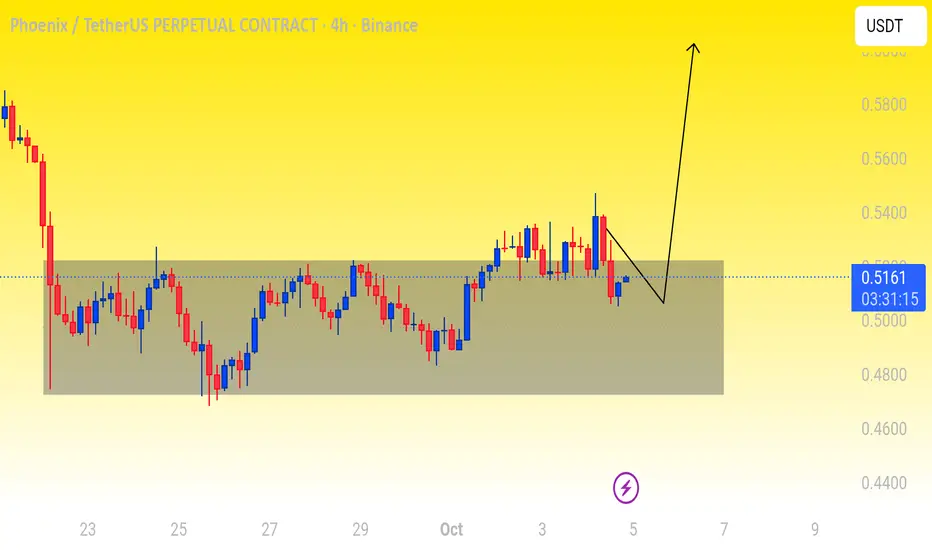
PHB PLAN AMEX:PHB Update 💹
Price is holding well within the buy zone around 0.53 – 0.52 and showing signs of strength. The overall structure looks bullish, and I’m expecting a move toward 0.56 – 0.65 in the coming sessions 🚀
Momentum is building, and the chart looks ready for the next leg up 📈
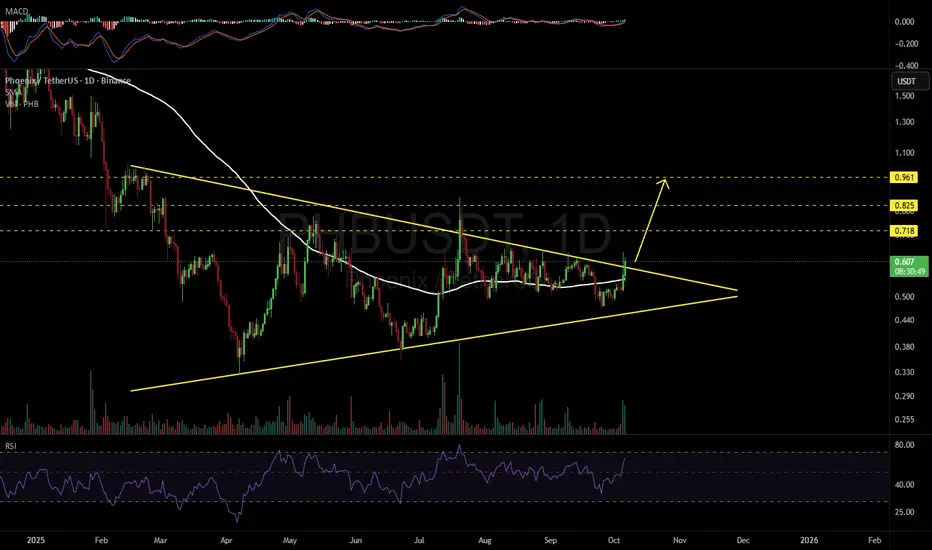
PHBUSDT 1D#PHB has broken above the symmetrical triangle resistance and the SMA100 on the daily chart. The increasing volume is a positive sign. If it manages to close the daily candle above the triangle, the potential targets are:
🎯 $0.718
🎯 $0.825
🎯 $0.961
⚠️ Always remember to use a tight stop-loss and m
PHBUSDT UPDATE#PHB
UPDATE
PHB Technical Setup
Pattern: Bullish falling wedge pattern
Current Price: $0.95
Target Price: $1.48
Target % Gain: 55.97%
AMEX:PHB is breaking out of a falling wedge pattern on the 1D timeframe. Current price is $0.95 with a target near $1.48, showing about 56% potential upside. The

See all ideas
Summarizing what the indicators are suggesting.
Oscillators
Neutral
SellBuy
Strong sellStrong buy
Strong sellSellNeutralBuyStrong buy
Oscillators
Neutral
SellBuy
Strong sellStrong buy
Strong sellSellNeutralBuyStrong buy
Summary
Neutral
SellBuy
Strong sellStrong buy
Strong sellSellNeutralBuyStrong buy
Summary
Neutral
SellBuy
Strong sellStrong buy
Strong sellSellNeutralBuyStrong buy
Summary
Neutral
SellBuy
Strong sellStrong buy
Strong sellSellNeutralBuyStrong buy
Moving Averages
Neutral
SellBuy
Strong sellStrong buy
Strong sellSellNeutralBuyStrong buy
Moving Averages
Neutral
SellBuy
Strong sellStrong buy
Strong sellSellNeutralBuyStrong buy
Displays a symbol's price movements over previous years to identify recurring trends.
Frequently Asked Questions
The current price of PHB / USDT Spot Trading Pair (PHB) is 0.315 USDT — it has fallen −0.31% in the past 24 hours. Try placing this info into the context by checking out what coins are also gaining and losing at the moment and seeing PHB price chart.
PHB / USDT Spot Trading Pair price has fallen by −0.31% over the last week, its month performance shows a −17.02% decrease, and as for the last year, PHB / USDT Spot Trading Pair has decreased by −83.22%. See more dynamics on PHB price chart.
Keep track of coins' changes with our Crypto Coins Heatmap.
Keep track of coins' changes with our Crypto Coins Heatmap.
PHB / USDT Spot Trading Pair (PHB) reached its highest price on Mar 14, 2024 — it amounted to 3.260 USDT. Find more insights on the PHB price chart.
See the list of crypto gainers and choose what best fits your strategy.
See the list of crypto gainers and choose what best fits your strategy.
PHB / USDT Spot Trading Pair (PHB) reached the lowest price of 0.128 USDT on Oct 10, 2025. View more PHB / USDT Spot Trading Pair dynamics on the price chart.
See the list of crypto losers to find unexpected opportunities.
See the list of crypto losers to find unexpected opportunities.
The safest choice when buying PHB is to go to a well-known crypto exchange. Some of the popular names are Binance, Coinbase, Kraken. But you'll have to find a reliable broker and create an account first. You can trade PHB right from TradingView charts — just choose a broker and connect to your account.
Crypto markets are famous for their volatility, so one should study all the available stats before adding crypto assets to their portfolio. Very often it's technical analysis that comes in handy. We prepared technical ratings for PHB / USDT Spot Trading Pair (PHB): today its technical analysis shows the sell signal, and according to the 1 week rating PHB shows the sell signal. And you'd better dig deeper and study 1 month rating too — it's sell. Find inspiration in PHB / USDT Spot Trading Pair trading ideas and keep track of what's moving crypto markets with our crypto news feed.
PHB / USDT Spot Trading Pair (PHB) is just as reliable as any other crypto asset — this corner of the world market is highly volatile. Today, for instance, PHB / USDT Spot Trading Pair is estimated as 1.91% volatile. The only thing it means is that you must prepare and examine all available information before making a decision. And if you're not sure about PHB / USDT Spot Trading Pair, you can find more inspiration in our curated watchlists.
You can discuss PHB / USDT Spot Trading Pair (PHB) with other users in our public chats, Minds or in the comments to Ideas.