US30 trade ideas
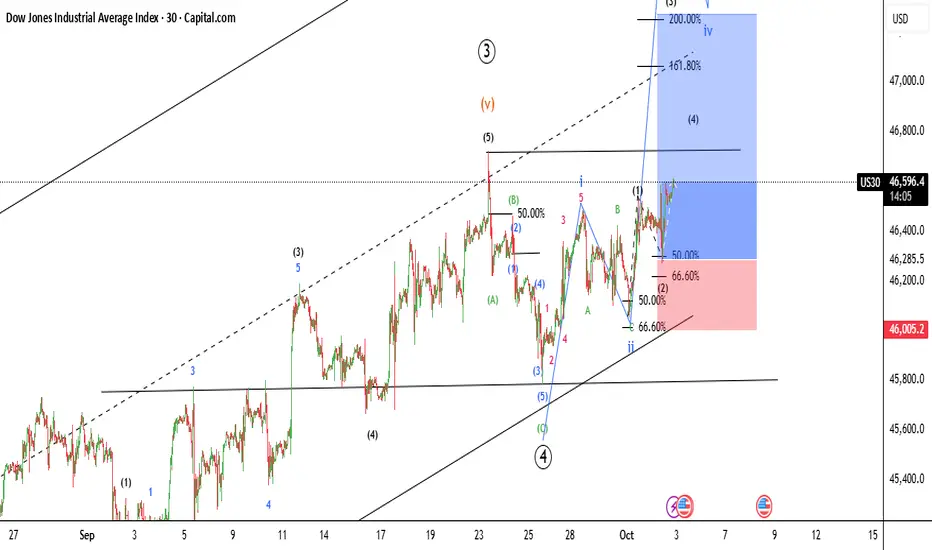
US30 4H🔹 Overall Outlook and Potential Price Movements
In the charts above, we have outlined the overall outlook and possible price movement paths.
As shown, each analysis highlights a key support or resistance zone near the current market price. The market’s reaction to these zones — whether a breakout or rejection — will likely determine the next direction of the price toward the specified levels.
⚠️ Important Note:
The purpose of these trading perspectives is to identify key upcoming price levels and assess potential market reactions. The provided analyses are not trading signals in any way.
✅ Recommendation for Use:
To make effective use of these analyses, it is advised to manually draw the marked zones on your chart. Then, on the 15-minute time frame, monitor the candlestick behavior and look for valid entry triggers before making any trading decisions.

DJI Holy sh!% Bubble, 2028Just an idea I was playing around with, Dow Jones on this long parabolic move and the resulting crash wIll be fantastically devastating for the american people, again.


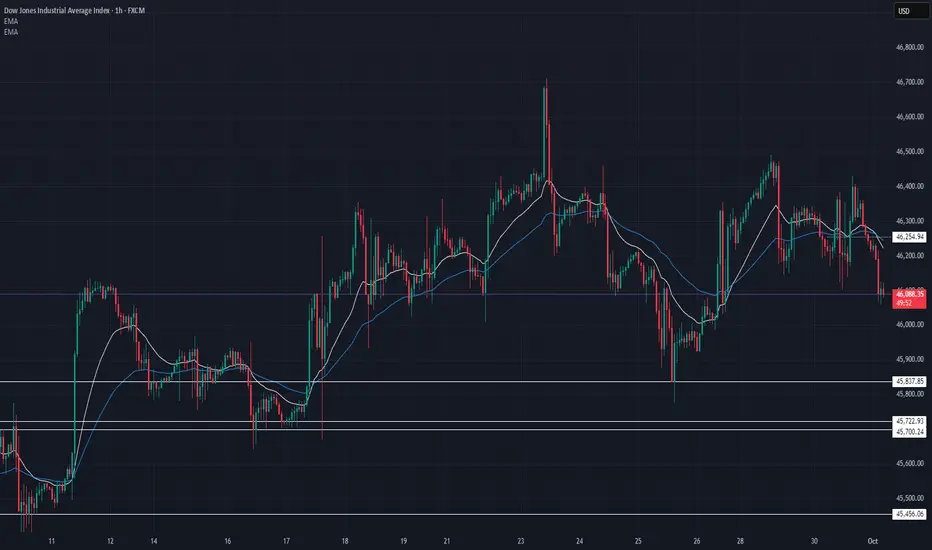
US30 Technical Breakdown – 10/01/2025📍 US30 Technical Breakdown – 10/01/2025
US30 slipped under 46,200, testing the 46,100 zone as support. EMAs rolling bearish → momentum shifting lower unless buyers defend.
📊 Market Behavior:
🔹 Lower highs forming after 46,500 rejection
🔹 46,100 acting as intraday demand
🔹 Below 45,837 → stronger sell-off risk
📌 Key Levels:
🔹 Resistance Zones:
46,250 → intraday barrier
46,400 → breakout ceiling
46,650 → bull target if regained
🔹 Support Zones:
46,100 → short-term demand
45,837 → key pivot
45,722 → deeper support
45,456 → bear target
🧠 Bias:
Leaning bearish ⚠️ unless price reclaims 46,250+
Bullish momentum only confirmed above 46,400 🚀
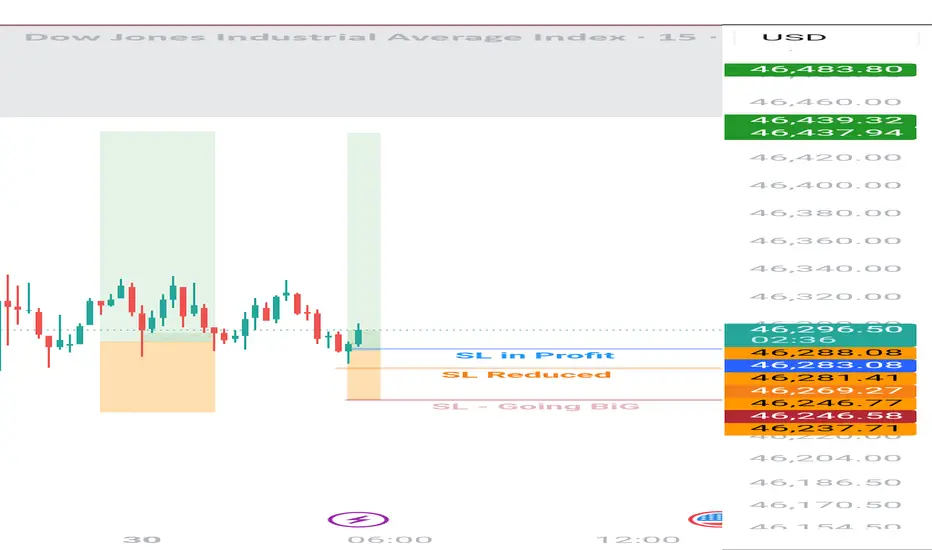
US30: Absolute Price Collapse Ahead! Short!
My dear friends,
Today we will analyse US30 together☺️
The recent price action suggests a shift in mid-term momentum. A break below the current local range around 46,224.50 will confirm the new direction downwards with the target being the next key level of 46,164.12 and a reconvened placement of a stop-loss beyond the range.
❤️Sending you lots of Love and Hugs❤️
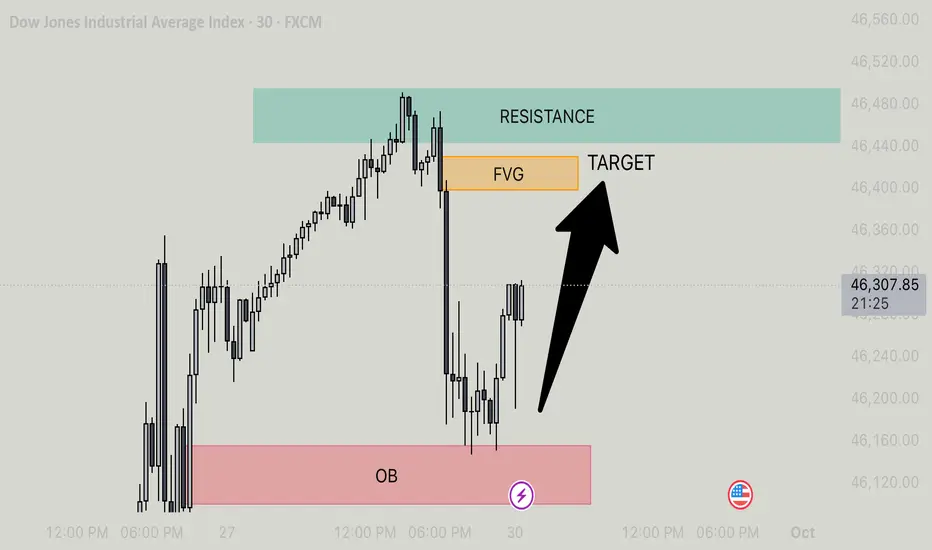
US30 - BULLISH MOMENTUM TARGETING FVG AFTER OB REJECTION Price is currently in a clear bullish phase following a strong reaction from the marked Order Block (OB) zone. This OB acted as a high-probability demand area, where institutional buying likely stepped in, reversing the prior bearish move and initiating a shift in market structure. The subsequent price action has formed a series of higher lows and bullish candles, indicating sustained buying pressure and a potential continuation toward the upside.
The next key area of interest is the Fair Value Gap (FVG), which represents an inefficiency in price where no trading occurred. These imbalances are often targeted by institutions to rebalance the market, and price tends to gravitate toward them. In this case, the FVG is positioned just below a well-defined resistance zone, creating a high-probability target for the current bullish move.
Given the lack of immediate overhead resistance before the FVG, and the presence of strong bullish momentum, price is expected to continue climbing until it reaches the FVG zone. Once this area is filled, we may see a reaction or potential rejection, but for now, the structure supports a move upward. Traders should watch for continuation patterns, such as bullish flags or breakouts, as confirmation that price will tap into the FVG before any significant reversal occurs.
Dow Jones US30 Analysis: Bullish Trend, Trade Plan📊 The US30 (Dow Jones) remains in a strong bullish trend, showing a clear sequence of higher highs and higher lows on the 4-hour chart 📈. However, when viewed on the daily timeframe, price now appears somewhat overextended ⚠️.
🔎 Dropping down to the lower timeframes and applying the Anchored VWAP (AVWAP) indicator, it’s evident that price is trading well above VWAP, signaling a premium zone. The risk here is that traders may continue buying into strength without acknowledging that price could easily retrace back into VWAP.
💡 Remember — smart money buys at a discount, not at a premium. In bullish trends like this, patience is crucial.
📹 In the video, I outline my trade plan, which focuses on waiting for a healthy pullback and then looking for a bullish setup if the structure aligns in our favor. I’m not interested in chasing price when it’s this extended — instead, I prefer to wait for the retracement and enter at better value, reducing risk and improving trade quality 🎯.
⚠️ Disclaimer: This analysis is for educational purposes only and not financial advice. Always trade responsibly and manage risk carefully.

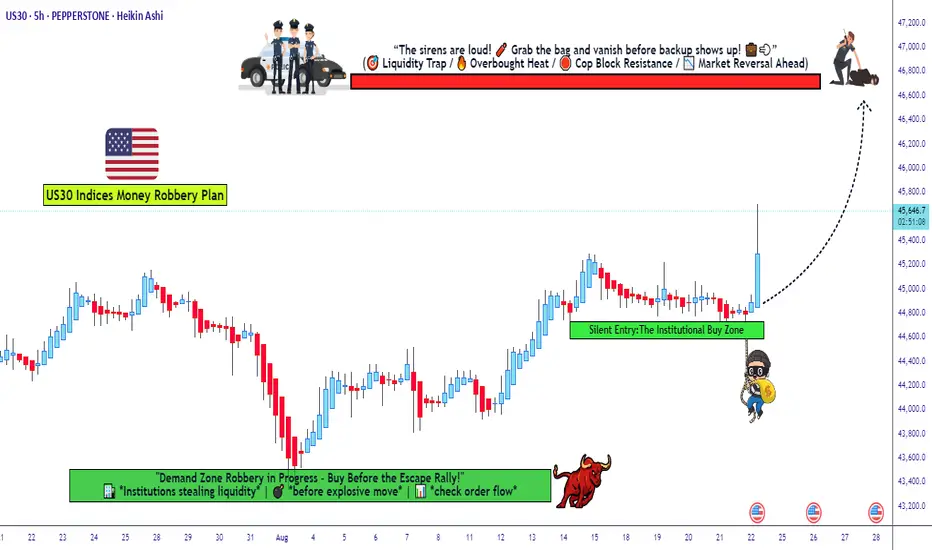
Dow Jones Bulls Preparing Another Robbery — Are You In?🚨💰 US30/DJ30 Index CFD Market Heist Plan 🏦🎭
🕵️ Dear Thief OG’s, Ladies & Gentlemen of the robbery squad… the vault is wide open again! This time we’re sneaking into the Dow Jones (US30) for a Bullish Day/Swing Heist. 🔥
🎯 Robbery Blueprint
Asset: US30/DJ30 Index CFD (Day/Swing Trade)
Plan: Bullish 📈
Entry (Thief Style):
The thief never knocks once… we layer the doors! Multiple buy limit orders 🔐:
Layer 1 → 45,600.0
Layer 2 → 45,400.0
Layer 3 → 45,200.0
(You can expand the layers depending on your risk appetite 🕳️)
Stop Loss (SL) 🛑:
📍 Thief SL @ 44,600.0
(Adjust based on your own risk & startergy – remember, survival is key in every robbery 🏃💨)
Target (TP) 🎯:
🚓 Police barricade spotted @47,000.0! Our sweet escape is planned at 46,800.0 before sirens catch us. 💰
🏆 Thief Strategy
Multiple limit order entries (layering method / scaling in).
Enter at any price level if you’re fast, but layering is the OG Thief move.
Manage your SL & risk like a pro robber – no reckless moves, or you’ll end up behind market bars! 🚔
💡 Why This Heist? 💡
The US30/DJ30 is primed for a bullish run 📈, driven by real-time market signals:
Technical Analysis: Strong support levels holding firm, momentum indicators screaming bullish! 📊
Fundamental Outlook: Check global market data, COT reports, and sentiment analysis for confirmation. 🔗👉
Volatility Watch: Stay sharp for news releases that could spike volatility. 📰⚠️
⚠️ Thief’s Risk Management ⚠️
News Alert: Avoid new trades during major news drops to dodge wild price swings. 🚫
Position Management: Use trailing stops to lock in those sweet profits. 🔐
Risk Control: Adjust lot sizes and SL based on your layered entries and risk profile. 📉
🏆 Join the Heist! 🏆
💥 Hit the Boost Button 💥 to power up our Thief Trader crew! 🚀 Let’s make bank with ease using the Thief Trading Style! 💸😎 Stay tuned for the next heist plan, and let’s keep robbing the markets! 🤑🐱👤
uptrend It is expected that after some fluctuation and correction, the trend change will take place and we will witness the start of the uptrend. Then it will advance to the specified resistance levels.
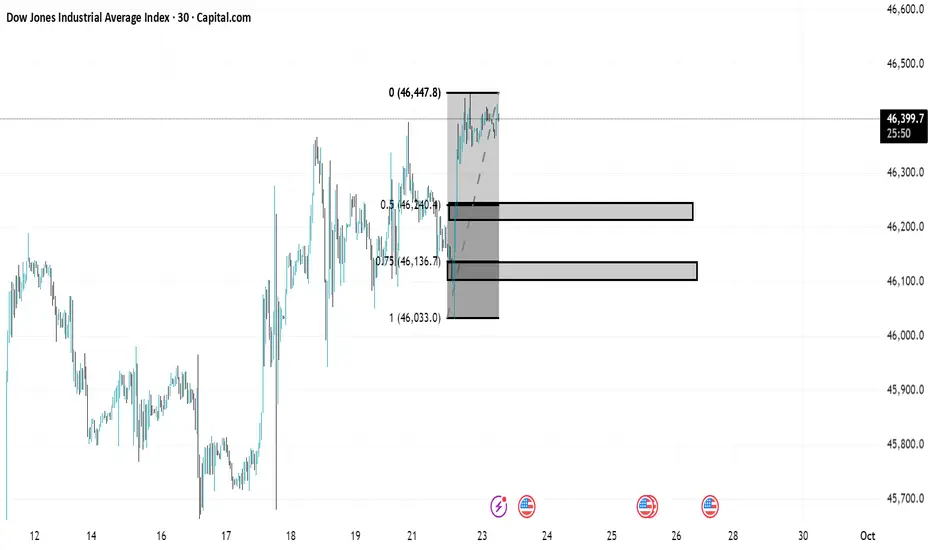
US30 TREND ANALYSISIn US30 there is a clear uptrend important areas are marked as always one is 50 percent area and the other one is 75 percent area .Once the market comeback for retest we will shift to smaller timeframe and look for trendshift after observing everything. When the market again comeback for the retest on smaller timeframe we will look for buy side trade.
important areas
50 percent zone(46245.3)
75 percent zone(46134.3)
bigger timeframe (30 minutes)
smaller timeframe(5 minutes)
Us30 Trade Set Up Oct 2 2025Price is overall bullish making HH/HL and has created a 4h FVG so i want to see price first sweep SSL/London lows, tap into 4h FVG to then look for 1m IFVG/CISD to target PDH
www.tradingview.com

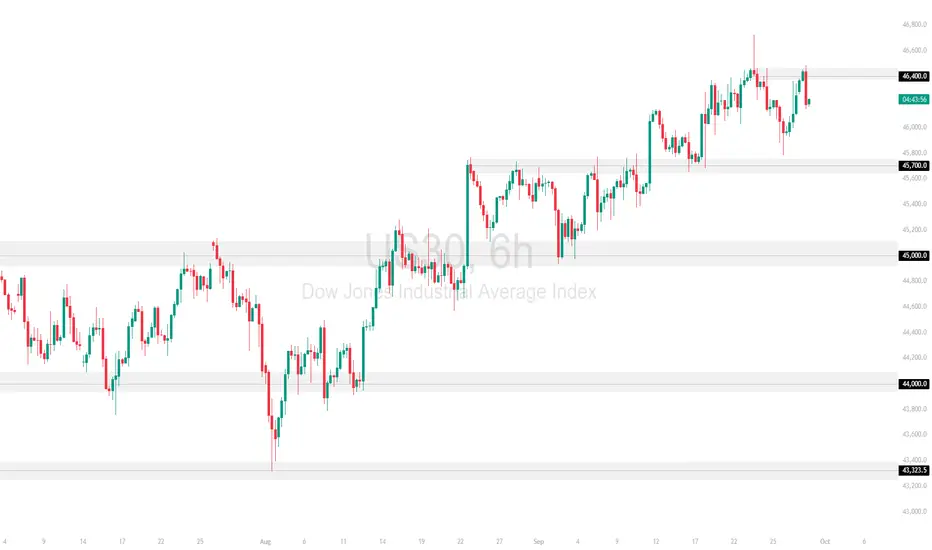
US30 Technical Analysis – Resistance RetestUS30 pushed higher into the 46,400 resistance zone but faced rejection, showing sellers defending this level. The index remains supported above 45,700, keeping the short-term bullish structure intact.
Support at: 45,700 🔽 / 45,000 🔽
Resistance at: 46,400 🔼
🔎 Bias:
🔼 Bullish: A breakout and close above 46,400 could extend upside momentum toward new highs.
🔽 Bearish: Failure to hold above 45,700 may invite pressure back to 45,000.
📛 Disclaimer: This is not financial advice. Trade at your own risk.
US30 Technical AnalysisPrice has been respecting the uptrend supported by the 50 SMA, with pullbacks finding buyers around the dynamic support zones. Recently, US30 rejected 46,400.0 resistance and is consolidating above 45,700.0 support, while the broader trend remains bullish.
Support at: 45,700.0 🔽 / 45,000.0 🔽
Resistance at: 46,400.0 🔼 / 47,115.8 🔼
🔎 Bias:
🔼 Bullish: A sustained hold above 46,000.0 and a breakout over 46,400.0 could extend the rally toward 47,115.8.
🔽 Bearish: A breakdown below 45,700.0 would expose 45,000.0 and weaken the uptrend momentum.
📛 Disclaimer: This is not financial advice. Trade at your own risk.

Volume profile indicator Volume Profile is an advanced charting tool that displays trading activity (volume) over a specified period at specified price levels
Volume Profile plots a histogram on the chart to show significant price levels based on volume (typically daily or weekly sessions)

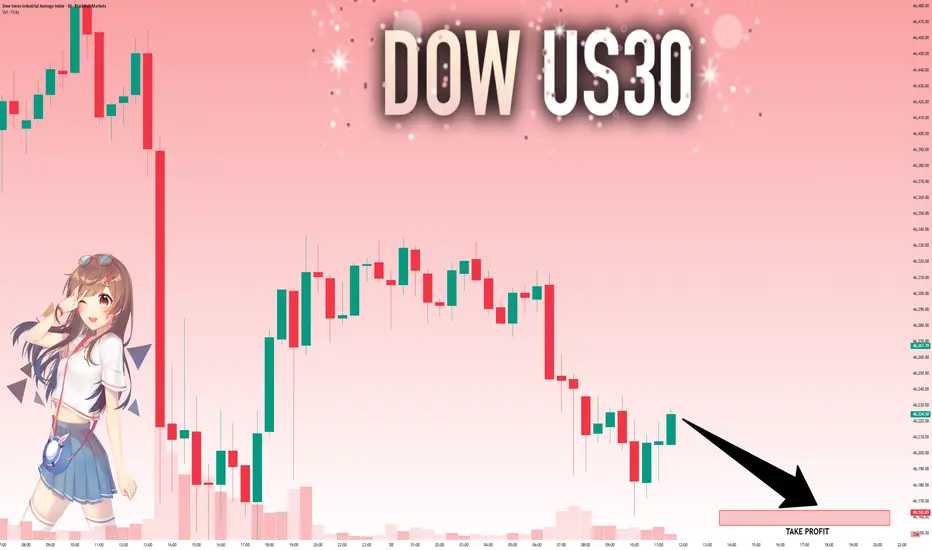
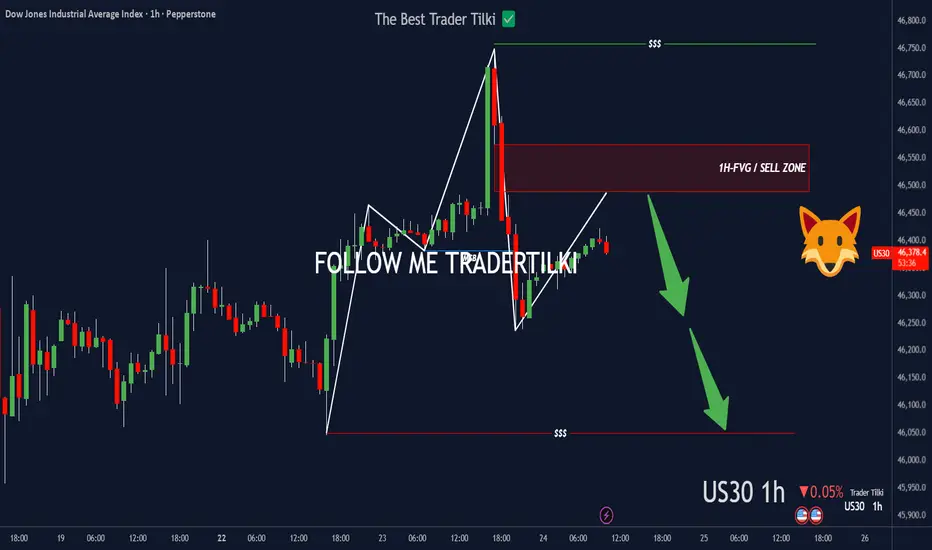
US30 left a footprint—FVG’s callin’.Hey Guys,
Once US30 hits my SELL zone, I’m pulling the trigger—targeting 46049.0
• Entry: 46574.5.0 or 46488.9
Set the stop point according to your own margin, my friends.
Every like you drop pushes me to share more setups like this. Big thanks to everyone showing support!
US30 Resistance Cluster Above!
HI,Traders !
#US30 made a bearish
Breakout of the support
Cluster of the rising and
Horizontal support levels
Which is now a resistance
Cluster round 46329.8 then
Went down and made a local
Pullback on Thursday and
Friday but we are bearish
Biased mid-term so we
Will be expecting a further
Bearish move down this week !
Comment and subscribe to help us grow !

We are close to a very RARE and HISTORICAL event.We are close to a very RARE and HISTORICAL event.
This would be only the 2nd time in over 125 years that we get a "SUPER" Capital Rotation Event.
Stock markets get destroyed when adjusted for inflation...
While gold, silver and friends enjoy their BEST years of outperformance!

US30 – Bears Eye 46,000 Ahead of Key GDP ReleaseUS30 – Overview
The Dow Jones remains under bearish momentum as traders await the key U.S. GDP report.
Markets expect a sharp rebound from the previous -0.5% reading to around 3.3%.
A stronger-than-expected result would likely pressure US30 lower, while a print closer to 2.0% could spark volatility and choppy price action.
Technical View
Bearish Scenario:
Price is expected to test 46,000 first.
🔻 A confirmed 1H close below 46,000 would extend the bearish trend toward 45,680 → 45,520.
Bullish Scenario:
If price stabilizes above 46,120, US30 is likely to consolidate within the 46,120 – 46,300 range.
A confirmed breakout above 46,300 would open the way toward 46,400 → 46,620.
Key Levels
Pivot: 46,120
Resistance: 46,300 – 46,400 – 46,620
Support: 46,000 – 45,680 – 45,520
The GDP release will be the main driver.
Above 46,120: consolidation with bullish attempts.
Below 46,000: continuation of the bearish trend toward deeper supports.

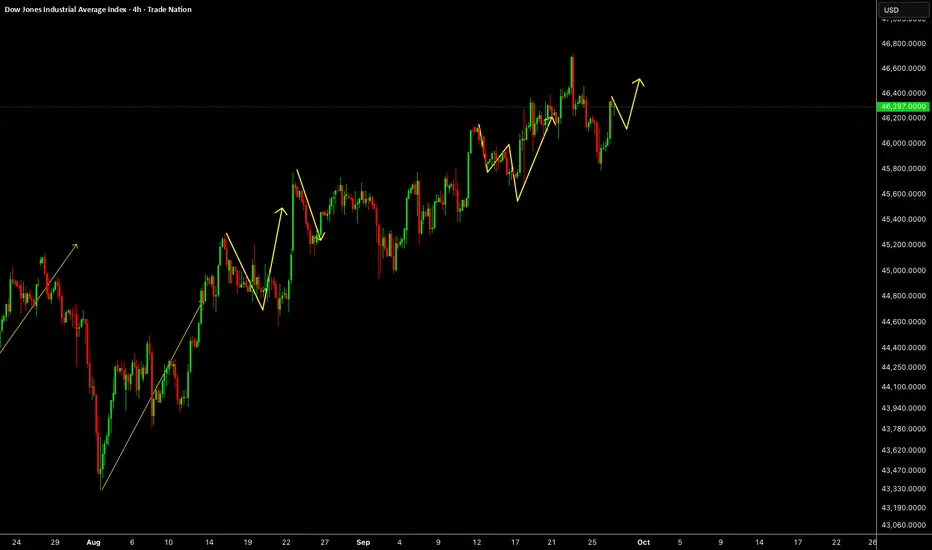
US30US30 needs some correction and one more push up to take ATH.
Disclosure: We are part of Trade Nation's Influencer program and receive a monthly fee for using their TradingView charts in our analysis.
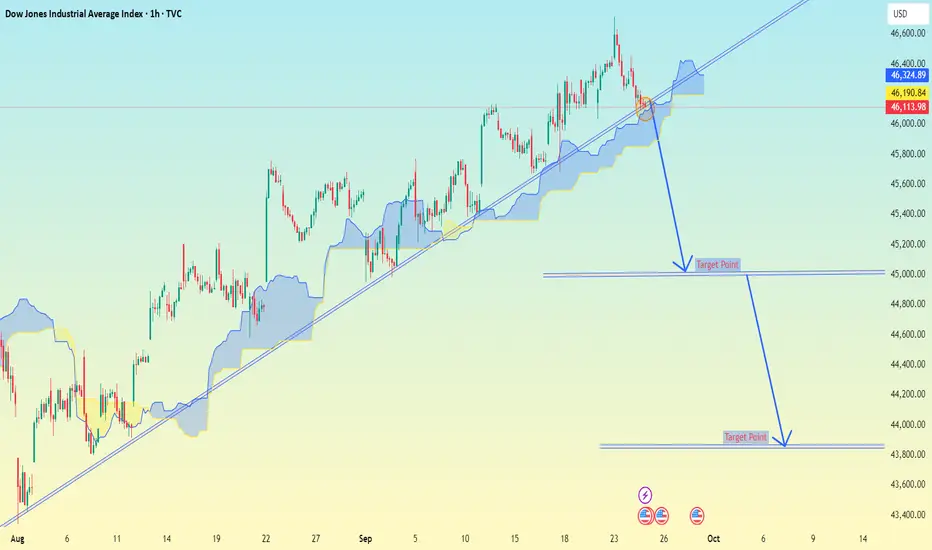
Dow Jones Industrial Average (DJI) on the 1-hour timeframe.Dow Jones Industrial Average (DJI) on the 1-hour timeframe.
From the chart:
The uptrend line is being tested.
There are two downside target points marked if the trendline breaks.
📉 Target levels shown on the chart:
1. First target zone: around 45,000 – 45,100
2. Second target zone: around 43,800 – 44,000
So if the price breaks the ascending trendline and confirms below it, the next expected supports are roughly:
45,000 area (first support/target)
43,800 area (second support/target)
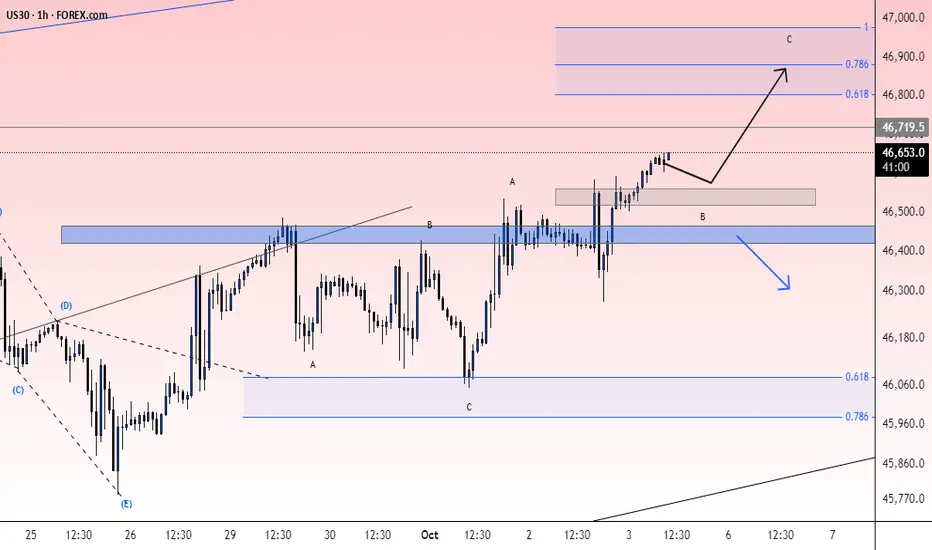
US30 Consolidation remains firmly within a strong bullish trendThe US30 has recorded a new high zone, extending its rally as markets continue to react positively to supportive macroeconomic conditions. Optimism is being driven largely by expectations of Federal Reserve interest rate cuts, while strong consolidation in the broader market further underpins sentiment.
A Price action remains firmly within a strong bullish trend as long as the index trades above 46,000. Sustained momentum above this key support level is likely to open the path towards the 47,200 resistance zone, potentially paving the way for further upside in the near term.
You any find more details in the chart,
Trade wisely best of Luck.
Ps; Support with like and comments for better analysis Thanks for Supporting.
