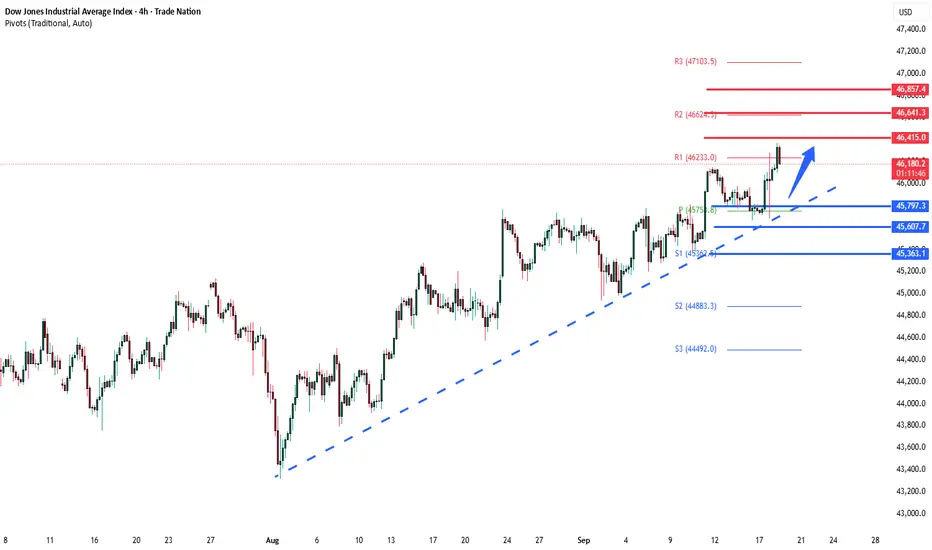
US30 LONG SETUP Price has successfully broken into a new level 46.. First test of new support was clean and now we looking for a second test as it continues with an up trend
US30 trade ideas

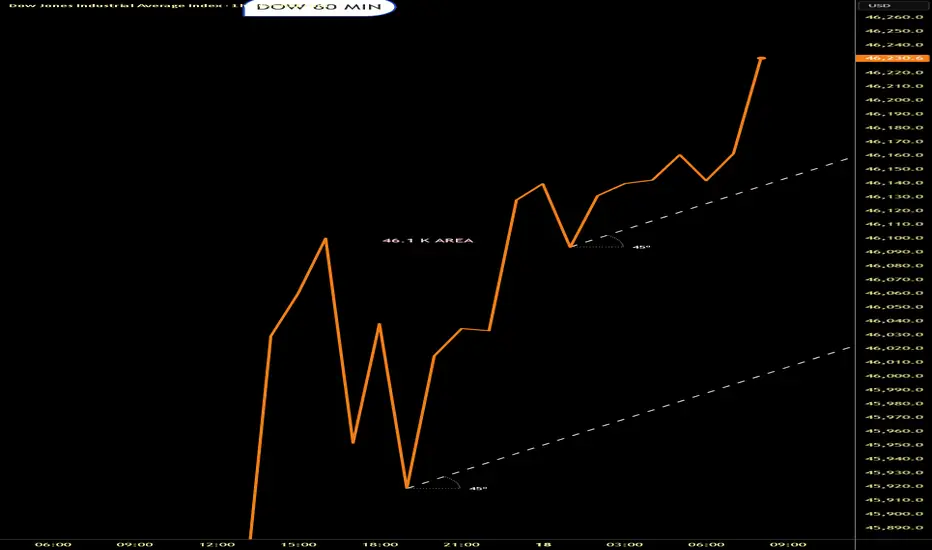
US30_push_46 625US30_push_46 625
this was something we noticed
lets see of the push to the 50% Q4 level, .. also just above a key level of 46 500, what some might call a mid-points
what we have seen is that the TRUMP markets favours the light blue lines / 50% q4'rs
lets see; how this plays.


Us30 Trade Set Up Sep 18 2025www.tradingview.com
Price has swept PDH and pushed down hard inverting 1h FVGs and creating a bearish 1h FVH so if price continues to make internal bearish structure i will look for sells down to PDH

DowJones Key Trading LevelsKey Support and Resistance Levels
Resistance Level 1: 46415
Resistance Level 2: 46640
Resistance Level 3: 46860
Support Level 1: 45800
Support Level 2: 45600
Support Level 3: 45360
This communication is for informational purposes only and should not be viewed as any form of recommendation as to a particular course of action or as investment advice. It is not intended as an offer or solicitation for the purchase or sale of any financial instrument or as an official confirmation of any transaction. Opinions, estimates and assumptions expressed herein are made as of the date of this communication and are subject to change without notice. This communication has been prepared based upon information, including market prices, data and other information, believed to be reliable; however, Trade Nation does not warrant its completeness or accuracy. All market prices and market data contained in or attached to this communication are indicative and subject to change without notice.
US30 ShortElite Analysis
All confirmations met
Executed late
Elite execution TOB marked by orange rectangle

US30 Price Consolidation a Top Resistance The Dow Jones (US30) is currently consolidating around the 45,900 support level as traders position ahead of the upcoming Federal Reserve rate decision later this week. but the real driver of volatility will be Chair Powell’s forward guidance—particularly his tone on
Technical View
A break and close above 46,500 could open the path toward 47,000–47,200, while failure to hold 45,900 risks a pullback toward 45,500.
You may find more details in the chart.
Trade wisely best of Luck.
Ps; Support with like and comments for better analysis Thanks for Supporting.

DOW/US30 - TIME FOR A KILLTeam, we have not been trading DOW/US30 since last week's successful short
WHY, we wait for the rate decision to come out
NOW, investors' hope is invalid, no momentum for a rate cut
LETs short the beast at 46135-46160
STOP LOSS AT 46250- OR 46280
EASY TARGET AT 46117-46070 - take partial 50-70% and bring stop loss to BE
2ND TARGET at 45972-45955
LETS GO

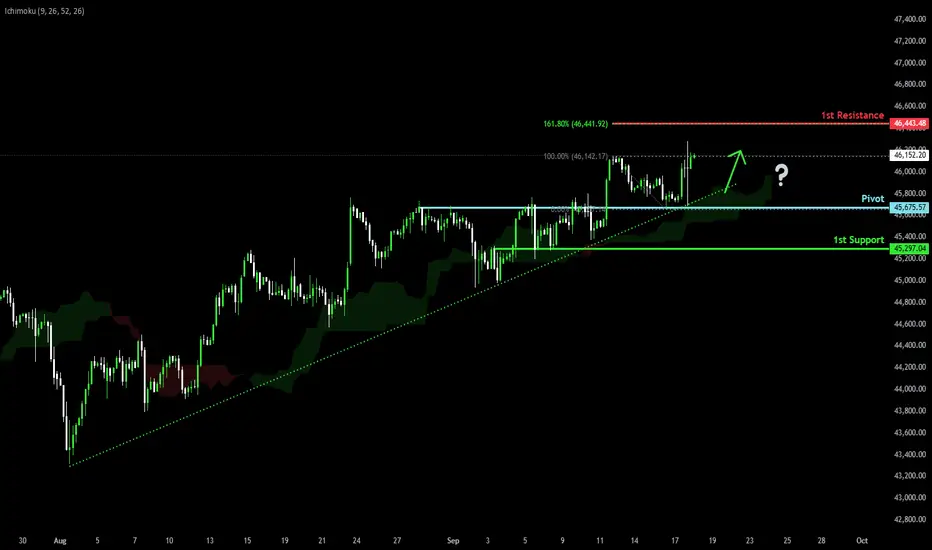
Bullish momentum to extend?Dow Jones (US30) has bounced off the pivot, which has been identified as a pullback support and could potentially rise to the 1st resistance which aligns with hte 161.8% Fibonacci extension.
Pivot: 45,675.57
1st Support: 45,297.04
1st Resistance: 46,443.48
Disclaimer:
The above opinions given constitute general market commentary, and do not constitute the opinion or advice of IC Markets or any form of personal or investment advice.
Any opinions, news, research, analyses, prices, other information, or links to third-party sites contained on this website are provided on an "as-is" basis, are intended only to be informative, is not an advice nor a recommendation, nor research, or a record of our trading prices, or an offer of, or solicitation for a transaction in any financial instrument and thus should not be treated as such. The information provided does not involve any specific investment objectives, financial situation and needs of any specific person who may receive it. Please be aware, that past performance is not a reliable indicator of future performance and/or results. Past Performance or Forward-looking scenarios based upon the reasonable beliefs of the third-party provider are not a guarantee of future performance. Actual results may differ materially from those anticipated in forward-looking or past performance statements. IC Markets makes no representation or warranty and assumes no liability as to the accuracy or completeness of the information provided, nor any loss arising from any investment based on a recommendation, forecast or any information supplied by any third-party.
Dow projections after yesterday's rate cutEverything is mentioned in chart.
This is my Elliott Wave breakdown of the Wave 5 cycle rally from my last year's projections.

Most probable scenario (Rates remain unchanged)Ever since my last year's downward correction projection on Dow, the market has been steadily going upward forming our wave 5.
For past couple weeks, I have been monitoring the Expanding Triangle forming in market ever since the major RSI drop in July downward swing, which was our wave C.
22 August was the day most people like me were expecting the drop in market which would have been our Wave E, but since the GDP news pumped the market turning an ABC zigzag into an Impulse with the 5th wave being the pump upon news release, the wave D was hence prolonged and we had to wait for another 5 wave structure to complete the wave D zig-zag as shown in the image below.
Now, we can see that even though wave D has traced more than 200% of wave B, it is still a valid Triangle. The ending diagonal further strengthens this scenario to play out.
Even though this scenario's success is dependent upon the news, which is impossible to predict. The price action so far we have seen along with the GDP and other news reports suggest that even though market is highly anticipating 25 basis points cut or even 50 basis points, the likelihood of Interest rates remaining unchanged is still very high because the US economy is still strong and does not necessarily require rate cuts yet.
After this wave E, we can enter our usual end of year pump.

US30 US30 is bullish.
Trading above last week’s open.
Momentum is pushing higher highs.
US30 is showing a bullish bias, trading comfortably above last week’s open. The market is forming higher highs and higher lows, indicating strong upward momentum. Pullbacks to key levels, like the current week open, may offer good entry opportunities in line with the trend.

Dow Jones: Market Ready for a New Upward ImpulseMarket Overview:
The Dow Jones Index is holding above the key support zone of 45,100–45,200, forming a bullish structure. After a consolidation phase, the index is showing signs of an upside breakout.
Technical Signals:
Fibonacci levels point to potential growth toward 46,100, 46,350, and 46,700.
EMA 144 supports the bullish scenario, staying below the current price.
AO indicator is turning positive, confirming strengthening bullish momentum.
Key Levels:
Support: 45,100 – 45,200
Resistance: 46,100 – 46,700
Scenario:
The main scenario remains bullish — if the index consolidates above 45,600, we expect growth toward 46,100–46,700. The alternative scenario is a breakdown below 45,100, which could lead to a move toward 44,800.

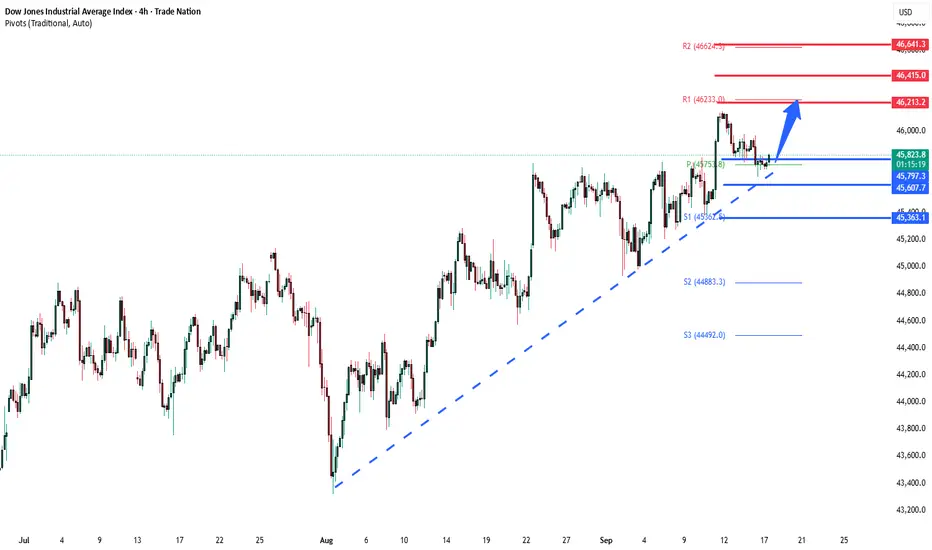
DowJones Key trading levels ahead of Fed rate decisionKey Support and Resistance Levels
Resistance Level 1: 46210
Resistance Level 2: 46415
Resistance Level 3: 46640
Support Level 1: 45800
Support Level 2: 45610
Support Level 3: 45360
This communication is for informational purposes only and should not be viewed as any form of recommendation as to a particular course of action or as investment advice. It is not intended as an offer or solicitation for the purchase or sale of any financial instrument or as an official confirmation of any transaction. Opinions, estimates and assumptions expressed herein are made as of the date of this communication and are subject to change without notice. This communication has been prepared based upon information, including market prices, data and other information, believed to be reliable; however, Trade Nation does not warrant its completeness or accuracy. All market prices and market data contained in or attached to this communication are indicative and subject to change without notice.
US30 LONG/BUY Hello there
Looks like a high probability trade is forming on US30
1. Regular flat formation
2. MACD divergence 1HR TF forming
3. 3 WAVE corrective structure
4. 61.8 FIB retracement of impulsive move
Strategy: Entry at 61.8 FIB retracement entry
Entry: Current Market Price/ 45641 (little gap left)
Stop Loss: 45391
Take Profit: 46300
Trade with care
God Bless you

US30 – Rejected at 46,145, Holding Above 45,700 SupportThe Dow Jones Index faced rejection near the 46,145 resistance and is now pulling back toward the 45,700 support zone. Price action here will determine whether buyers can sustain momentum or if sellers push lower.
Support at: 45,700 / 45,000 / 44,000 🔽
Resistance at: 46,145 🔼
🔎 Bias:
🔼 Bullish: Holding above 45,700 could lead to another retest of 46,145, with a breakout opening room for higher highs.
🔽 Bearish: A break below 45,700 would shift focus toward 45,000, and further weakness could target 44,000.
📛 Disclaimer: This is not financial advice. Trade at your own risk.

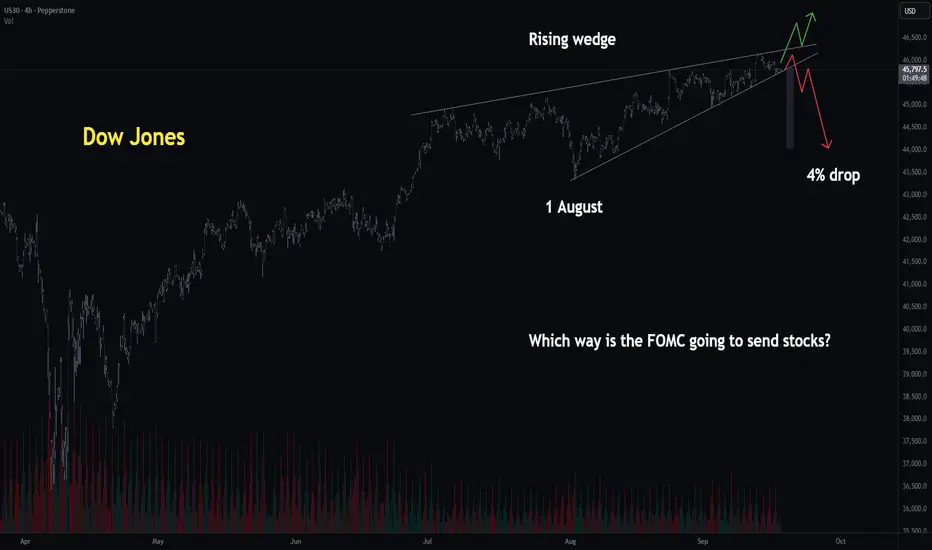
Dow Jones | H4 Rising Wedge | GTradingMethodHello everyone who reads this,
The big question on everyone’s mind: Which way will the FOMC interest rate decision send stocks and gold?
Here’s my two cents and how I plan to approach it.
🧐 Market Overview:
I’m seeing rising wedges on both the Dow Jones and the S&P500 across multiple timeframes. Rising wedges typically lean bearish.
Dow Jones: To play it safe, I’ll wait for a break + retest. If it breaks down, I’ll wait for the retest and then look to go short and vice a versa on the long side.
FOMC generally causes a lot of volatility and I don't want to get whipsawed around, hence I am taking a more conservative approach by trading the retest, which might only happen tomorrow.
S&P500: The hourly rising wedge has already broken to the downside. On the retest, I’ll be watching for short setups. If the retest holds, it would also confirm a double top, which adds further confluence.
If stocks break down on FOMC, expect BTC and alts to feel the pressure.
🙏 Thanks for checking out my post! It would be great to hear what your thoughts are about the interest rate decision and what trades you are looking at. Lets make money together!
📌 Please note: This is not financial advice. This content is to track my trading journey and for educational purposes only.
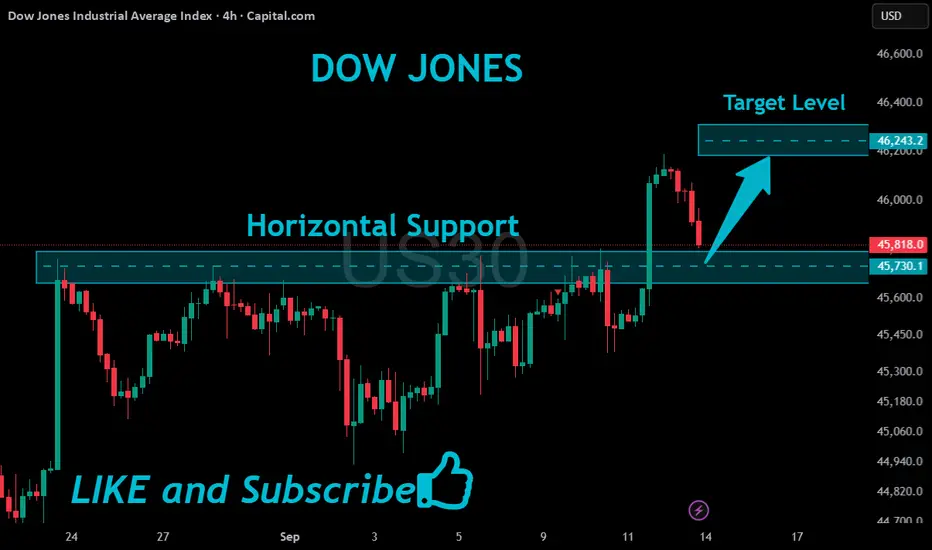
US30 In Support Below!
HI,Traders !
#US30 is trading in an
Uptrend and is
Now making a local bearish
Correction to retest the
Horizontal support below
Around 45730.1 from where
We will be expecting a
Further bullish move up !
Comment and subscribe to help us grow !
dowjones must goes to 46047Based on the analysis, Dow Jones has the potential to continue its upward movement from the 45,868 range. The price level of 45,809 serves as a warning zone for this decision.
If this area holds, the target could reach the peak of 46,100. CMCMARKETS:US30

DOW JONES (US30): Your Plan to Trade FOMC Today
US30 keeps coiling on a recently broken daily key resistance
that turned into a support after a breakout.
To buy the market with confirmation after today's rate decision,
concentrate your attention on a double bottom pattern on a 4H time frame.
A bullish breakout of its neckline and a 4H candle close above 46850
will provide a reliable signal.
A bullish continuation will be expected to a current structure high then - 46087.
❤️Please, support my work with like, thank you!❤️
I am part of Trade Nation's Influencer program and receive a monthly fee for using their TradingView charts in my analysis.

US30 Consolidates Ahead of Fed – Key Range 46,000 to 45,680US30 – Technical Overview
The Dow Jones continues to consolidate between 46,000 and 45,680 as traders await the Federal Reserve’s rate decision later this week.
Markets largely expect a 25 bps cut, but the key driver will be Chair Powell’s guidance on inflation, labor-market softness, and tariff risks—factors that could spark a breakout from the current range.
Technical Outlook
📉 Support test
Price remains inside a consolidation zone and is expected to retest 45,680 before attempting a rebound.
📈 Bullish continuation
A bounce from support could drive price back to 46,000, with a breakout above this level targeting 46,125.
A sustained move above 46,125 would open the path for a new ATH near 46,250 → 46,430, especially if the Fed signals a more dovish stance.
Key Levels
Pivot: 45,910
Resistance: 46,000 – 46,125 – 46,250
Support: 45,680 – 45,500
previous idea:

U30 Trade Set Up Sep 17 2025www.tradingview.com
price is trading in between PDH/PDL but just inverted a 1h FVG so will want to see if price can continue making internal bullish structure on the 5m-15m to target PDH or continue its 1h bearish structure and target PDL. But will have to be careful due to FOMC news coming out at 2pm
