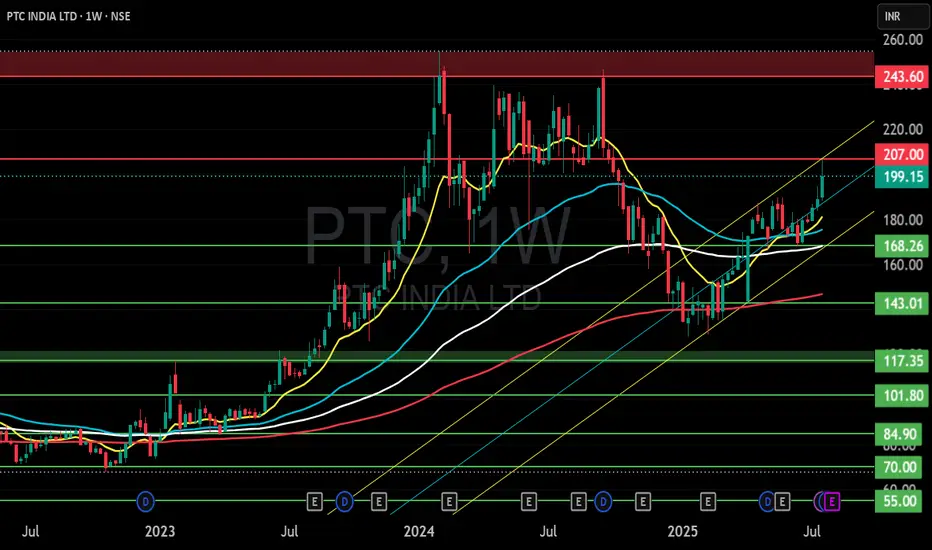
Bullish on PTC IndiaResults and EPS are good.
Chart has retested and bounced and then consolidating. Any bullish move above previous high will unlock journey till ATH and then multi year breakout should take it to 3 times the neckline which is around 150. I am thinking it might go till 450 in 3 years timeframe.
PTC India Limited
No trades
Next report date
—
Report period
—
EPS estimate
—
Revenue estimate
—
30.25 INR
9.00 B INR
156.01 B INR
231.98 M
About PTC India Limited
Sector
Industry
CEO
Manoj Kumar Jhawar
Website
Headquarters
New Delhi
Founded
1999
IPO date
Apr 7, 2004
Identifiers
2
ISIN INE877F01012
PTC India Ltd. is a holding company, which engages in the trading of electricity. It operates through the following segments: Power and Financing Business. The Power segment consists of trading and generation of power. The Financing Business segment focuses in the investment of equity, extending debt to power projects in generation, transmission, distribution, fuel resources and fuel related infrastructure. The company was founded on April 16, 1999 and is headquartered in New Delhi, India.
Related stocks

PTC INDIA LTD S/RSupport and Resistance Levels:
Support Levels: These are price points (green line/shade) where a downward trend may be halted due to a concentration of buying interest. Imagine them as a safety net where buyers step in, preventing further decline.
Resistance Levels: Conversely, resistance levels (re
PTC Elliott Wave Count | ₹337 in Sight if ₹200 Breaks ✅ Elliott Wave Count (Verified & Explained)
The chart presents a classic 5-wave impulsive Elliott Wave structure:
Wave 1: Initial rally, confirmed by a clear breakout.
Wave 2: Deep retracement to ~0.786 Fib (around ₹106.95) — valid corrective wave.
Wave 3: Strong rally to ₹318.15 — the longest wa

Edge of Breakout As we can see in the chart PTC making cup and handle pattern Also company is fundamentally good
Buy after closing 190
First Target should be 200
Second Target 240
-----------------------------------------
Disclaimer- Do your own analysis.

GO LONG ON - PTCOne is advised to Go long on PTC at current market price band of 155- 162. The Daily and Weekly charts have formed Lower Swing Lows. The RSI also indicated oversold condition on all Time Frame. Also the script has corrected almost 35% from the highs of 246.00. One is advised to go long PTC with SL

PTC INDIA LTDBreakout happend in this stock with rising 200dma and RS indicator is also showing strength.
Keep your risk and reward ratios according to your own preferance.
This is for educational purpose, do your own research before investing.

PTC Buy ..PTC gave a triangle breakout..probable a flag pendant...so tgt calculated and posted on the charts...PTC gives good annual divident too..

PTC India ltd - Investment IdeaSymmetrical Triangle formation. Breakout or breakdown
will show us direction. Still the company is good fundamentally.
Currently trading at support level which created good RR to go long.
Results were good still reaction needs to come.
For me personally targets are big on upside, this may test our

PTC India (Swing):PTC India (Swing):
PTC is on a nice setup.
Here the present position offers a trade with RR of more than 1:5.
PTC is also well set for a significant up move by breaking the all time high.
Appropriate supply and demand zones are highlighted.
Check out my earlier views for a better understanding.
No


See all ideas
Summarizing what the indicators are suggesting.
Neutral
SellBuy
Strong sellStrong buy
Strong sellSellNeutralBuyStrong buy
Neutral
SellBuy
Strong sellStrong buy
Strong sellSellNeutralBuyStrong buy
Neutral
SellBuy
Strong sellStrong buy
Strong sellSellNeutralBuyStrong buy
An aggregate view of professional's ratings.
Neutral
SellBuy
Strong sellStrong buy
Strong sellSellNeutralBuyStrong buy
Neutral
SellBuy
Strong sellStrong buy
Strong sellSellNeutralBuyStrong buy
Neutral
SellBuy
Strong sellStrong buy
Strong sellSellNeutralBuyStrong buy
Displays a symbol's price movements over previous years to identify recurring trends.
INRA
iShares Global Clean Energy Transition UCITS ETF Accum Shs USDWeight
0.12%
Market value
4.13 M
USD
LDEM
L&G Emerging Markets Quality Dividends Equal Weight UCITS ETFWeight
0.11%
Market value
46.78 K
USD
Explore more ETFs
Frequently Asked Questions
The current price of PTC is 172.41 INR — it has decreased by −1.46% in the past 24 hours. Watch PTC India Limited stock price performance more closely on the chart.
Depending on the exchange, the stock ticker may vary. For instance, on NSE exchange PTC India Limited stocks are traded under the ticker PTC.
PTC stock has risen by 9.68% compared to the previous week, the month change is a 8.31% rise, over the last year PTC India Limited has showed a 22.64% increase.
We've gathered analysts' opinions on PTC India Limited future price: according to them, PTC price has a max estimate of 210.00 INR and a min estimate of 210.00 INR. Watch PTC chart and read a more detailed PTC India Limited stock forecast: see what analysts think of PTC India Limited and suggest that you do with its stocks.
PTC stock is 2.82% volatile and has beta coefficient of 1.04. Track PTC India Limited stock price on the chart and check out the list of the most volatile stocks — is PTC India Limited there?
Today PTC India Limited has the market capitalization of 51.80 B, it has increased by 10.14% over the last week.
Yes, you can track PTC India Limited financials in yearly and quarterly reports right on TradingView.
PTC India Limited is going to release the next earnings report on Feb 16, 2026. Keep track of upcoming events with our Earnings Calendar.
PTC India Limited revenue for the last quarter amounts to 53.27 B INR, despite the estimated figure of 53.63 B INR. In the next quarter, revenue is expected to reach 34.27 B INR.
PTC net income for the last quarter is 1.91 B INR, while the quarter before that showed 1.95 B INR of net income which accounts for −1.98% change. Track more PTC India Limited financial stats to get the full picture.
PTC India Limited dividend yield was 7.16% in 2024, and payout ratio reached 38.47%. The year before the numbers were 4.20% and 48.42% correspondingly. See high-dividend stocks and find more opportunities for your portfolio.
As of Jan 30, 2026, the company has 540 employees. See our rating of the largest employees — is PTC India Limited on this list?
EBITDA measures a company's operating performance, its growth signifies an improvement in the efficiency of a company. PTC India Limited EBITDA is 9.65 B INR, and current EBITDA margin is 7.02%. See more stats in PTC India Limited financial statements.
Like other stocks, PTC shares are traded on stock exchanges, e.g. Nasdaq, Nyse, Euronext, and the easiest way to buy them is through an online stock broker. To do this, you need to open an account and follow a broker's procedures, then start trading. You can trade PTC India Limited stock right from TradingView charts — choose your broker and connect to your account.
Investing in stocks requires a comprehensive research: you should carefully study all the available data, e.g. company's financials, related news, and its technical analysis. So PTC India Limited technincal analysis shows the buy rating today, and its 1 week rating is strong buy. Since market conditions are prone to changes, it's worth looking a bit further into the future — according to the 1 month rating PTC India Limited stock shows the neutral signal. See more of PTC India Limited technicals for a more comprehensive analysis.
If you're still not sure, try looking for inspiration in our curated watchlists.
If you're still not sure, try looking for inspiration in our curated watchlists.