Hyperliquid Shorthigh confluence high probability short with decent R/R : % success ratio. coming back to test the 20sma on the daily :)
Key stats
Related pairs

Don't fight the HYPE train!The James Wynn saga was wonderful advertising for the platform.
(Maybe it was staged).
Either way #Hyperliquid goes higher.
LONG HYPEI took a position in HYPE this morning. The chart speaks for it self, it's respected levels and looks like it wants to go into price discovery. The fundamentals on this name are pretty fascinating, and i see a world where this is the Robinhood of crypto. I wouldn't even be surprised if HOOD acts as

HYPE/USD – Momentum Recovery Above 200-SMA🟢 Bias: Long-leaning (momentum buildup)
HYPE trades at $43.16, comfortably above SMA200 ($39.08). RSI ≈50, momentum steady after pullback.
Bullish trigger: reclaim $45 for a move toward $48–$50.
Bearish invalidation: daily close < $41 puts focus back on $38.

HYPE seeking demand liquidity around $30 on the 4HThis 4-hour chart for HYPEUSD (Hyperliquid) showcases a technical setup with a clear top-down analysis, including higher time frame Fibonacci retracement levels, key support/resistance zones, pattern formations, and oscillator signals to support a potential trade idea.
Technical Structure
Trend Ove

HYPE/USD – Short-Term Bounce, Trend Still Soft📉 Bias: SHORT-to-NEUTRAL (corrective bounce)
Hyperliquid trades near $36.60, recovering from $35.41 support but still capped below the SMA200 ($37.65). RSI reads ~60, hinting at short-term rebound strength, though macro momentum remains soft.
Upside faces pressure around $37.60–$38.00, while a bre

HYPE/USD – Momentum Fading Near $39.00📈 Bias: NEUTRAL-to-LONG (healthy pullback after run-up)
Hyperliquid trades around $38.04, easing after strong gains toward $39.18 resistance. RSI at 42 shows a cooling phase, while price still holds above the SMA200 ($37.05).
Buyers maintain structural control if $37.00 holds — reclaiming $38.80–$

hyperliquid LONGHyperliquid has been consolidating in a rising wedge.
Fundamentals are bullish. Team selling is overblown.
Price may go up

HYPERLIQUID This is its last chance to rebound.Hyperliquid (HYPEUSD) has been trading within a 4-month Channel Up and today made contact with its 1W MA20 for the first time since May 06. With the 1D MA100 (green trend-line) broken also yesterday, this is the token's last chance to find Support as it sits at the bottom of the pattern.
If it hold

$HYPE ≈ $KAS playbook. Both were bear market winners that captured mindshare and cult followings. A fair ethos builds, with no VC, a clear vision, effective execution, and the goal of dominating their niche.
If you want a 2025 proxy for HYPE, 2023 KAS is the cleanest comp.

See all ideas
Displays a symbol's price movements over previous years to identify recurring trends.
Frequently Asked Questions
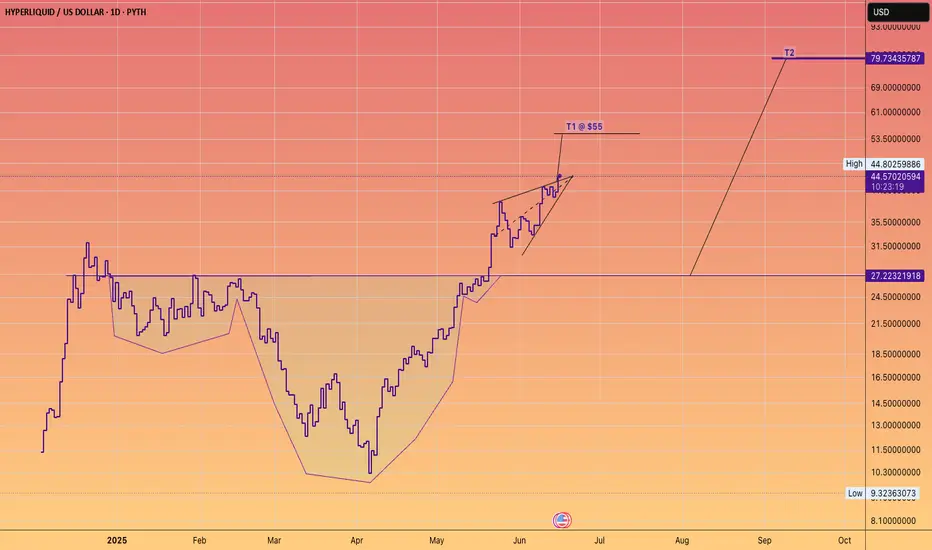
HYPERLIQUID (HYPE) reached its highest price on Sep 18, 2025 — it amounted to 59.39377360 USD. Find more insights on the HYPE price chart.
See the list of crypto gainers and choose what best fits your strategy.
See the list of crypto gainers and choose what best fits your strategy.
HYPERLIQUID (HYPE) reached the lowest price of 9.32363073 USD on Apr 7, 2025. View more HYPERLIQUID dynamics on the price chart.
See the list of crypto losers to find unexpected opportunities.
See the list of crypto losers to find unexpected opportunities.
The safest choice when buying HYPE is to go to a well-known crypto exchange. Some of the popular names are Binance, Coinbase, Kraken. But you'll have to find a reliable broker and create an account first. You can trade HYPE right from TradingView charts — just choose a broker and connect to your account.
You can discuss HYPERLIQUID (HYPE) with other users in our public chats, Minds or in the comments to Ideas.