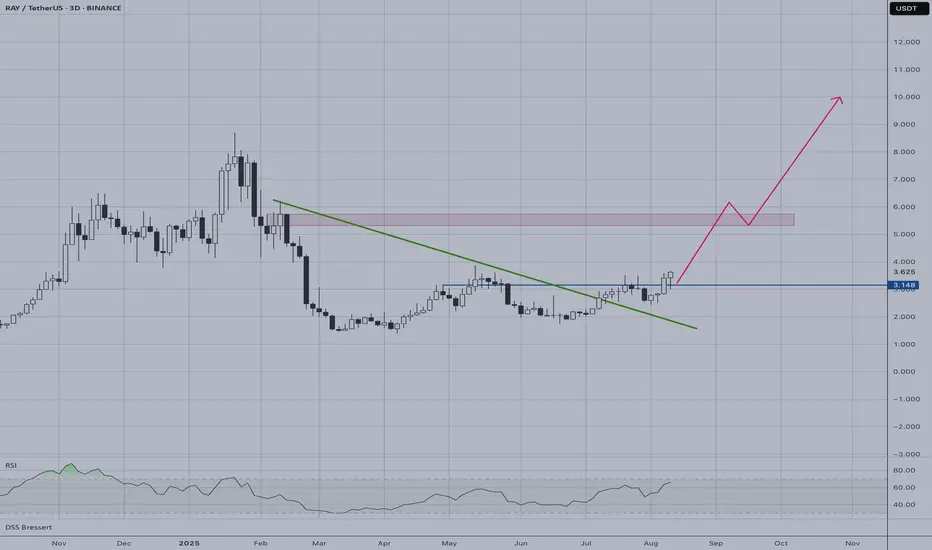
Raydium lifting away form horizontal support RAY is in a nice uptrend that appears to be a retracement. With that said, an impulsive move attempt from the bears should be considered. Keep in mind, it could lead to a swing failure. Regardless, any dips are for accumulating as long as horizontal support is respected.
Related pairs

RAYUSDT UPDATE#RAY
UPDATE
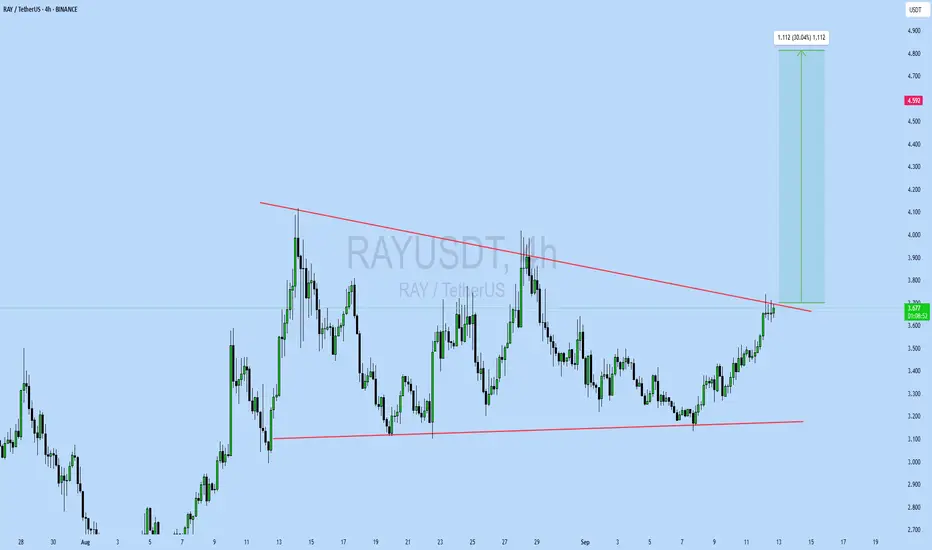
RAY Technical Setup
Pattern : Bullish Falling Wedge Breakout
Current Price: $3.68
Target Price: $4.59
Target % Gain: 30.04%
Technical Analysis: RAY has broken its falling wedge resistance on the 4H chart, showing bullish momentum and continuation potential. The breakout is backed by
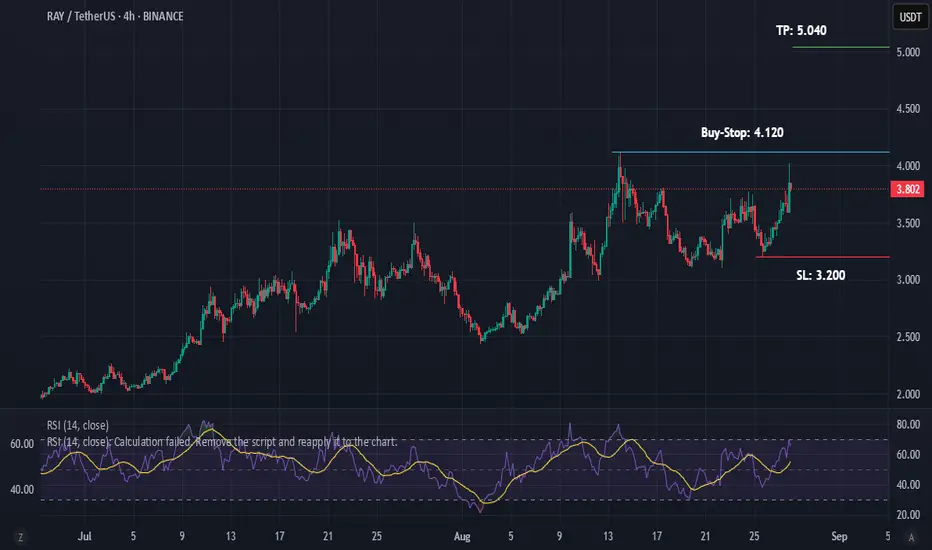
RAY/USDT Buy-Stop on 4H, No Bearish DivergenceThe price is range-bound, but once it gives a breakout, it could print new HHs and HLs.
No sign of Bearish Divergence on 4H timeframe.
Looks like a safe 1:1 Trade.
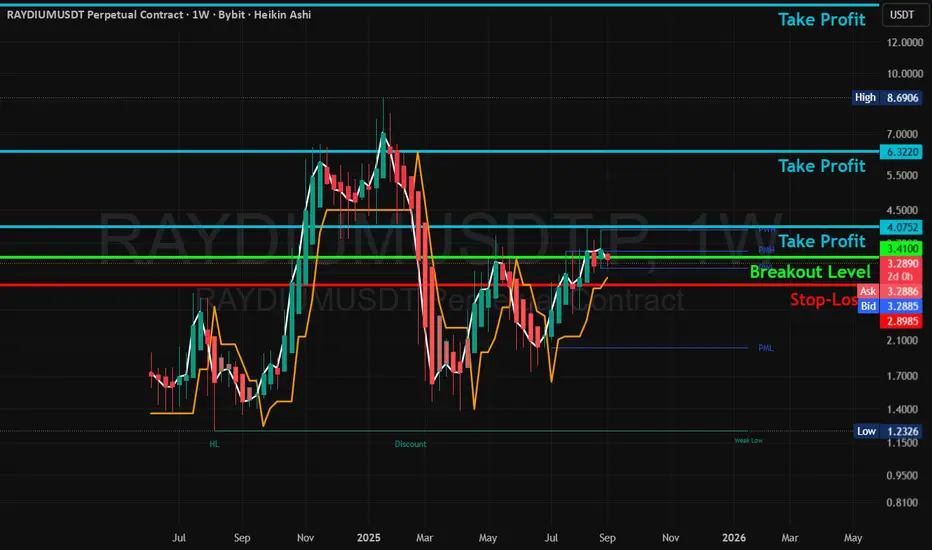
RAY/USDT (1W) — Weekly Breakout > 3.41 → 4.08 / 6.32 / 8.69 (SL Idea / Thesis
RAY is pressing into a multi-week resistance shelf after carving a higher-low structure on the weekly Heikin-Ashi chart. A clean weekly close above 3.41 (breakout line) would confirm continuation and invite a run on resting liquidity at prior highs. Failure to hold above that level ris

RAY Breakout Alert! NASDAQ:RAY Breakout Alert! 🚨
NASDAQ:RAY is currently testing the red resistance zone 🔴
If price breaks out, the first target will be the green line level 🎯
A confirmed breakout would signal bullish continuation and could push price higher ✅

RAY : razor edgeHello friends
Given the price growth we had, the price is now in a triangle, which is now in an important area in the triangle. If the price is supported and our triangle is broken, it can move to the identified resistance areas, which are price pivots.
But if the support breaks and the price fall

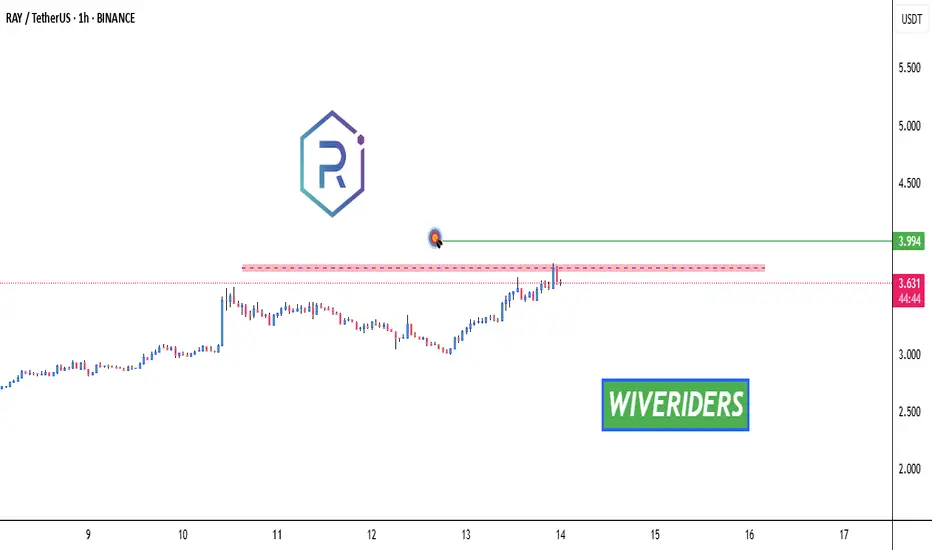
RAY Breakout Watch – Testing Red Resistance! 🚨 RAY Breakout Watch – Testing Red Resistance! 🔴⏳
RAY is currently testing the red resistance zone.
📊 If breakout confirms, the next move could target:
🎯 First Target → Green line level
A successful breakout could trigger bullish continuation.
RAY | Rocket Ready to LaunchRAY appears primed for a potential rocket launch, having broken above a major descending trendline that has been suppressing price action since early 2025. The breakout is accompanied by strong bullish momentum and the RSI showing renewed strength after months of consolidation.
Key Technical Signa
Buy Trade Strategy for RAY: Fueling Solana DeFi and LiquidityDescription:
This trading idea is centered on RAY, the native token of Raydium, a leading automated market maker (AMM) and liquidity provider built on the Solana blockchain. RAY powers a platform that offers lightning-fast trades, deep liquidity pools, and seamless integration with the wider Solana

See all ideas
Summarizing what the indicators are suggesting.
Oscillators
Neutral
SellBuy
Strong sellStrong buy
Strong sellSellNeutralBuyStrong buy
Oscillators
Neutral
SellBuy
Strong sellStrong buy
Strong sellSellNeutralBuyStrong buy
Summary
Neutral
SellBuy
Strong sellStrong buy
Strong sellSellNeutralBuyStrong buy
Summary
Neutral
SellBuy
Strong sellStrong buy
Strong sellSellNeutralBuyStrong buy
Summary
Neutral
SellBuy
Strong sellStrong buy
Strong sellSellNeutralBuyStrong buy
Moving Averages
Neutral
SellBuy
Strong sellStrong buy
Strong sellSellNeutralBuyStrong buy
Moving Averages
Neutral
SellBuy
Strong sellStrong buy
Strong sellSellNeutralBuyStrong buy
Displays a symbol's price movements over previous years to identify recurring trends.
Frequently Asked Questions
The current price of Raydium / Tether SPOT (RAY) is 2.941 USDT — it has risen 0.30% in the past 24 hours. Try placing this info into the context by checking out what coins are also gaining and losing at the moment and seeing RAY price chart.
Raydium / Tether SPOT price has risen by 11.38% over the last week, its month performance shows a −7.21% decrease, and as for the last year, Raydium / Tether SPOT has increased by 62.09%. See more dynamics on RAY price chart.
Keep track of coins' changes with our Crypto Coins Heatmap.
Keep track of coins' changes with our Crypto Coins Heatmap.
Raydium / Tether SPOT (RAY) reached its highest price on Jan 23, 2025 — it amounted to 8.678 USDT. Find more insights on the RAY price chart.
See the list of crypto gainers and choose what best fits your strategy.
See the list of crypto gainers and choose what best fits your strategy.
Raydium / Tether SPOT (RAY) reached the lowest price of 0.133 USDT on Dec 29, 2022. View more Raydium / Tether SPOT dynamics on the price chart.
See the list of crypto losers to find unexpected opportunities.
See the list of crypto losers to find unexpected opportunities.
The safest choice when buying RAY is to go to a well-known crypto exchange. Some of the popular names are Binance, Coinbase, Kraken. But you'll have to find a reliable broker and create an account first. You can trade RAY right from TradingView charts — just choose a broker and connect to your account.
Crypto markets are famous for their volatility, so one should study all the available stats before adding crypto assets to their portfolio. Very often it's technical analysis that comes in handy. We prepared technical ratings for Raydium / Tether SPOT (RAY): today its technical analysis shows the neutral signal, and according to the 1 week rating RAY shows the neutral signal. And you'd better dig deeper and study 1 month rating too — it's buy. Find inspiration in Raydium / Tether SPOT trading ideas and keep track of what's moving crypto markets with our crypto news feed.
Raydium / Tether SPOT (RAY) is just as reliable as any other crypto asset — this corner of the world market is highly volatile. Today, for instance, Raydium / Tether SPOT is estimated as 2.46% volatile. The only thing it means is that you must prepare and examine all available information before making a decision. And if you're not sure about Raydium / Tether SPOT, you can find more inspiration in our curated watchlists.
You can discuss Raydium / Tether SPOT (RAY) with other users in our public chats, Minds or in the comments to Ideas.