Sandbox (SAND): Expecting Breakout From 200EMASAND is again pushing into the breakout zone that has been rejecting price for months. This time, momentum looks better as buyers are holding higher lows and slowly pressing against EMAs. If we get a proper breakout here, that’s where the shift starts — continuation toward the $0.50 zone comes next.
Related pairs
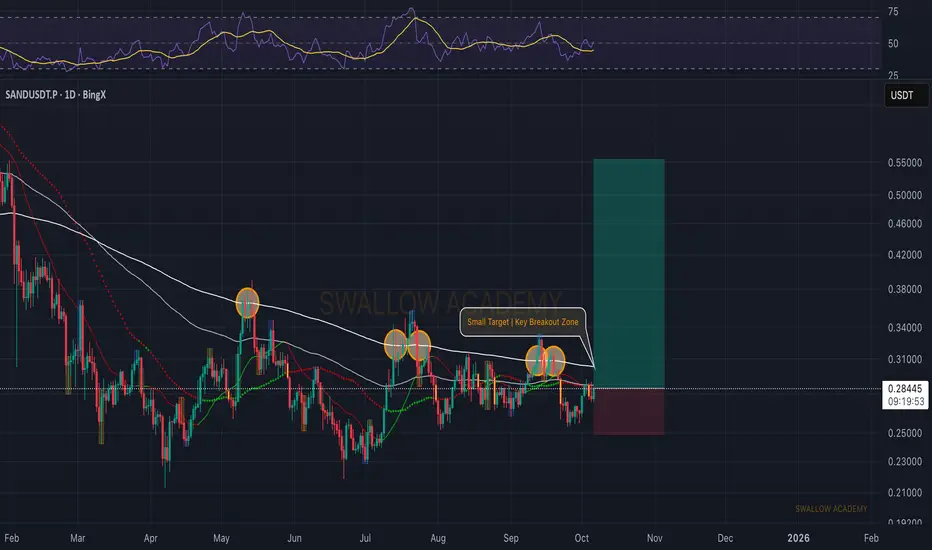
Sandbox (SAND): Looking For Break of 200EMASandbox has been in a downtrend for quite some time, and currently we are looking for proper upward movement, which could give us a decent switch in trend and an opportunity for long positions.
So as of now we have to wait and once we get that last confirmation of breakout, then we will be looking

SAND is Ready for 130% + Up Move SAND is making a Triangle pattern at Support zone and It is Ready for Breakout from that pattern . and at the same time Altcoin Season Index is at 74 , when it is >75 it is sign of very bullish in altcoins and Breakouts will have very high potential to give a big move .
and at the same time Bitcoin

SANDUSDT.P stuck in $0.26–0.35 range — breakout soon?Introduction: SAND is coiling in a tight $0.30–0.33 box; reaction will set next swing.
Trend: Higher lows since $0.27, rising into supply.
Levels: Resist $0.33, ATH targets $0.35–0.38; support $0.30, then $0.292/$0.275.
Pattern: Range box; break/close outside decides.
Indicators: Price above EMAs;

Sand Short to 0.23$Sand Short to 0.2308
Enter 0.345
SL 0.3609
TP 0.23
Sand will retest Symmetrical Triangle's top.
SL would have manually in case of wick above the top
Low leverage can enter now

SANDUSDT UPDATE#SAND
Update
SAND Technical Setup
Pattern: Falling Wedge Pattern
Current Price: $0.280
Target Price: $0.38
Target % Gain: 40.33%
Technical Analysis: SAND is trading inside a long-term falling wedge on the daily chart, showing signs of accumulation at the lower trendline. A recent bounce highl

BIG PUMP COMING ON SAND!SAND is looking like a classic market cycle, ready for a strong recovery and bull run. I expect a significant pump on this coin soon. This is a prime opportunity to buy at these levels.
A huge vertical move is coming—mark my words.
As always, stay profitable.
Dalin Anderson


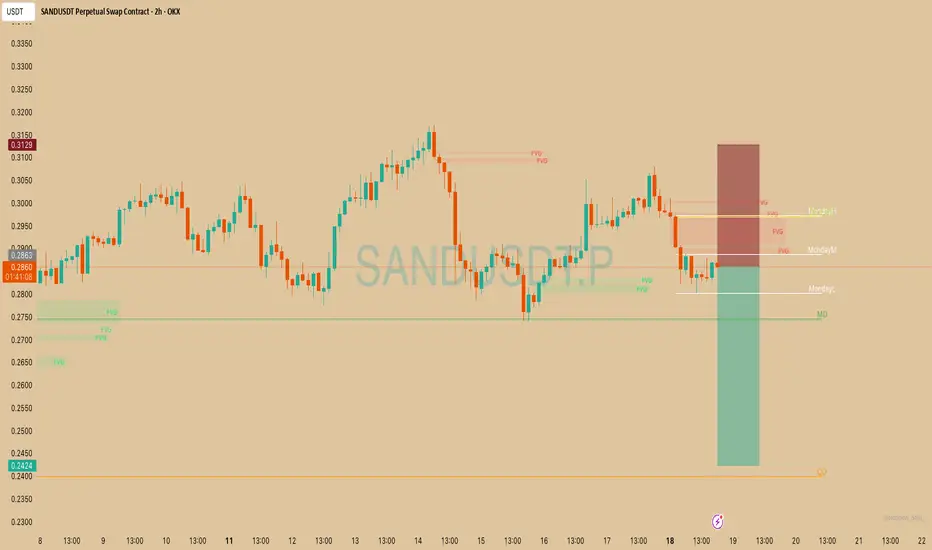
SAND SHORT SETUP1. Trade Direction: Short
The trader is betting on price going down.
The red box marks the stop-loss zone above, and the green box shows the take-profit zone below.
2. Key Levels on Chart
Monday High (MondayH), Monday Mid (MondayM), Monday Low (MondayL)
→ Weekly reference points used for intraday/we
SAND Breakout Alert!🚨 SAND Breakout Alert! 🚨
SAND is currently testing the red resistance zone 🔴
If price breaks out, the first target will be the green line level 🎯
A confirmed breakout here would signal bullish continuation and could push price higher ✅

See all ideas
Summarizing what the indicators are suggesting.
Oscillators
Neutral
SellBuy
Strong sellStrong buy
Strong sellSellNeutralBuyStrong buy
Oscillators
Neutral
SellBuy
Strong sellStrong buy
Strong sellSellNeutralBuyStrong buy
Summary
Neutral
SellBuy
Strong sellStrong buy
Strong sellSellNeutralBuyStrong buy
Summary
Neutral
SellBuy
Strong sellStrong buy
Strong sellSellNeutralBuyStrong buy
Summary
Neutral
SellBuy
Strong sellStrong buy
Strong sellSellNeutralBuyStrong buy
Moving Averages
Neutral
SellBuy
Strong sellStrong buy
Strong sellSellNeutralBuyStrong buy
Moving Averages
Neutral
SellBuy
Strong sellStrong buy
Strong sellSellNeutralBuyStrong buy
Displays a symbol's price movements over previous years to identify recurring trends.
Frequently Asked Questions
The current price of SAND3xLong/Tether (SAND) is 0.02846 USDT — it has fallen −16.52% in the past 24 hours. Try placing this info into the context by checking out what coins are also gaining and losing at the moment and seeing SAND price chart.
SAND3xLong/Tether price has risen by 0.31% over the last week, its month performance shows a −20.17% decrease, and as for the last year, SAND3xLong/Tether has decreased by −88.31%. See more dynamics on SAND price chart.
Keep track of coins' changes with our Crypto Coins Heatmap.
Keep track of coins' changes with our Crypto Coins Heatmap.
SAND3xLong/Tether (SAND) reached its highest price on Nov 25, 2021 — it amounted to 27.96720 USDT. Find more insights on the SAND price chart.
See the list of crypto gainers and choose what best fits your strategy.
See the list of crypto gainers and choose what best fits your strategy.
SAND3xLong/Tether (SAND) reached the lowest price of 0.00330 USDT on Jul 5, 2024. View more SAND3xLong/Tether dynamics on the price chart.
See the list of crypto losers to find unexpected opportunities.
See the list of crypto losers to find unexpected opportunities.
The safest choice when buying SAND is to go to a well-known crypto exchange. Some of the popular names are Binance, Coinbase, Kraken. But you'll have to find a reliable broker and create an account first. You can trade SAND right from TradingView charts — just choose a broker and connect to your account.
Crypto markets are famous for their volatility, so one should study all the available stats before adding crypto assets to their portfolio. Very often it's technical analysis that comes in handy. We prepared technical ratings for SAND3xLong/Tether (SAND): today its technical analysis shows the sell signal, and according to the 1 week rating SAND shows the sell signal. And you'd better dig deeper and study 1 month rating too — it's sell. Find inspiration in SAND3xLong/Tether trading ideas and keep track of what's moving crypto markets with our crypto news feed.
SAND3xLong/Tether (SAND) is just as reliable as any other crypto asset — this corner of the world market is highly volatile. Today, for instance, SAND3xLong/Tether is estimated as 8.14% volatile. The only thing it means is that you must prepare and examine all available information before making a decision. And if you're not sure about SAND3xLong/Tether, you can find more inspiration in our curated watchlists.
You can discuss SAND3xLong/Tether (SAND) with other users in our public chats, Minds or in the comments to Ideas.