#SEIUSDT#SEI
The price is moving within a descending channel on the 1-hour frame and is expected to break and continue upward.
We have a trend to stabilize above the 100 moving average once again.
We have a bearish trend on the RSI indicator that supports the upward break.
We have a support area at the lower boundary of the channel at 0.2700, acting as strong support from which the price can rebound.
We have a major support area in green that pushed the price upward at 0.02750.
Entry price: 0.2963.
First target: 0.3050.
Second target: 0.3161.
Third target: 0.3317.
To manage risk, don't forget stop loss and capital management.
When you reach the first target, save some profits and then change your stop order to an entry order.
For inquiries, please comment.
Thank you.
SEIUSDT.3S trade ideas


SEI/USDT | Falling Wedge Breakout With 30% Upside PotentialSEI/USDT is breaking out of a falling wedge on the daily timeframe after 31 days of downtrend consolidation, right above the key $0.27–0.29 support zone and the 100 EMA. with a potential target around $0.379 (+30%).
Short-term resistance sits near $0.32 and $0.35, areas to watch for possible profit-taking before continuation.
As long as price holds above $0.266, the setup remains valid.
#SEI #SEIUSDT #Crypto #Altcoins

SEI - Bullish pennant daily & H4NYSE:SEI - Bullish pennant H4 playing well 📈
Upper monthly levels:
0.3700 - 0.380$
0.450 - 0.4600$
0.660 - 0.670$
TP2 hit already ✅
Patience, is key.

SEI USDT HAS BROKEN OUTSEI USDT looks super bullish as it recently broke out from the 1D downtrend.
If it sustains and closes bullish, a move of almost 120-150% is on the table.

Bullish narrative and tradable structureSEI is at an important inflection point. Either it will break structure or change character. Regardless, what matters most is risk/reward.

Bearish setup on SEI!🚀 As you know, I'm very bullish on NYSE:SEI !
→ AUG 28: BREAKING - 21Shares files S-1 with the SEC for a SEI ETF📈
→On-chain volume is exploding, growth is exponential!📈
→Clean falling wedge structure forming on H4📈
→Daily Ichimoku retest area in play✅
Adoption is coming = More revenues, more investment, more devs → price up! 🚀
🧠 Not financial advice, just sharing my research so you can make informed bets!I do the digging, you make the decision.
Key setup: Valid > $0.2650 on daily close.

sei pump incomingI believe it will be a good rally... It looks so great on the daily chart... I'm spot long and expecting $0.4 +.

SEI/USDT — Critical Support Retest at Fibonacci Golden PocketCurrently, SEI/USDT is trading at a highly critical zone — the Golden Pocket (Fib 0.5–0.618) around 0.2785 – 0.2520, which also aligns with a major historical demand area. This zone is not just a technical level, but a true balance point between buyers and sellers that will likely determine the mid-to-long term trend.
---
🔎 Market Structure & Pattern
After reaching the 1.1450 high, SEI entered a prolonged correction phase.
A strong rebound from 0.13 brought price back into higher levels, but now SEI is retesting the accumulation zone (Golden Pocket).
This setup can be read in two ways:
A bullish continuation retest if demand holds, or
A distribution before breakdown if price fails to defend this pocket.
---
📈 Bullish Scenario
1. Price holds within the Golden Pocket (0.2785 – 0.2520).
2. Bullish reversal candlestick patterns appear (engulfing, hammer, or a higher low).
3. Confirmation comes with a breakout & 2D close above 0.3521.
4. Upside targets:
TP1: 0.3521 (minor resistance)
TP2: 0.4715 (strong resistance)
TP3: 0.5936 – 0.7025 (major resistance zone)
5. If momentum accelerates → potential extension to 0.93 – 1.13.
---
📉 Bearish Scenario
1. If price breaks below 0.2520 (Fib 61.8%) with a strong 2D close.
2. Breakdown triggers downside continuation toward:
Support 1: 0.2100
Support 2: 0.1300 (previous macro low).
3. A heavy-volume break of the 0.618 Fib often accelerates selling pressure and deepens the downtrend.
---
🧠 Trading Insight & Strategy
Aggressive Long Setup:
Entry: 0.255 – 0.275 (Golden Pocket)
Stop: below 0.240
Target: 0.3521 → 0.4715
Risk/Reward ≈ 2.5–3:1
Conservative Long Setup:
Wait for breakout above 0.3521, then enter on retest → safer confirmation for mid-term targets up to 0.59+.
Short Setup:
If rejection occurs at 0.3521, or breakdown confirmed below 0.2520, aim for 0.21 → 0.13.
---
📌 Conclusion
SEI/USDT is currently at a make-or-break zone.
Holding above the Golden Pocket could mark the beginning of a new bullish trend, with layered targets up to nearly 1 USDT.
But if this zone fails, downside continuation to 0.21 or even 0.13 becomes highly probable.
📍 In short: The Golden Pocket is the equilibrium zone that will decide SEI’s next major move.
#SEI #SEIUSDT #Crypto #Altcoin #TechnicalAnalysis #Fibonacci #SupportResistance #CryptoTrading #ChartAnalysis #PriceAction

SEIUSDT LONG 1DBullish Trend
Entry on Trendline
Expecting bullish trend will continue
AB==CD extra confirmation

$SEI Coiling Tight – Ready for the Next Leg?SEI is holding a strong structure after breaking above a key resistance zone, which has now flipped into support. This level is acting as a solid base for bulls, and the ascending support line adds confluence with higher lows.
As long as this structure holds, the bias remains bullish. A clean breakout above the descending trendline could trigger the next leg up, for now, price is coiling between support and resistance.
DYOR, NFA

SEI/USDT – Head & Shoulders Pattern Targeting $0.20🧠 SEI/USDT Technical Analysis – Daily Chart
✅ Pattern Formation
A clear Head & Shoulders pattern has formed on the daily chart:
Left Shoulder: around $0.32 – $0.33
Head: peak near ~$0.37 – $0.38
Right Shoulder: around $0.32 – $0.33
Neckline: positioned at ~$0.28 – $0.29 (current price zone).
This setup is a bearish reversal pattern if the neckline is broken with a daily close.
🎯 Target Projections
Distance from Head to Neckline ≈ $0.09 – $0.10
Breakdown target = ~$0.19 – $0.20 (aligned with previous demand zone).
Support Levels to Watch:
$0.25 – $0.24 (intermediate support)
$0.20 (major target from H&S)
If broken, potential extension toward $0.18
📈 Alternative Bullish Scenario
If SEI rebounds quickly, holding the ascending trendline and reclaiming $0.32 – $0.33, the H&S pattern would be invalidated.
In that case, a retest of $0.36 – $0.38 resistance becomes likely.
📊 Indicators
MACD: Bearish crossover below zero, confirming weakness.
EMA200 (Yellow): Price trading below it → downside pressure remains.
⚠️ Disclaimer
This analysis is for educational and technical purposes only and does not constitute financial or investment advice.
SEI : LIVE TRADEHello friends
We drew a Fibonacci to get the support area and a Fibonacci for the resistance areas.
Now using support and resistance we can understand where the buy and sell points are.
In this price growth we wait for a pullback and in case of a pullback we can enter a trade in the specified area with risk and capital management and move with it until the specified resistances which are targets.
*Trade safely with us*

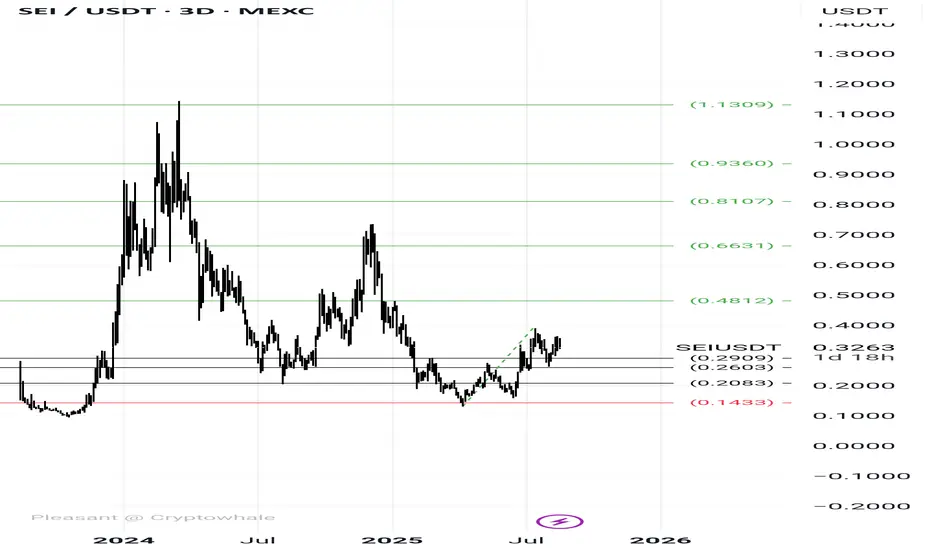
SEI Coin is forming a Falling Wedge Pattern on the 3D Chart🔥SEI Coin is forming a Falling Wedge Pattern on the 3D Chart. 🕯
▶️ The market price is currently at 0.3090 and there is a possibility of a decline from there. The price may fall to 0.2986 or 0.2485. 🔽🔽
A rise in price is expected from these two points, which will complete the target as below 🔼🔼
💵 Tp 1 : $ 0.3565
💵 Tp 2 : $ 0.4930
💵 Tp 3 : $ 0.7210
💵 Tp 4 : $ 0.8980
💵 Tp 5 : $ 1.1102

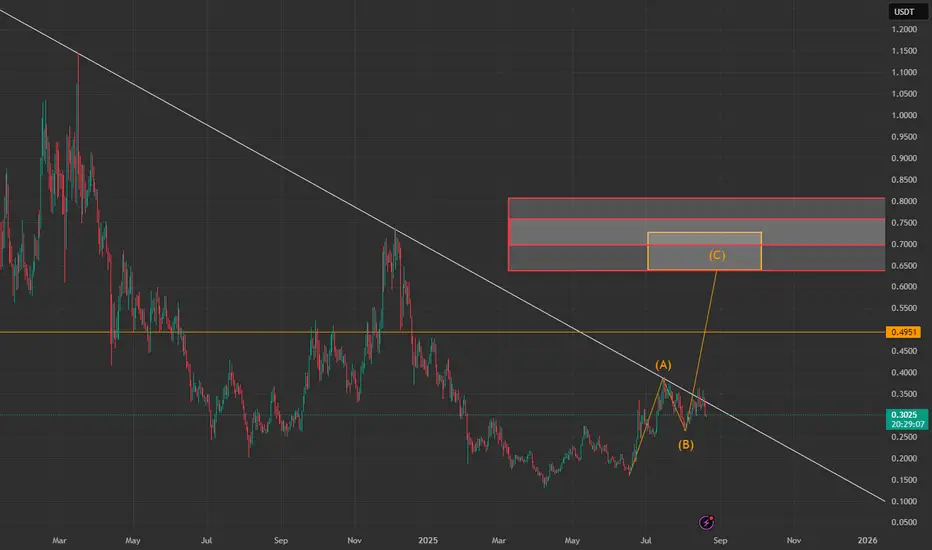
Sei spot plan 📉 Picked up NYSE:SEI at 0.22 and rode it for a +60% move 🚀
But this looks like just a corrective wave (B) in play.
I’m now patiently waiting for wave C to complete in the “area of opportunity” before looking for the next bigger move.
Elliott Wave structure still unfolding – discipline over FOMO. 🧠📊

Sei updateSei moved nicely from our buying almost above 10 percent book some and hold to the moon with sl at entry

SEIUSDT - High Reward set-upHi all!
SEIUSDT is showing a potential high-reward, low-risk bullish setup. A harmonic pattern is forming, aligning with key confluences on the higher timeframes.
📌 Key Levels to Watch:
0.3000 → Wait for lower timeframe acceptance here before considering long entries.
0.3400 – 0.3500 → First major resistance zone. This area overlaps with a potential bearish harmonic PRZ. If open interest turns bearish, divergences appear, or sentiment shifts, this zone could act as strong resistance.
0.4250 → If 0.3500 is broken with momentum, continuation towards this level is likely.
⚠️ Game Plan:
Look for confirmation around 0.3000 before entering long.
Manage risk closely near 0.3400 – 0.3500.
A breakout above 0.3500 could open the path towards 0.4250.

SEi Bulish Make Wave A-B i think Will Make CSEi Bulish Make Wave A-B i think Will Make CTarget c
0.49
0.52
0.55
0.58
0.63
SEIUSDT Forming Bullish MomentumSEIUSDT is currently trading within a strong ascending support channel, showing signs of a potential bullish breakout. The price action is coiling just below a key resistance zone, as highlighted on the chart, which reflects a strong consolidation phase. This setup often leads to an explosive move once price breaches the upper resistance. With consistent higher lows and good trading volume, the technical structure suggests bullish momentum is building up for a breakout that could push the price significantly higher.
The zone around \$0.36–\$0.38 appears to be a strong supply area that has rejected price multiple times in recent weeks. However, the repeated tests of this level are weakening its resistance. A confirmed breakout and retest of this zone could trigger the next leg up, potentially delivering a projected gain of 40% to 50% from current levels. The volume profile supports this bullish bias, as steady accumulation can be seen during price dips.
SEI is also gaining popularity across crypto communities, as more investors are taking interest in its ecosystem and long-term potential. From a trading perspective, the structure reflects strength, and the bullish breakout pattern aligns well with broader market recovery narratives. This combination of technical and community support may drive SEIUSDT toward a strong bullish rally in the near term.
✅ Show your support by hitting the like button and
✅ Leaving a comment below! (What is You opinion about this Coin)
Your feedback and engagement keep me inspired to share more insightful market analysis with you!

#SEI/USDT continues to grow !#SEI
The price is moving within an ascending channel on the 1-hour frame, adhering well to it, and is on its way to breaking strongly upwards and retesting it.
We have support from the lower boundary of the ascending channel, at 0.3080.
We have a downtrend on the RSI indicator that is about to break and retest, supporting the upside.
There is a major support area in green at 0.3100, which represents a strong basis for the upside.
Don't forget a simple thing: ease and capital.
When you reach the first target, save some money and then change your stop-loss order to an entry order.
For inquiries, please leave a comment.
We have a trend to hold above the 100 Moving Average.
Entry price: 0.3137.
First target: 0.3205.
Second target: 0.3294.
Third target: 0.3484.
Don't forget a simple thing: ease and capital.
When you reach the first target, save some money and then change your stop-loss order to an entry order.
For inquiries, please leave a comment.
Thank you.

#SEI/USDT continues to grow !#SEI
The price is moving within a descending channel on the 1-hour frame and is expected to break and continue upward.
We have a trend to stabilize above the 100 moving average once again.
We have a downtrend on the RSI indicator that supports the upward break.
We have a support area at the lower boundary of the channel at 0.3150, acting as strong support from which the price can rebound.
We have a major support area in green that pushed the price upward at 0.3120.
Entry price: 0.3238.
First target: 0.3376.
Second target: 0.3510.
Third target: 0.3682.
To manage risk, don't forget stop loss and capital management.
When you reach the first target, save some profits and then change the stop order to an entry order.
For inquiries, please comment.
Thank you.

SEI approaching longSEI is approaching a higher timeframe breakout. A strong weekly close above previous 2-candles and slightly above the trendline should spark a reversal. It looks like this week's close could be a perfect entry to long and hold for some time.
Good set up for a tight stop loss!
