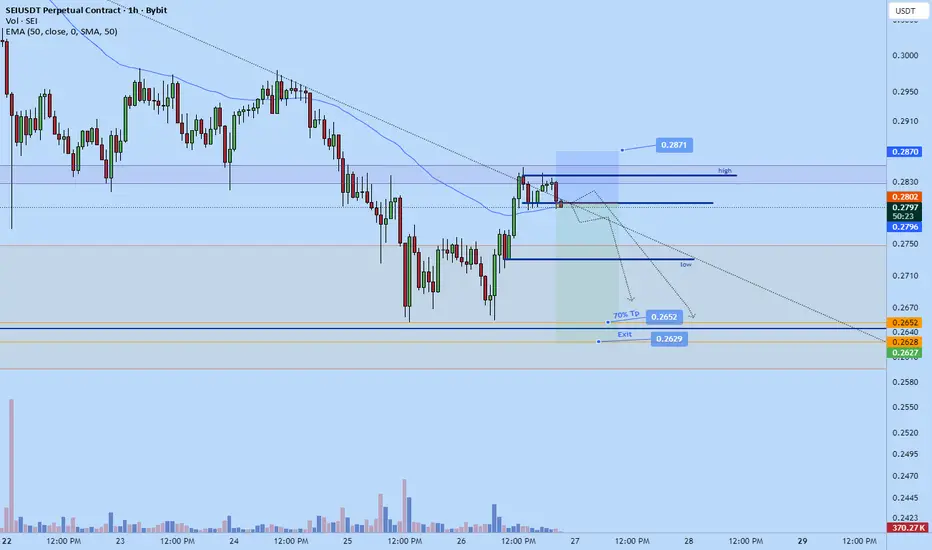
Sei weekend dump to $0.263Went short on sei just now.
Sl: 0.2871
Tp: 0.2629
Partial 70% tp at $0.2652
2.57 RR roughly.
Monthly close coming up and market is likely to revisit prior monthly lows.
7 RR maxSEI is in a consolidation period. I don't believe it has reached high enough. This type of consolidation is typically present before a larger move in the direction of the overall trend (up). Basing this largely on an EW triangle pattern--which may or may not be valid. The other factors supporting th

Designated buying and selling points...Hello friends
Well, you see that we had a downward trend and once the price reached the specified resistance, but it was not valid and the price fell further to the point where we specified the support with Fibonacci for you and from there the price was supported and the resistance was broken, caus

SEI - NEUTRAL HTF - BEARISH LIKELY SHORT TERM NYSE:SEI - Price Update 🐸🚨
⏳ HTF (H4 & 1D): flat PA, no clear trend yet
📌 Range: $0.2600-$0.3750
🟩 Line in the sand: $0.2500 support (bullish bias intact while above)
📉 Short‑term: momentum weak, retest of $0.2750–$0.2700 possible
❌ Breakdown: a clean move below $0.2500 could open $0.2

SeiusdtHello snipers. The sei / usdt currency pair is on the one-day time frame. The price is still moving in an ascending channel. With the market turning red, a strong bearish candle has brought the price to the bottom of the channel. Fortunately, the moving average line is below the price at the bottom

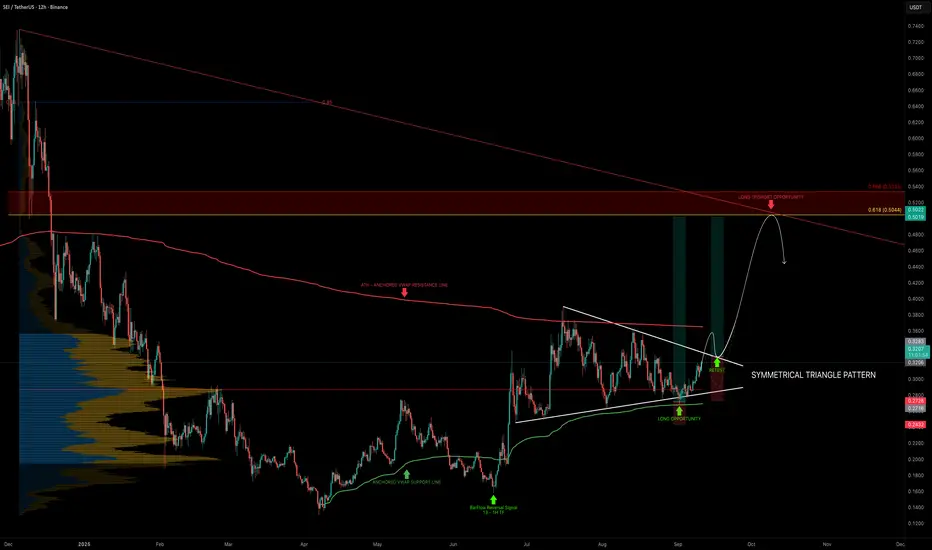
SEI — Triangle Pattern Breakout Ahead?SEI has been consolidating in a symmetrical triangle for the past 78 days, now reaching the apex, signaling that a big move is coming soon.
Price has been trading between two anchored VWAPs:
From the $0.13 low → acting as support (currently ~$0.27)
From the ATH → acting as resistance (currently
$SEIPUMP Token Slumps, Leads Meme Coin Losses: Pump.fun’s native token, PUMP, recently slumped, leading losses among meme coins like Dogecoin, PEPE, and BONK, as the market stumbled.

SEI/USDT Bullish Setup – Eyeing Breakout Towards $0.46SEI/USDT is currently trading around $0.31, holding above the ascending trendline support. The price has shown consistent higher lows since July, indicating strong bullish structure.
The short-term retracement looks healthy and is finding support near the trendline. As long as SEI holds above the

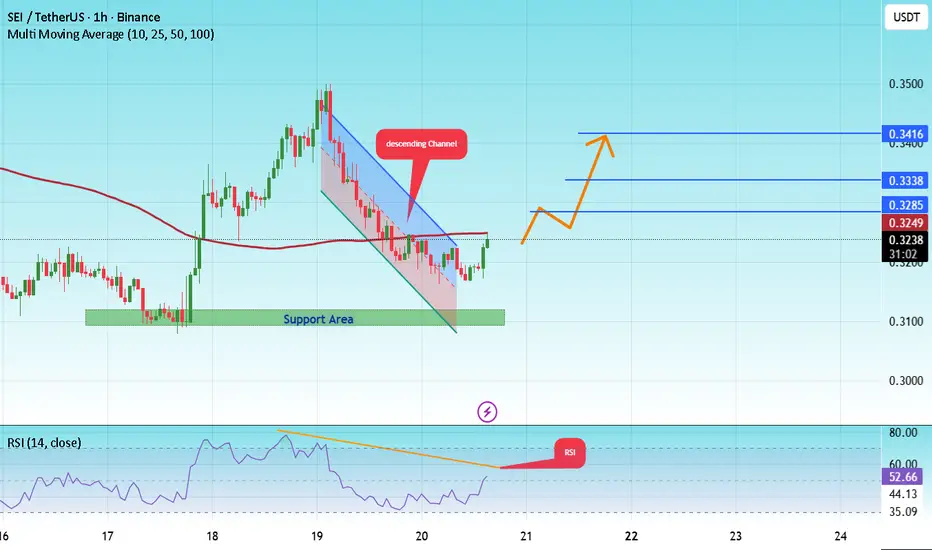
#SEI/USDT — Triangle Pattern Breakout Ahead?#SEI
The price is moving in a descending channel on the 1-hour frame and is expected to break and continue upward.
We have a trend to stabilize above the 100 moving average once again.
We have a downtrend on the RSI indicator that supports the upward move with a breakout.
We have a major support
SEIUSDT Scalp 1hrPrice poked into the OB but was rejected.
Smart money is absorbing liquidity, shaking out weak hands (stop hunts).
Buy near the OB edge opposite the wick:
Use a tight stop just beyond the wick to avoid getting caught if the stop hunt continues.
Look for VP LVN/HVN confluence—if LVN below a bullish

See all ideas
Summarizing what the indicators are suggesting.
Oscillators
Neutral
SellBuy
Strong sellStrong buy
Strong sellSellNeutralBuyStrong buy
Oscillators
Neutral
SellBuy
Strong sellStrong buy
Strong sellSellNeutralBuyStrong buy
Summary
Neutral
SellBuy
Strong sellStrong buy
Strong sellSellNeutralBuyStrong buy
Summary
Neutral
SellBuy
Strong sellStrong buy
Strong sellSellNeutralBuyStrong buy
Summary
Neutral
SellBuy
Strong sellStrong buy
Strong sellSellNeutralBuyStrong buy
Moving Averages
Neutral
SellBuy
Strong sellStrong buy
Strong sellSellNeutralBuyStrong buy
Moving Averages
Neutral
SellBuy
Strong sellStrong buy
Strong sellSellNeutralBuyStrong buy
Displays a symbol's price movements over previous years to identify recurring trends.