Nvidia - This is clearly not the end!📐Nvidia ( NASDAQ:NVDA ) will simply rally more:
🔎Analysis summary:
Yes, over the past couple of months, Nvidia has been rallying another +100%. But looking at the higher timeframe, this is still not the end of the unbelievable bullrun. Following the rising channel pattern, Nvidia can rally another +20% before we might see a potential retracement.
📝Levels to watch:
$250
SwingTraderPhil
SwingTrading.Simplified. | Investing.Simplified. | #LONGTERMVISION
NVDA01 trade ideas

NVDA Looking at NVDA on the 1H chart, the broader market structure has been bullish for weeks, consistently printing higher highs and higher lows. That trend began to weaken when a Change of Character (CHoCH) printed at $183.97, as sellers managed to break through a minor higher low. This was later followed by a Break of Structure (BOS) at $173.89, confirming that momentum has shifted bearish in the short term and opening the door for a deeper pullback within the larger bullish context.
The demand zones beneath price show where buyers previously acted decisively. Around $173–$175, buyers stepped in with strength, sending price higher toward $183. A deeper demand base sits around $165–$167, which looks very strong because it was the origin of the rally that established the higher highs earlier in August. On the supply side, the $179–$182 band is strong as sellers rejected price from this level multiple times, producing sharp downward moves.
Inside the marked region, price is currently sliding lower, retracing into nearby demand just above $175. If buyers defend this level, a bounce into the $179–$181 supply is likely. However, should the $173 support give way, sellers could extend control and drive price into the $167–$165 demand area before the next meaningful reaction.
The trade bias right now is short-term bearish, looking for a pullback into demand before a relief bounce. The invalidation level for this view sits at $183; a clean reclaim above that would reestablish bullish continuation and negate the bearish structure shift. Momentum currently favors sellers, as shown by the impulsive downside move, but if a bullish engulfing or rejection wick forms off $175 demand, that would signal buyer strength returning.

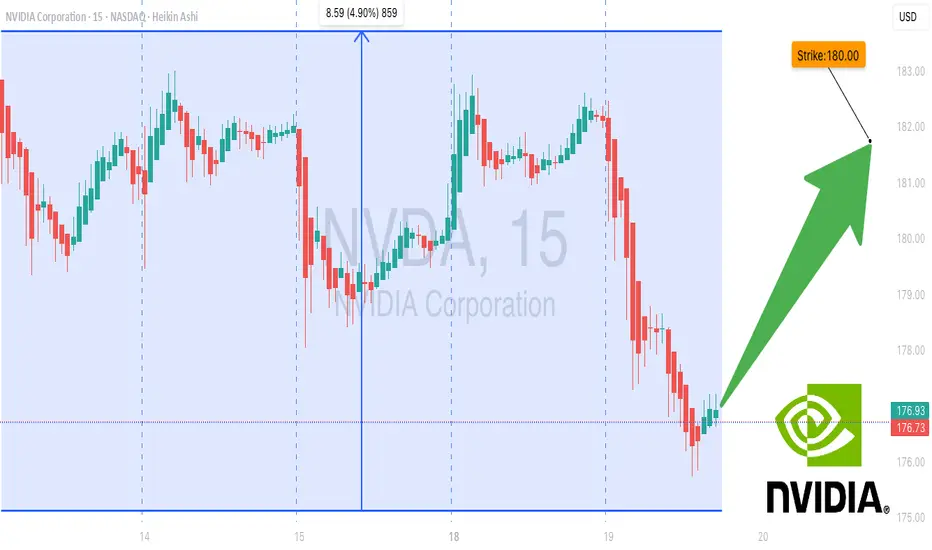
Strong Bullish Flow in NVDA: $180 Calls Primed for Breakout! 🚀 NVDA Weekly Options Bullish Flow – Aug 19, 2025
**Market Sentiment:**
📈 Total calls: **632,689** | Total puts: **334,721**
💥 **Call/Put Ratio: 1.89 → Strong Weekly Bullish Flow**
⚠️ Gamma Risk: Moderate – watch volatility closely.
**Technical Indicators:**
* **Daily RSI:** 63.3 → slight pullback signs
* **Weekly RSI:** 87.2 → 🚀 strong weekly momentum
* **Weekly Volume Ratio:** 0.9x → weak institutional activity, caution advised
**Options Highlights:**
* Key strikes: **\$180** (OI: 65,649), **\$187.50** (liquid and premium-friendly)
* Expiration in **3 days** → time decay accelerating
**Risks to Monitor:**
* Weak weekly volume
* Daily RSI trending down
* Price support at **\$175.90–\$176.00**
**Consensus & Trade Setup:**
* **Overall Bias:** Moderate Bullish
* **Recommended Trade:** **Single-leg Call**
* **Strike:** \$180.00
* **Entry:** \$3.60
* **Stop Loss:** \$1.80
* **Profit Target:** \$6.00–\$7.50 (80%-100% potential)
* **Confidence:** 65%
**Trade JSON Snapshot:**
```json
{
"instrument": "NVDA",
"direction": "call",
"strike": 180.0,
"expiry": "2025-08-22",
"confidence": 0.65,
"profit_target": 6.00,
"stop_loss": 1.80,
"size": 1,
"entry_price": 3.60,
"entry_timing": "open",
"signal_publish_time": "2025-08-19 13:15:57 EDT"
}
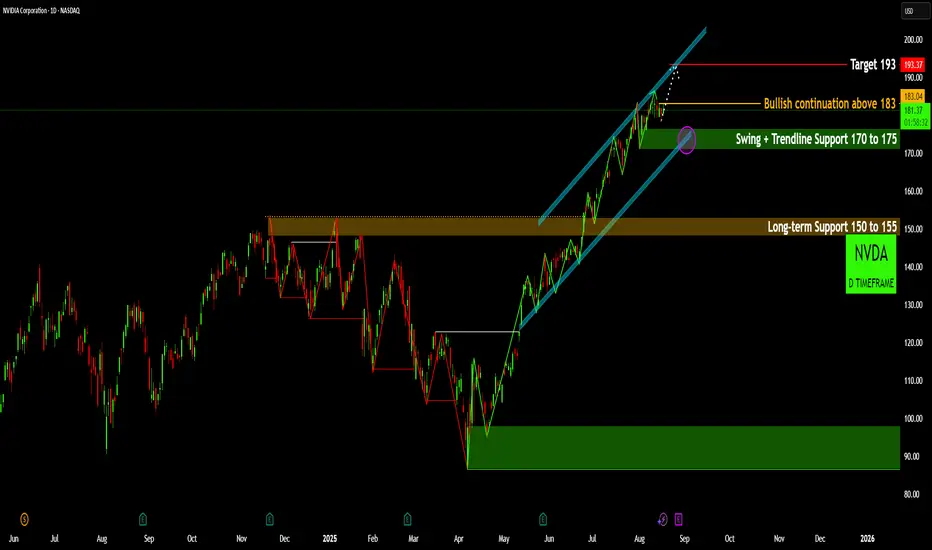
NVIDIA (NVDA): Fueling Up for Fresh Highs!NVIDIA (NVDA): Fueling Up for Fresh Highs! 🚀
NVIDIA (NVDA) has staged a powerful recovery, turning the tide from its early 2025 lows and now poised for a significant move. A comprehensive look at the daily timeframe reveals crucial levels and a compelling bullish structure.
Robust Trend Reversal & Channel Formation: Following a substantial bottom established near the 85-95 region 🎯 in April, NVDA initiated a textbook uptrend. The price action has since carved out a well-defined bullish channel 📈, consistently printing higher highs and higher lows, indicative of strong buyer conviction.
Pivotal Support Foundations: The long-term 150-155 zone 🟢 now serves as a robust foundational support, having transitioned from a previous resistance level. More immediately, the 170-175 area 🟣 represents a critical confluence of a recent swing low and the lower boundary of the bullish channel. This zone is paramount for sustaining the current upward momentum.
Immediate Resistance Challenge: Currently, NVDA is fiercely contending with the $183 resistance level ⚡. This is a pivotal point; a decisive breach above this mark would confirm strong bullish continuation, signaling that buyers are firmly in control and pushing for new highs.
Path to Target: A confirmed break above $183 opens the gateway for a powerful push towards the $193 objective 🎯. This target aligns seamlessly with the upper boundary of the prevailing bullish channel, signaling the next potential peak for this rally. Traders should monitor the volume accompanying any breakout for confirmation.
Key Levels to Monitor: While the outlook remains bullish, a failure to defend the
170-175 support would warrant caution, potentially ushering in a retest of the stronger
150-155 foundation ⚠️. Vigilance at these key levels will be crucial for navigating NVDA's next moves.
Disclaimer:
The information provided in this chart is for educational and informational purposes only and should not be considered as investment advice. Trading and investing involve substantial risk and are not suitable for every investor. You should carefully consider your financial situation and consult with a financial advisor before making any investment decisions. The creator of this chart does not guarantee any specific outcome or profit and is not responsible for any losses incurred as a result of using this information. Past performance is not indicative of future results. Use this information at your own risk. This chart has been created for my own improvement in Trading and Investment Analysis. Please do your own analysis before any investments.
NVDA pullback prior to earnings?180 puts this week? 175 / at or below 21 ema target.
Or watch the pullback. I am neutral on NVDA's bullish dominance into earnings. Chopping and slight LH (lower highs) last week.

NVDA – Two Scenarios on the Table: 200 or 140?NVIDIA has been the undeniable leader of the AI revolution, pushing higher for months and hitting fresh highs around $180+. But after such a strong rally, the market often faces a “decision zone”: either break higher with momentum or take a healthy correction.
That’s why I’m laying out two clear trade paths — bullish continuation 🚀 and bearish retracement 📉.
✅ Bullish Scenario (Momentum Continues → $200)
Entry Points (Bullish):
$178
$170
$160
Profit Targets:
TP1: $185
TP2: $190
TP3: $200+
⚠️ Bearish Scenario (Healthy Correction → $140 Entry)
If momentum fades and sellers push NVDA below $170, a correction toward $140 is possible — which would actually be a great long-term entry for buyers waiting on the sidelines.
Entry Points (Bearish Long Setup):
$160
$150
$140 (ideal deep value entry zone)
Profit Targets on Rebound:
TP1: $160
TP2: $175
TP3: $190
📌 Disclaimer: This is not financial advice. I’m sharing my personal trading view for educational purposes. Always do your own research and manage risk before entering any trade.
NVDA Ready to Break Higher – $187.50 Calls Flashing Opportunity!
# 🚀 NVDA Weekly Options Analysis (2025-08-17) – Don’t Miss Out!
### 🔎 Model Insights Recap
**Grok/xAI Report**
* 📊 RSI: Falling (daily & weekly → potential exhaustion)
* 📈 Call/Put Ratio: **2.00 (Bullish flow)**
* 🔊 Volume: Weak
* ✅ Decision: Moderate bullish → suggested **\$190 Call**
**Gemini/Google Report**
* 📊 RSI: Declining
* 📈 Options Flow: Strong, but weak trend & volume
* 🛑 Decision: **Pass** (low confidence)
**Claude/Anthropic Report**
* 📊 Technical: Overbought with negative divergence
* 🔊 Volume: Flat weekly
* 🛑 Decision: **No trade** (bearish momentum indicators)
**Llama/Meta Report**
* 📊 Bias: Neutral-bullish (options flow positive)
* 🔊 Volume: Weak
* ✅ Decision: **\$187.50 Call** with caution
**DeepSeek Report**
* 📊 Market: Bearish divergence despite bullish flow
* 🔊 Volume: Weak institutional support
* 🛑 Decision: **No trade**
---
### 📌 Key Agreements
✔️ Declining daily & weekly RSI = potential momentum exhaustion
✔️ Strong call/put ratio = bullish sentiment from options traders
✔️ Weak volume = lack of support for sustained upside
### 📌 Key Disagreements
⚖️ Grok/xAI & Llama/Meta → potential bullish calls
⚖️ Gemini/Claude/DeepSeek → caution/pass
⚖️ Bullishness varies depending on options flow vs volume
---
## 📊 Recommended Trade Setup
* **Direction:** CALL (Long)
* **Strike:** \$187.50
* **Expiry:** 2025-08-22
* **Entry Price:** \$0.85
* **Stop Loss:** \$0.34 – \$0.425 (40-50% of premium)
* **Profit Target:** \$1.50 (50-100% return)
* **Entry Timing:** Market Open
* **Confidence:** 65%
---
### ⚠️ Key Risks
* **Momentum Exhaustion:** Falling RSI could signal reversals
* **Weak Institutional Support:** Volume may limit upside
* **Event Risk:** Upcoming earnings may introduce volatility
---
📊 **TRADE DETAILS JSON**
```json
{
"instrument": "NVDA",
"direction": "call",
"strike": 187.50,
"expiry": "2025-08-22",
"confidence": 0.65,
"profit_target": 1.50,
"stop_loss": 0.34,
"size": 1,
"entry_price": 0.85,
"entry_timing": "open",
"signal_publish_time": "2025-08-17 09:26:30 EDT"
}
```

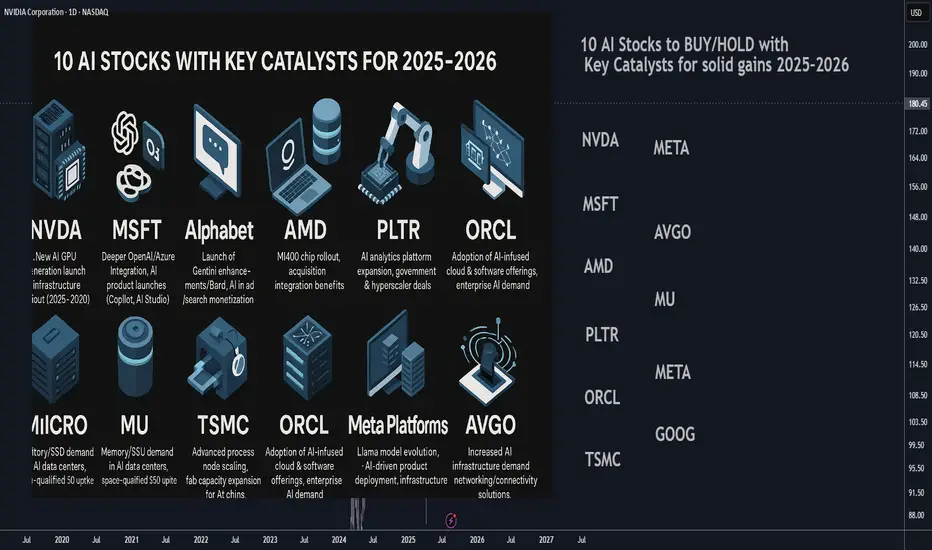
10 AI Stocks to BUY/HOLD with Key Catalysts for solid gains 202510 AI Stocks to BUY/HOLD with Key Catalysts for solid gains 2025–2026
________________________________________
1. NVIDIA (NASDAQ: NVDA)
• Catalyst: Expansion of AI infrastructure via new GPU generations (e.g., Blackwell), continued dominance in AI training/deployment. Regulatory/availability clarity in key markets like China could also drive demand.
• Highlights: Leader in AI GPUs; high analyst upgrades and raised targets; strong global demand from data centers and hyperscale AI deployments.
________________________________________
2. Microsoft (NASDAQ: MSFT)
• Catalyst: Deepening integration of AI across products and services (e.g., Office, Teams), OpenAI partnership further embedded in Azure services, AI product launches (Copilot, AI Studio).
• Highlights: Extensive cloud & enterprise reach; strong balance sheet; strategic positioning as AI infrastructure and application leader.
________________________________________
3. Alphabet (NASDAQ: GOOGL)
• Catalyst: Rollout of key AI products (e.g., Gemini, Bard enhancements), continued monetization of AI in search & advertising, rising AI-related cloud license revenue.
• Highlights: Core AI research leader; growing earnings momentum; sustained institutional inflows and investor confidence tied to AI growth.
________________________________________
4. AMD (NASDAQ: AMD)
• Catalyst: Launch of AI-optimized server chips (e.g., MI400 series), integration of AI functionality in CPUs/GPUs, synergy from Xilinx and Silo AI acquisitions.
• Highlights: Aggressive roadmap in AI compute; acquisitions bringing AI IP and talent; gaining share in AI server ecosystem.
________________________________________
5. Palantir (NYSE: PLTR)
• Catalyst: Expansion of AI-driven government and commercial contracts, rollout of AI-enabled analytics platforms such as Palantir AI suite, new hyperscaler partnerships.
• Highlights: AI-analytics leader with strong public-sector footprint; pivoting toward cloud-based AI; high-margin recurring revenue potential.
________________________________________
6. Micron Technology (NASDAQ: MU)
• Catalyst: Accelerated demand for AI-optimized memory and storage (e.g., HBM, SSDs); uptake of Micron's AI/space-qualified SSDs; expansions into AI data center deployments.
• Highlights: Strong sequential performance in earnings; double-digit growth in AI segments; positioned as non-GPU hardware beneficiary of AI boom.
________________________________________
7. TSMC (NYSE: TSM)
• Catalyst: Scaling advanced process nodes (e.g., N3E, N2) to support AI chips, capacity expansion initiatives, securing AI chip orders from Nvidia, AMD, and other fabless players.
• Highlights: Global leader in semiconductor foundry; high-barrier-to-entry business model; direct beneficiary of AI silicon ramp-up.
________________________________________
8. Oracle (NYSE: ORCL)
• Catalyst: Launch and adoption of Oracle Cloud AI capabilities (OCI AI, embedded ML), AI-driven Oracle Fusion applications, increasing AI-related capex by enterprise customers.
• Highlights: Strong enterprise penetration; AI-infused software suite; renewed investor interest from hedge funds targeting AI exposure.
________________________________________
9. Meta Platforms (NASDAQ: META)
• Catalyst: Continued investment in large-scale AI infrastructure (data centers), Llama 3 and generative AI models, new AI products in social, AR/VR, and enterprise.
• Highlights: Massive AI compute investments; pioneering open models like Llama; turning AI into a core product strategy beyond social media.
________________________________________
10. Broadcom (NASDAQ: AVGO)
• Catalyst: AI-related semiconductor solutions (e.g., networking, connectivity, acceleration) embedded in data center infrastructure, demand from AI workload networking.
• Highlights: Integral player in AI infrastructure as part of the “Fab 4”; diversified exposure across chips critical for AI workloads.
________________________________________
How to Monitor These Catalysts
• Product Launches & Roadmap Updates (e.g., NVDA GPU release events, AMD MI400 launch, META model updates)
• Earnings Calls / Financial Guidance revealing AI revenue — especially with MSFT, GOOGL, ORCL, MU, and AVGO
• Partnership or Contract Announcements — e.g., Palantir industry deals, Oracle enterprise AI deployments
• Capacity & Scaling News — e.g., TSMC fab expansion, Micron memory contracts, Meta data center buildouts
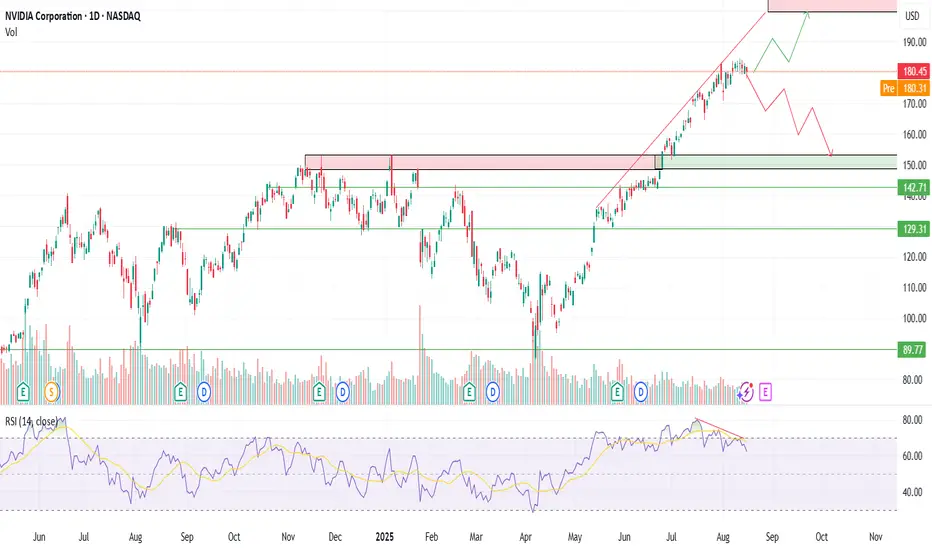
NVDA NVIDIA As of mid-August 2025, NVIDIA Corporation (NVDA) stock is trading around $180.45 per share, down slightly by about 0.86% on the day. The stock has had a strong year, gaining over 34% in 2025, with a recent all-time high closing price of $183.16 recorded on August 12. The company's market capitalization stands at approximately $4.4 trillion.
NVIDIA remains a dominant player in the semiconductor industry, known especially for its leadership in graphics processing units (GPUs), artificial intelligence (AI) technologies, and high-performance computing. The company's focus on AI and data center applications continues to drive investor interest.
Analysts, including those at Goldman Sachs, have a positive outlook on NVIDIA ahead of its upcoming earnings report scheduled for August 27, 2025. They expect strong financial performance, potentially exceeding expectations, particularly driven by ramp-ups in new product lines and growth in key markets like China.
Key highlights:
Current stock price: ~$180.45
Market cap: ~$4.4 trillion
Year-to-date gain: ~34%
NVIDIA's core growth prospects are closely tied to innovations in AI chips, data center expansion, and gaming technologies, positioning it well for continued long-term growth despite some short-term price volatility.
#STOCKS #NVIDIA

NVDA overextended?NASDAQ:NVDA going a bit over the moving average..... and for good reason. China's gonna make them a growth giant. Please go back down! Pullback/correction probably 175ish to low 160ish. I've always hated the Fib... but it kinda fitting on the chart.
Watchlist Only
No entry yet...

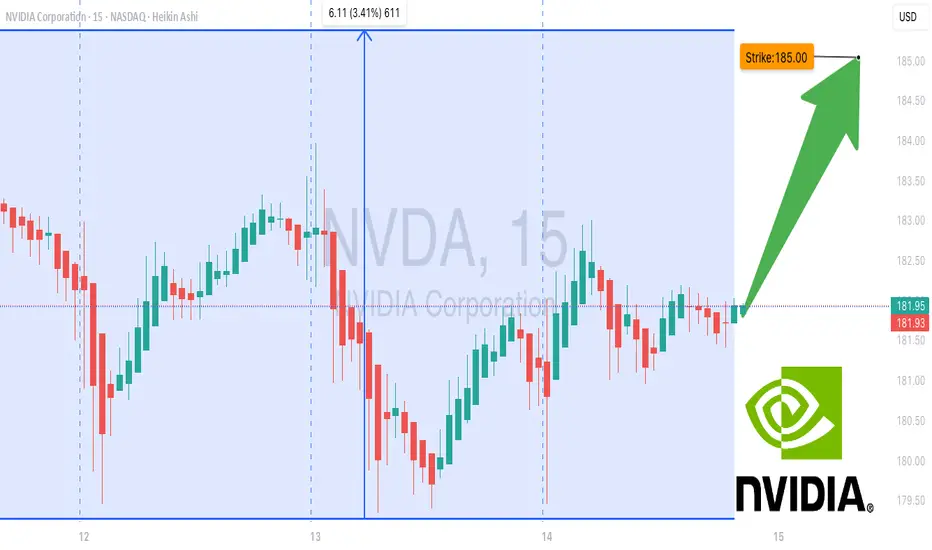
NVDA Gamma Showdown: Will Bulls Break $185 Before Time Runs Out? 🚀 NVDA Gamma Showdown: Will Bulls Break \$185 Before Time Runs Out?
**Sentiment:** ⚖️ *Moderate Bullish, High Risk*
* **Call/Put Ratio:** 1.78 📈
* **Daily RSI:** Mixed → Losing momentum
* **Weekly RSI:** Still bullish
* **Volume:** Weak → Low institutional conviction
* **Gamma Risk:** 🔥 HIGH — expiry in 1 day
* **Time Decay:** Accelerating ⚡
---
### 📊 **Consensus Highlights**
✅ Bullish options flow supports upside potential
⚠️ Weak volume + gamma risk = cautious sizing
💡 Tight stop loss and fast profit-taking advised
---
### 🎯 **Trade Setup**
* **Type:** CALL (Naked)
* **Strike:** \$185.00
* **Expiry:** 2025-08-15
* **Entry:** \$0.62
* **Profit Target:** \$0.86 (+30%)
* **Stop Loss:** \$0.31 (–50%)
* **Confidence:** 65%
* **Entry Timing:** Market open
---
💬 *This is a high-risk, high-reward expiry play — watch it like a hawk.*
📌 *Not financial advice. DYOR.*
---
**#NVDA #OptionsTrading #GammaSqueeze #DayTrading #StocksToWatch #OptionsFlow #TradingSignals #StockMarket**
Proprietary SupportIn this slowly but continuously updating idea I will be posting an interesting way to analyze charts. It is something old but also new, like duality.
We all know that the stock market continuously grows.
But it doesn't always grow.
For markets lie between worlds.
The reasonable and the unreasonable.
The free choice and the illusion of free choice.
Let me explain...
In micro scale, we seem to believe that the markets follow the "support / resistance" rule.
An (over)simplification necessary for us to comprehend the infinities of the quantum world.
There are lots of stories told in the picture above...
- Prices are chaotic and completely incomprehensible.
- We have to smooth-out to get a clearer picture.
- Is Support / Resistance real or a result of crowd psychology?
- At what point horizontal action "ceases" to exist and "trend" takes over?
Either we call it a "power law" or a Lin-log regression, charts in macro scale seem to trend.
So prices sometimes move with one "law" (support) and sometimes with another (trend).
Do we remember / know what is the foundation of price movement?
A century ago, Wyckoff came up with his theory of accumulation and distribution.
We can safely say that his research was not a result of crowd psychology. He backtested countless price charts, in a period (1920s) when trading was purely psychological, with traders having little experience to modern ideas of "trend", "support" etc.
Just like the new modern technology design principles, ahem aapl, technological information lies inside bubbles. Transparent but distorted. Clear but fuzzy. Duality once again.
Modern trading is a self sustaining loop. The "freedom" of our actions is trapped inside a bubble. Most of us "trade" with similar strategies, and end up in the mass pool of barely-profitable-investors. Unconventional strategists like Hedge Funds must have "alien" technology to overcome such psychological traps.
Back to the main chart:
It is one attempt to bring a new dimension to chart analysis. To merge these two worlds of "support" and "trend". I cannot possibly reach the expertise of massive corporations, but I can bodge something out, and I did.
Price charts can be analyzed with unconventional / proprietary methods to conclude into the chart above. It is a little rough but bear with me. I had to perform complex calculations which I couldn't compile into a Pine Indicator. There is a reason that the top lines are not exactly straight. Their calculations depend on a blend between micro and macro movements.
A couple of interesting charts to conclude the first update of this idea:
BTC Daily
BTC Weekly
A Perfect Fractal.
I hate bubbles. Mental ones, Soapy ones, Stock ones and UI ones.
- An angry Father Grigori.

NVDA: 181.59 for ThursdayBullish Entry: 186.00 / 188.00 Bullish Stop 184.00 Bullish Target: 190.00 Bearish Entry: 178.00 / 176.00 Bearish Stop 180.00 Bearish Target: 174.00 Relevant Zone 179.46–178.80 demand zone. Supply zone 184.00/184.48

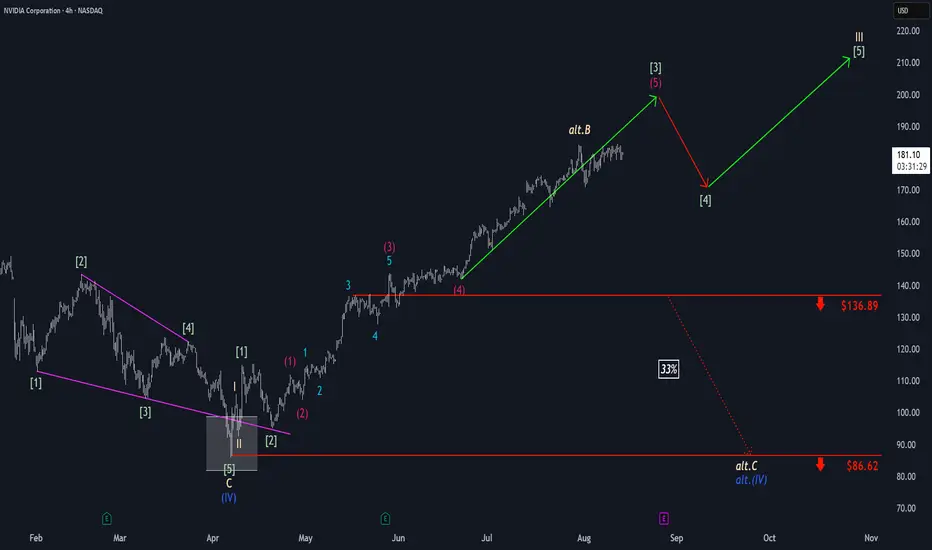
Nvidia: Extending the RallyThe bulls have maintained their momentum in Nvidia, effectively managing any interim pullbacks and allowing the stock to make further gains within the framework of green wave . We still see some additional upside potential at this stage before an interim correction of wave is likely. Well above support at $136.89, wave should then begin, pushing the stock even higher and completing the larger beige wave III. That said, we still see a 33% chance that NVDA has only recently marked the corrective top of beige wave alt.B and could soon fall below $136.89, setting a new correction low for blue wave alt.(IV) near the $86.62 level. Primarily, however, we believe wave (IV) has concluded.
Simple support and resistance for NVDAsupport at 181, resist at 184. earnings coming up, so be careful. exit anything prior to the 29th.
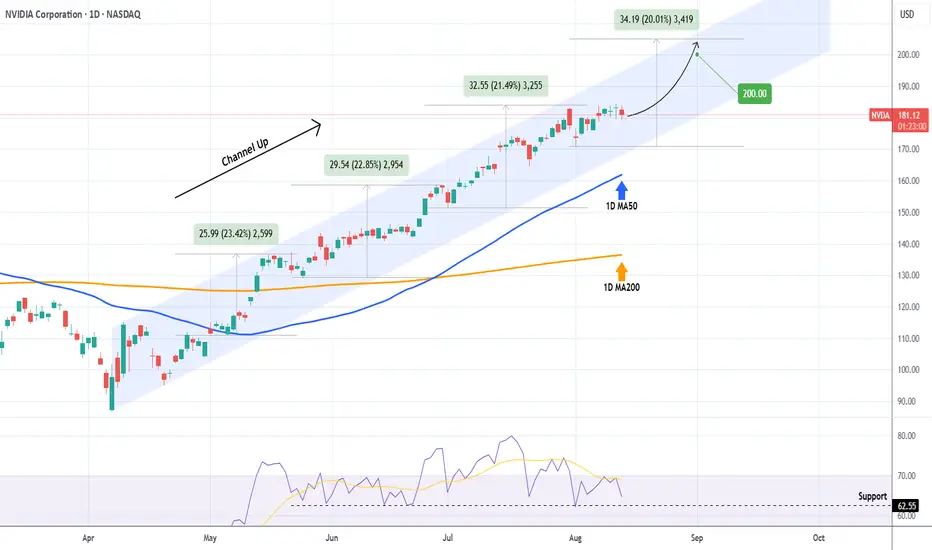
NVIDIA Is the path to $200 that easy?NVIDIA Corporation (NVDA) has been trading within a Channel Up since the April 07 market Low, being so aggressive that it has turned its 1D MA50 (blue trend-line) into Support since May 01.
The last 3 main Bullish Legs all rose by at least +20%. As long as the 1D RSI Support holds, we expect another such Leg, which would be enough for NVIDIA to reach the all important $200 psychological Target.
-------------------------------------------------------------------------------
** Please LIKE 👍, FOLLOW ✅, SHARE 🙌 and COMMENT ✍ if you enjoy this idea! Also share your ideas and charts in the comments section below! This is best way to keep it relevant, support us, keep the content here free and allow the idea to reach as many people as possible. **
-------------------------------------------------------------------------------
💸💸💸💸💸💸
👇 👇 👇 👇 👇 👇
NVDA cant stop wont stop! in my last updated I said watch the 144.80 level.. if we could get a clean daily close over that then 175-200 should follow! well my 175 target is smashed, we could dip to 170 short term but I expect my 200 target to get smashed in the next month ;)
congrats to all longs, see you soon.. boost and follow for more!
Nvidia (NVDA) Share Price Growth SlowsNvidia (NVDA) Share Price Growth Slows
Equity markets are on the rise:
→ The S&P 500 index (US SPX 500 mini on FXOpen) has reached a new all-time high;
→ The Nikkei 225 (Japan 225 on FXOpen) hit a fresh record high yesterday;
→ Gains are also seen across other assets — for example, Ethereum has climbed to its highest level since November 2021.
The CNN Fear & Greed Index indicates market “greed”, but it is worth noting that one of the market leaders, Nvidia (NVDA), is not matching the broader bullish momentum.
Technical Analysis of Nvidia (NVDA)
Although NVDA’s share price remains within a long-term ascending channel (shown in blue), holders have valid reasons for concern.
The NVDA chart shows that price growth is capped by the $183 resistance level, with a series of bearish signals emerging (as indicated by the arrows):
→ Following a bullish gap in late July, the price failed to sustain its highs and quickly retreated, erasing the upbeat sentiment;
→ A bearish engulfing pattern on 7 August suggests that the median line of the ascending channel is acting as resistance;
→ The RSI indicator peaked on 29 July, but subsequent price increases have not been accompanied by higher RSI highs — a sign of bearish divergence.
As a result, NVDA price is consolidating within a narrowing triangle:
→ On the one hand, higher lows indicate that buyers are still supporting the price;
→ On the other hand, the $183 level continues to cap the advance of this market leader despite the broader bullish environment.
Bulls need to show determination soon to break through the key $183 resistance; otherwise, the ascending channel in place since early July risks being breached. In that scenario, the August low near $172 could be retested.
This article represents the opinion of the Companies operating under the FXOpen brand only. It is not to be construed as an offer, solicitation, or recommendation with respect to products and services provided by the Companies operating under the FXOpen brand, nor is it to be considered financial advice.

NVDA: 183.16 WEDNESDAYBullish Entry: 186.00 / 188.00 – Target: 188.00 – Stop: 184.00
Bearish Entry: 182.00 / 180.00 – Target: 180.00 – Stop: 183.50
breaks out with strength and volume, it could extend even to 190.00 intraday.
180.00 could act as a potential rebound.

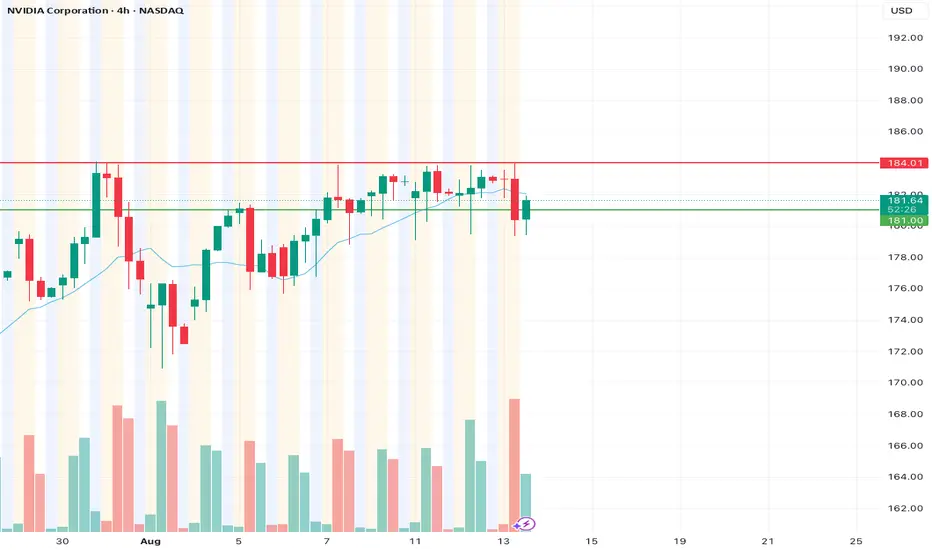
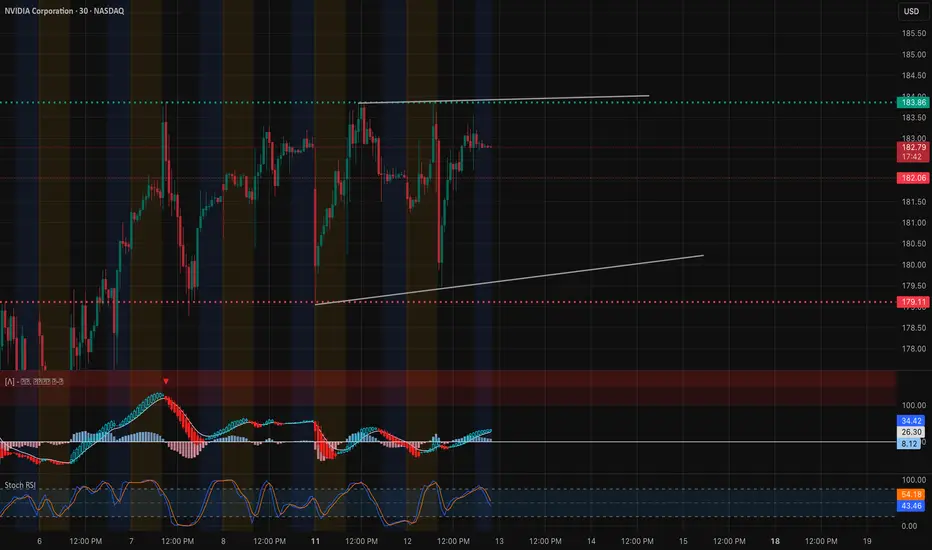
NVDA – TA + GEX Confluence for August 13, 202530-Minute Price Action
NVDA is trading in a tight consolidation range near $183.86, repeatedly testing resistance without a confirmed breakout.
* Resistance: $183.86 – multiple tests with no close above, forming the top of the range.
* Support: $182.06 – intraday pivot; $179.11 – deeper support and prior demand zone.
* Indicators:
* MACD is flat, reflecting indecision and reduced momentum.
* Stoch RSI is mid-range, suggesting room for either a breakout or a fade depending on market catalysts.
1-Hour GEX Insights
* Highest Positive NET GEX / Gamma Wall: $183.86 – matches perfectly with 30m resistance, showing strong hedging activity.
* Call Walls Above: $187.5 (2nd gamma wall), $190 (major call wall & 3rd gamma level).
* Put Support: $177.5 (1st defense), $175 (stronger floor), $172.5 (secondary gamma floor).
* IVR: 16.2 – relatively low implied volatility rank, keeping long option premiums reasonable.
TA + GEX Combined Read
The 30m chart’s repeated tests of $183.86 line up exactly with the largest GEX wall on the 1h chart.
* A breakout above $183.86 could trigger gamma-driven momentum into $187.5 and potentially $190 if volume supports.
* A rejection at $183.86 could bring a retest of $182.06, and if that fails, a move toward $179.11 and $177.5 GEX support.
Trading Scenarios for August 13
* Bullish Breakout: Long calls or debit spreads above $184 targeting $187.5–$190.
* Bearish Rejection: Puts or put spreads if $183.86 rejects and $182.06 breaks, targeting $179.11–$177.5.
* Neutral Range: Credit spreads between $179–$184 may work if consolidation continues, but be ready to close early on breakout.
Reasoning
The 30m chart’s tight range reflects market indecision, but the 1h GEX data highlights $183.86 as a key pivot for tomorrow. Breaks above this level open the path to the next gamma cluster, while rejection keeps NVDA in range or triggers a pullback toward strong GEX-supported floors.
NVDA goes to $200NVDA keeps pushing towards $200 major resistance area, a very good momentum showed by a clear bullish trendline and stochastic momentum. No sign of bearish yet but still we've seen a slow but steady gain over the last couple days. Trend-based fibonacci is used to project the target price for NVDA. Short-term downward momentum might appear, however if NVDA isn't break down the 1.618 fibonacci level ($165-$170 price range) from the previous trend-based fibonacci, we could say that NVDA still remain bullish. Stop loss is optional on that level.

$NVDA - $280-300 YEAR END TARGET Trend is your friend, just keep it simple. Lots of runway ahead accompanied with improved gross margins of mid 70% during back half of the year on already high margins. Technical trend channel has a price objective between $280 to almost $300.

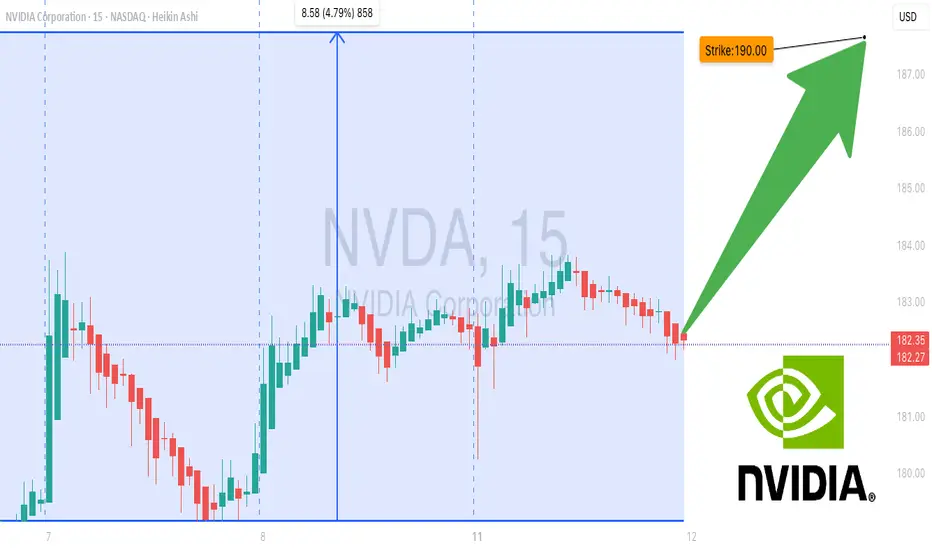
NVDA don’t Miss Out--$190 Call Target, Momentum on Fire## 🚀 NVDA Weekly Options Breakdown (Aug 11, 2025) 🚀
### 🔥 Market Sentiment: Bullish Bias Across Models
* **Grok/xAI**: Strong Bullish — rising RSI & bullish flow, but *watch weak volume*.
* **Claude/Anthropic**: Moderate Bullish but *no trade* due to policy risks & volume doubts.
* **Gemini/Google**: Moderate Bullish, recommends **\$192.5 calls** with stop loss — volume risk noted.
* **Llama/Meta**: Bullish — buy **\$190 calls**, manage volatility & premium decay.
### ✅ Consensus Trade Setup:
**Buy \$190 Calls** expiring Aug 15 @ \$0.70 premium
* 🎯 Profit Target: \$0.91
* 🛑 Stop Loss: \$0.35
* 📊 Confidence: 70%
* ⏰ Entry: Market Open Next Trading Day
### ⚠️ Key Risks:
* Policy/news impact on semiconductor sector
* Moderate gamma risk & possible volatility spikes near expiry
---
### 🔍 Model Insights Breakdown
| Model | Sentiment | Trade Idea | Confidence |
| ---------------- | ---------------- | ------------------------------ | ---------- |
| Grok/xAI | Strong Bullish | Buy \$190 Calls | 70% |
| Claude/Anthropic | Moderate Bullish | No trade (high news risk) | 45% |
| Gemini/Google | Moderate Bullish | Buy \$192.5 Calls w/ stop loss | 65% |
| Llama/Meta | Bullish | Buy \$190 Calls w/ risk mgmt | 70% |
---
### 💡 Why This Matters
* RSI and options flow point strongly bullish — calls dominate puts 1.2+ ratio
* Volume confirmation weak, so *manage risk tightly*
* Position best for aggressive traders ready to manage fast moves
---
📈 **NVDA Weekly Options Trade Summary**
```json
{
"instrument": "NVDA",
"direction": "call",
"strike": 190.0,
"expiry": "2025-08-15",
"confidence": 0.70,
"profit_target": 0.91,
"stop_loss": 0.35,
"size": 1,
"entry_price": 0.70,
"entry_timing": "open",
"signal_publish_time": "2025-08-11 10:33:48 UTC-04:00"
}
```