Is SHIB About to Explode or Collapse? Read Before It’s Too LateYello Paradisers! Are you paying attention to SHIB right now? Because this could either be the start of a massive bullish breakout — or the trap that wipes out impatient traders.
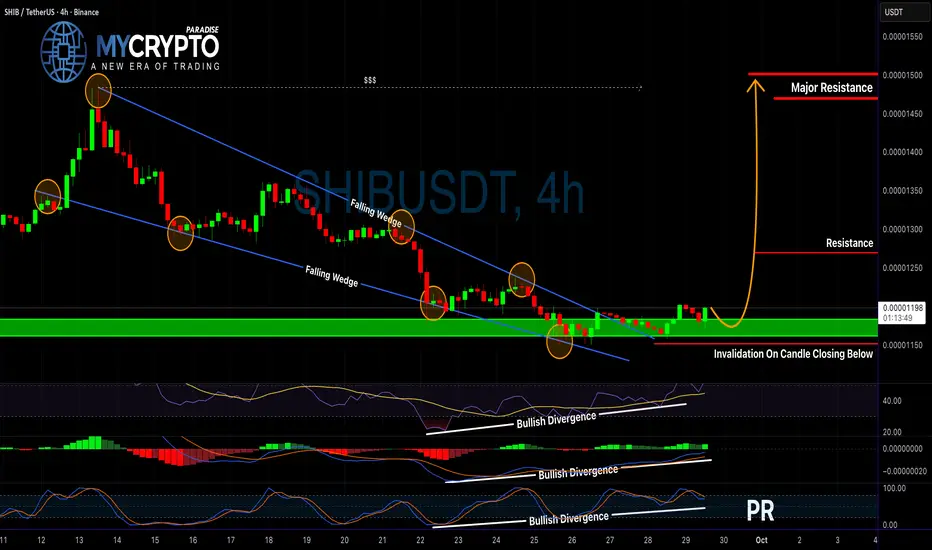
💎SHIBUSDT is showing strong potential after breaking out of a falling wedge pattern, which is a classic bullish reversal
Related pairs
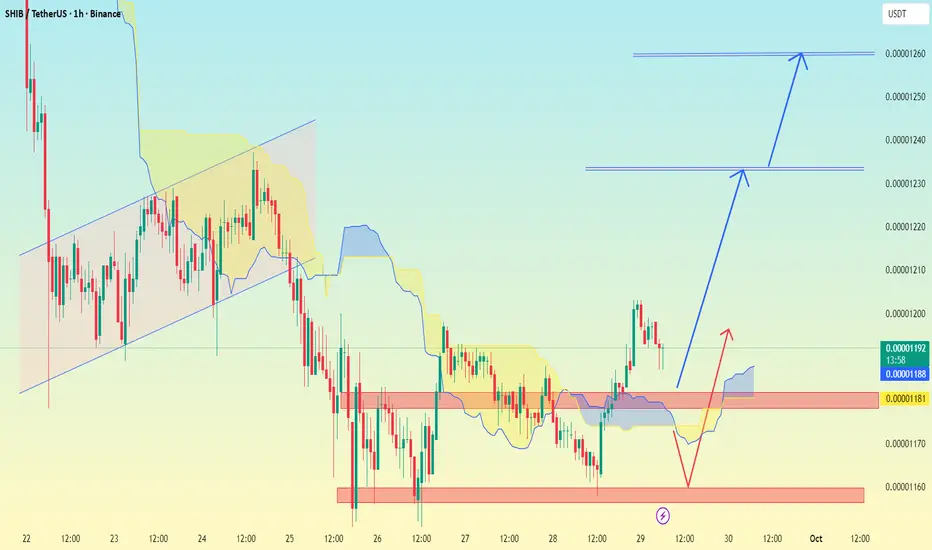
SHIB/USDT 1H chart Pattern.SHIB/USDT 1H chart, I see already marked possible targets with blue arrows. Based on the chart structure:
Immediate support zone: around 0.00001180 – 0.00001188 (red box).
Upside potential:
First target (short-term): 0.00001230
Second target (next level): 0.00001260
So the expected move is:
SHIBUSDT — A Major Move Will Be Decided From This Critical Zone!Overview
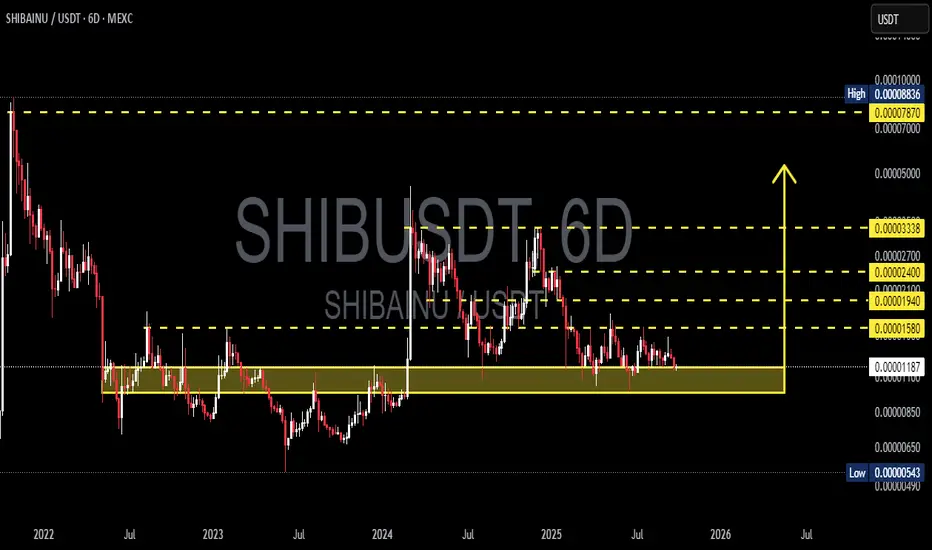
The 6D chart of SHIB/USDT shows a long-term consolidation that has been developing since 2022. Price is once again testing the key demand zone (0.00000850 – 0.00001183), an area that has acted as a strong support multiple times.
This zone is now a true “make or break level” — either SHIB r
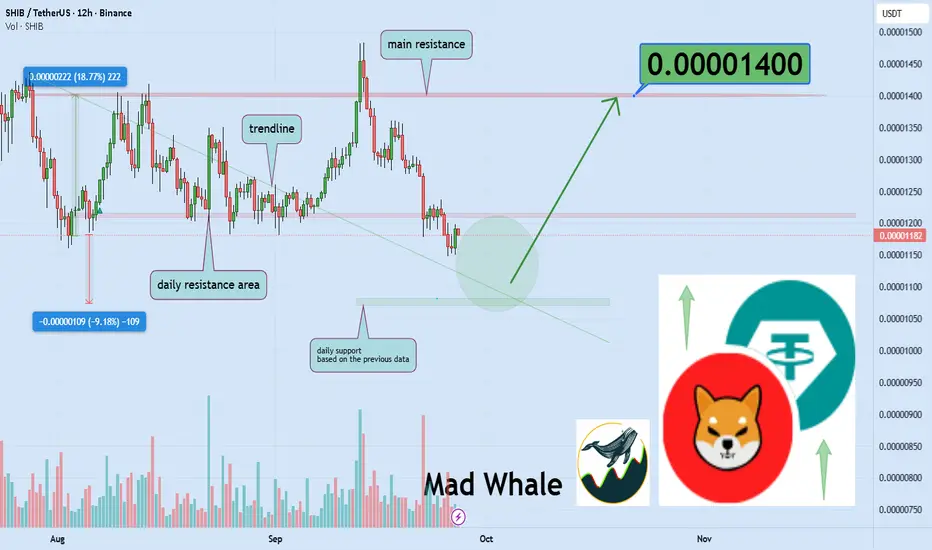
24% Profit A trendline has been broken and now targets 0.00001460, indicating a 25% profit for long positions.

SHIBUSDTBINANCE:SHIBUSDT is now in first reaction to uptrend. I wait for pullback to breakout.
Please control risk management.⚠️

Will Shiba Inu bounce 18% from this key support level? Hello✌️
Let’s analyze Shiba Inu’s price action both technically and fundamentally 📈.
🔍Fundamental analysis:
Shiba Inu plans AI features and a new Layer-3 in July 2025 to cut costs and scale better.
If users adopt fast, SHIB could see demand grow like past upgrades.
📊Technical analysis:
SHIB/USDT: Bearish Momentum Builds Below Key ResistanceSHIB/USDT has rejected resistance at 0.00001361, extending its bearish momentum back into the 0.00001230 support zone. Price action is developing a corrective structure within the channel, following a failed breakout attempt.
If the 0.00001230 support level breaks, the next downside target is aroun

Shiba Strong Consolidation Region Shiba has been consolidating since February in this price range, it is tapering towards a possible structural break
There is a strong buy zone below tapering to test an LTB
Breaking this region has the possibility of testing this upper part of the accumulation zone. Bitcoin can boost this movement

SHIB/USDT — Burn & Exchange Reserves Hit Record LowShiba Inu burned 8.8M SHIB last week, while exchange reserves fell to their lowest since 2023. This suggests accumulation, reducing sell pressure. Price is testing support at 0.00001168.
Key Levels
• Resistance: 0.00001269, 0.00001278 (100MA), 0.00001295 (200MA)
• Support: 0.00001168, 0.00001129

SHIBUSDT DEAD MARKET here do not bring profit for holders YetPrevious time i remember we had dead market like this but suddenly it start panic pump and every one bought SHIB on their wallets or regrets not having it before pump so this boring market remind me of 2021 crazy 10x and soon it may repeat now and this time i would say 3x is also would be fine and p

See all ideas
Summarizing what the indicators are suggesting.
Oscillators
Neutral
SellBuy
Strong sellStrong buy
Strong sellSellNeutralBuyStrong buy
Oscillators
Neutral
SellBuy
Strong sellStrong buy
Strong sellSellNeutralBuyStrong buy
Summary
Neutral
SellBuy
Strong sellStrong buy
Strong sellSellNeutralBuyStrong buy
Summary
Neutral
SellBuy
Strong sellStrong buy
Strong sellSellNeutralBuyStrong buy
Summary
Neutral
SellBuy
Strong sellStrong buy
Strong sellSellNeutralBuyStrong buy
Moving Averages
Neutral
SellBuy
Strong sellStrong buy
Strong sellSellNeutralBuyStrong buy
Moving Averages
Neutral
SellBuy
Strong sellStrong buy
Strong sellSellNeutralBuyStrong buy
Displays a symbol's price movements over previous years to identify recurring trends.
Frequently Asked Questions
The current price of SHIB3xLong/Tether (SHIB) is 0.011623 USDT — it has fallen −7.62% in the past 24 hours. Try placing this info into the context by checking out what coins are also gaining and losing at the moment and seeing SHIB price chart.
SHIB3xLong/Tether price has risen by 10.27% over the last week, its month performance shows a −12.31% decrease, and as for the last year, SHIB3xLong/Tether has decreased by −91.17%. See more dynamics on SHIB price chart.
Keep track of coins' changes with our Crypto Coins Heatmap.
Keep track of coins' changes with our Crypto Coins Heatmap.
SHIB3xLong/Tether (SHIB) reached its highest price on Oct 28, 2021 — it amounted to 51.227270 USDT. Find more insights on the SHIB price chart.
See the list of crypto gainers and choose what best fits your strategy.
See the list of crypto gainers and choose what best fits your strategy.
SHIB3xLong/Tether (SHIB) reached the lowest price of 0.007920 USDT on Jun 22, 2025. View more SHIB3xLong/Tether dynamics on the price chart.
See the list of crypto losers to find unexpected opportunities.
See the list of crypto losers to find unexpected opportunities.
The safest choice when buying SHIB is to go to a well-known crypto exchange. Some of the popular names are Binance, Coinbase, Kraken. But you'll have to find a reliable broker and create an account first. You can trade SHIB right from TradingView charts — just choose a broker and connect to your account.
Crypto markets are famous for their volatility, so one should study all the available stats before adding crypto assets to their portfolio. Very often it's technical analysis that comes in handy. We prepared technical ratings for SHIB3xLong/Tether (SHIB): today its technical analysis shows the neutral signal, and according to the 1 week rating SHIB shows the sell signal. And you'd better dig deeper and study 1 month rating too — it's sell. Find inspiration in SHIB3xLong/Tether trading ideas and keep track of what's moving crypto markets with our crypto news feed.
SHIB3xLong/Tether (SHIB) is just as reliable as any other crypto asset — this corner of the world market is highly volatile. Today, for instance, SHIB3xLong/Tether is estimated as 14.22% volatile. The only thing it means is that you must prepare and examine all available information before making a decision. And if you're not sure about SHIB3xLong/Tether, you can find more inspiration in our curated watchlists.
You can discuss SHIB3xLong/Tether (SHIB) with other users in our public chats, Minds or in the comments to Ideas.