SILVER (XAG/USD): One More Bullish Wave is Coming?!⚠️ SILVER appears to be confined within a horizontal range, as observed on the 4-hour chart. The price is currently nearing the upper limit of this range.
Given the prevailing strong bullish trend, there is a considerable likelihood of a continued upward movement.
A breakout and a 4-hour candle closing above the indicated resistance level would serve as a dependable confirmation.
The subsequent objective for buyers is anticipated to be 49.00.
Conversely, the market might persist in its consolidation phase, trading within the established range.
SILVER.F trade ideas

SILVER (XAG/USD): Bullish Rally ContinuesIt appears that 📈SILVER is expected to continue its upward trend, potentially reaching the 50.00 psychological level.
The observed break of structure on the 4-hour chart suggests a strong presence of buyers.
Given the lack of significant US news today, the market is anticipated to maintain a bullish sentiment.

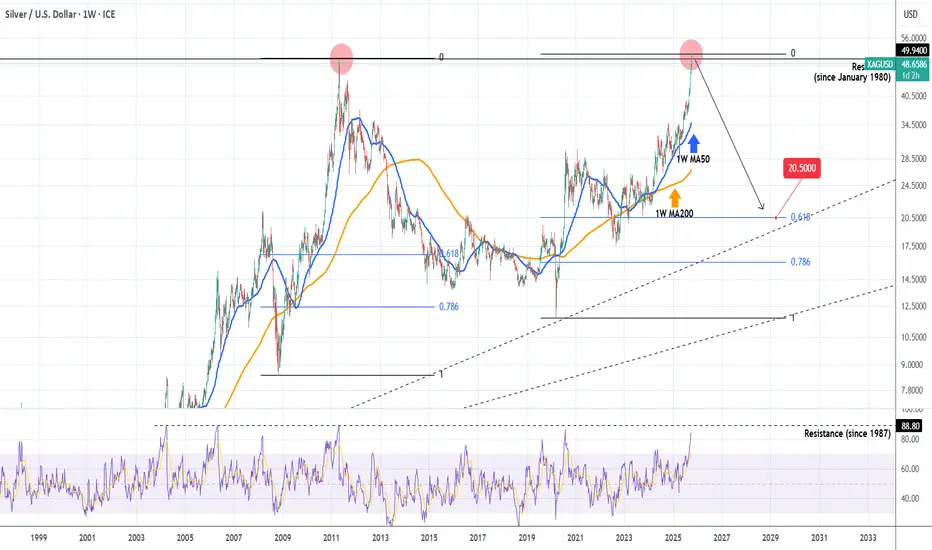
SILVER made new ATH. Multi-year Bear Cycle starting.Last time we took a look at Silver (XAGUSD) (August 22, see chart below), we had a clear buy signal on its 1D MA50 at the bottom of the Channel Up, that quickly hit our 4050 Target:
The pattern even broke aggressively upwards and this week crossed the 49.9400 Resistance, which is the All Time High (ATH) from April 18 2011. Essentially that was also the High of the long forgotten January 1980 Top!
Needless to say, cyclical behavior indicates that this is where the market sells and starts new multi-year (2-3) Bear Cycles. The 1W RSI comes to confirm that, as it is only a few points off he 88.80 Resistance, which has been the ultimate sell signal since 1987.
We expect the market to decline to at least the 0.618 Fibonacci retracement level at 20.500, which is also where the first key Higher Lows trend-line (dashed) is.
-------------------------------------------------------------------------------
** Please LIKE 👍, FOLLOW ✅, SHARE 🙌 and COMMENT ✍ if you enjoy this idea! Also share your ideas and charts in the comments section below! This is best way to keep it relevant, support us, keep the content here free and allow the idea to reach as many people as possible. **
-------------------------------------------------------------------------------
💸💸💸💸💸💸
👇 👇 👇 👇 👇 👇
Silver Market Once in a Lifetime Breakout: 120/140 USD PT📌 Base case unchanged: I’m still targeting $125–$150 within 12–24 months. The next leg of the bull run should accelerate after the all-time-high (~$49–$50) breaks and sticks. Spot is circling the mid-$40s (recent highs ~$46–$47), so the setup is in place. 💎✨
🎯 Bottom line
Silver’s structural deficit + gold leadership + policy-driven cost inflation meet a fresh technical regime. The ATH break is the ignition; $65–$75 is the first destination, and the $125–$150 12–24M target stays live if real yields drift down and PV/electronics demand stays elevated despite thrifting. Manage the whipsaws; respect $38 as the cycle guardrail. BUY/HOLD bias remains warranted. 🚀💎🔥
________________________________________
📊 Technical Outlook (2-week candles)
• Structure: Multi-year Cup & Handle from 2011 → 2020 base → 2024/25 handle. The $40 neckline break is done; a weekly/monthly close > $49.50 flips the market into price discovery.
• Levels that matter:
— Resistance: $49–$50 (ATH), then $65–$75 (measured move / vacuum), interim supply near $57–$60.
— Support: $44.5–$45 (breakout retest), $41–$42 (former cap), deeper $38 and $34 (trend break if lost).
• Momentum breadth: Higher highs on price with constructive consolidation while gold prints records → classic GSR mean-reversion tailwind. 📈⚡
________________________________________
🧭 12–24 Month Path Outlook
Base (55%) – Break & run: Close above $50 triggers trend systems and discretionary chase → extension to $65–$75 by mid-’26, stair-step into $100–$125 by late ’26/early ’27; overshoot to $150 on macro squeeze. 🚀
Alt up (15%) – Blow-off: Parabolic sprint to $85–$100 immediately post-break, sharp retrace to high-$60s, then grind to $125–$150.
Pullback (25%) – Fakeout & reload: Failure at $49–$50, mean reversion to $41–$42 or even $38, rebuild positioning; timeline slips ~1–2 quarters.
Bear tail (5%) – Macro shock: USD spike + real-yield jump + PV air-pocket; lose $34 → cycle delay (target deferred, not canceled). ⚠️
________________________________________
🚦 Catalyst Scorecard — Visible & Hidden Drivers (0–10)
1. Fed path & real yields — 9.0/10 (Bullish)
The Fed cut 25 bps on Sept 17 (now 4.00–4.25%) and signaled scope for more easing this year; several officials reinforced that bias. Lower real yields are the single strongest tailwind for non-yielding metals. 🏦
2. U.S. Dollar trend — 6.0/10 (Net-Bullish for silver)
DXY has been firm the last two weeks, a minor headwind; but with the Fed easing bias, dollar upswings look tactical, not structural. Any USD rollover clears the runway. 💵
3. Gold leadership & GSR mean-reversion — 8.5/10 (Bullish)
Gold at/near record highs ~$3.75–$3.80k keeps silver in tow. GSR ~80–84 is elevated vs. bull-market medians → skew favors silver outperformance on a gold grind. 🪙⚖️
4. Structural deficit — 8.5/10 (Bullish)
Fourth straight sizable deficit; ~678 Moz cumulative drawdown since 2021. 2025 still projected to run a ~115–120 Moz deficit despite softer bar/coin demand. 📉📦
5. Industrial demand (PV/Electronics) — 7.5/10 (Bullish with nuance)
PV/electrical demand at record highs; PV up again in 2024 (+3% y/y) and installations broadened across 38 “>1GW” countries. Offsetting force: silver thrifting (0BB, copper plating) → another 10–12% loading cut likely in 2025. Net: total ounces still robust as capacity growth outpaces thrifting… for now. ☀️🔋
6. ETP/ETF flows — 7.5/10 (Bullish)
Global silver ETPs flipped to net inflows in 2024 (+62 Moz) and kept adding into 2025. SLV shows ~15,362 tonnes in trust as of Sept 26—a sizable base of “sticky” investment metal. 📊📈
7. LBMA & COMEX stocks / liquidity premia — 7.0/10 (Bullish)
LBMA silver in London: 24,646 t (Aug) — up m/m but well below pre-2020 peaks; COMEX registered ~196 Moz. Tight-ish float + delivery frictions can widen location premia during spikes. 🏭📦
8. Tariff & logistics regime — 7.0/10 (Bullish via inflation/frictions)
U.S. 50% copper tariff (Aug 1) lifts domestic copper premia and can indirectly affect by-product silver flows and refining economics. Recent gold bar tariff confusion also showed how policy can snarl bullion logistics; LBMA welcomed clarifications, and noted silver discussions continue—headline risk persists. 🚢⚙️
9. Base-metal supply shocks (by-product linkage) — 6.5/10 (Bullish)
Grasberg disruptions and Peru protest-related shutdowns point to emerging fragility in copper output; since much silver comes as a by-product, copper hiccups can tighten silver supply at the margin. ⛏️🌍
10. Mexico policy/permitting — 6.0/10 (Bullish later, volatile now)
World’s top silver producer remains mired in regulatory overhang; exploration still depressed post-2023 reforms. Any genuine permitting thaw would be years from ounces—near-term effect is restraint. 🇲🇽📜
11. India retail/investment demand — 6.5/10 (Bullish)
Silver hitting record rupee highs; local ETFs up ~50%+ YTD; retail investment +7% y/y in H1’25. Seasonal tailwinds into festivals. 🎉🇮🇳
12. China macro & manufacturing — 5.5/10 (Mixed)
Electronics appetite is steady, PV leadership intact; property stress caps jewelry, but investment demand remains opportunistic. Net: supportive on dips, headline-sensitive. 🏗️🇨🇳
13. Systematic/CTA & options positioning — 6.0/10 (Volatility amplifier)
Trend models chased the $40 break; dealer gamma turns negative above $45–$47 at times, inviting intraday whipsaws. 🎯📉📈
14. Geopolitics (Ukraine/Mideast/Taiwan) — 5.5/10 (Event-Bullish)
Safe-haven jolts remain episodic; they matter more after the ATH triggers chase behavior. 🌍🔥
________________________________________
🧨 Hidden (under-traded) catalysts
• GSR compression trade: Once $50 breaks, programmatic rebalancing from gold to silver can accelerate relative gains. (GSR in the 60s pulls silver deeper into triple digits fast.) ⚖️💥
• By-product elasticity: Copper policy & outages (tariffs, mine incidents) can reduce silver by-product feed even as PV demand hums—this is not fully priced. 🔧⛏️
• Vault/warehouse microstructure: LBMA/COMEX stock changes vs. delivery notices can suddenly widen time/location spreads → sparks short-term basis fireworks that lift spot. 📦⏳
________________________________________
🛠️ Positioning & Execution
• Core: BUY/HOLD core metal exposure; add on $44–$45 retests; reload heavier on $41–$42.
• Breakout tactics: On a weekly close > $50, ride call spreads (e.g., $60/$90 9–15M out on SI or SLV) or risk-reversals (sell $35 puts to fund $80–$100 calls).
• Risk controls: Invalidate momentum if weekly close < $38; cut leverage.
________________________________________
🧩 Fundamental NOTES
• Spot context: XAG/USD ~$46, 52-week range ~$28–$46.7. ATH ~$49–$50 (1980/2011).
• Deficit math: Metals Focus/Silver Institute show fourth straight deficit; 2025 deficit ~117 Moz amid record industrial demand and only modest supply growth.
• Supply: 2024 mined = 819.7 Moz; 2025e ≈ 835.0 Moz (+1.9% y/y). Primary mine share keeps slipping; AISC fell in 2024 (by-product credits).
• PV nuance: Silver loadings ↓ ~10–12% in 2025e, but global PV installations broadened; total silver ounces into PV remain lofty even as intensity falls.
• Vaults/ETFs: LBMA London holdings 24,646 t (Aug). SLV metal in trust 15,361.84 t (Sep 26). COMEX registered ~196 Moz.
• Macro winds: Fed cut and may cut more in 2025 → lower real yields + easier USD path.
• Policy kicker: U.S. copper tariffs live; gold bar tariffs clarified after August confusion; silver remains under policy watch—any mis-classification can jolt premia.
________________________________________

Gold ATH – Uncle Jimmy, Silver Momentum & The Market Signal🏆📈 Gold ATH – Uncle Jimmy, Silver Momentum & The Market Signal 🧠🪙
Welcome to Episode 2 of “When Gold Believers Flip.”
Gold has officially broken to all-time highs , and Uncle Jimmy’s quiet rotation into silver suddenly looks like genius…
🟡 GOLD (XAUUSD)
Gold just printed a fresh all-time high at $4,068 🔥
Technically, I still hold a long-term target at $4,489, but the market is overextended.
📉 Game plan:
I’ll only consider shorting below $3,983.
🎯 Short setup:
• Entry: Below $3,983
• Stop-loss: $4,015
Until that trigger hits, bulls remain in control — but risk is rising.
⚪ SILVER (XAGUSD)
Now here’s where it gets juicy.
Remember Uncle Jimmy — the 30-year gold maxi?
This summer, he shocked everyone:
“I’m selling gold to buy silver.” 💬🪙
Guess what? He might’ve nailed it.
Silver is now trading at $48.97, just shy of historical resistance:
🏆 $49.83 (Jan 18, 1980)
✴️ $49.51 (Apr 25, 2011)
🎯 Target: $50.03
But this move is more than a breakout — it’s a sentiment shift.
🧠 The Macro Signal
Yesterday:
🟡 Gold ↑, Silver ↓ = Defensive positioning → not great for markets.
Today:
⚪ Silver ↑, Gold ↓ = Risk appetite returning → bullish tone across assets.
That’s a tailwind for:
• Nasdaq
• Bitcoin
• Broad markets
Silver is part money, part industrial metal — when it leads, optimism rises.
🔁 The Rotation Is Real
📉 Gold looks tired (recent action says not; but my analysis says it is)
🪙 Silver is shining
₿ Bitcoin is waiting
📊 Nasdaq is leading
When hard-money believers like Uncle Jimmy flip...
Pay attention.
Watch the metals.
Watch the sentiment.
This is how macro mood shifts begin.
Mindset Check 🧘
When veterans change conviction, it’s rarely random. Markets evolve — the smartest adapt. Don’t cling to narratives; flow with signals.
One Love,
The FXPROFESSOR 💙
Disclaimer: These charts and analyses reflect my personal opinion only. I am not a financial advisor. Nothing here is financial advice. Trading involves risk, and you are fully responsible for your own decisions. Trade wisely.

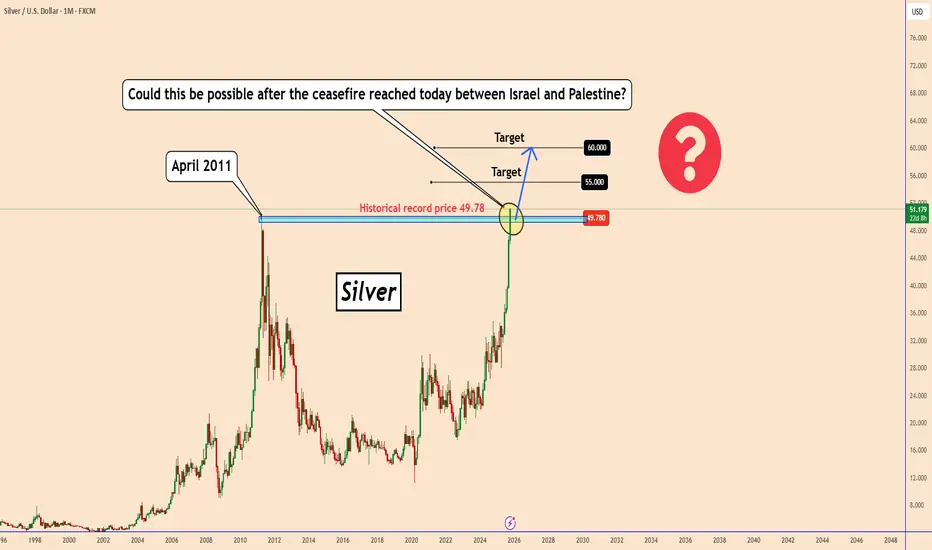
Silver and Gold Keep Rising – The Modern Form of Robbery?Gold and Silver Keep Rising – Even After Good News?
On Thursday, Israel and Palestine announced a ceasefire and hostage deal, part of U.S. President Donald Trump’s first phase plan to end the Gaza war.
Even after all this positive news, Gold and Silver keep rising.
How is that possible?
Normally, such news should reduce geopolitical tension — but instead, Silver broke above its historic high of 49.78, a record that stood since 2011.
So, what more is needed for metals to fall?
Even with peace news, they still climb.
If anyone tells you that market manipulation doesn’t exist, just look at what’s happening now — it’s crystal clear that it does.
Always trade safely and use stop losses on every position.
We’re not market makers — and this is how they take traders’ money. It’s the modern form of robbery.
You may find more details in the chart!
Thank you and Good Luck!
❤️PS: Please support with a like or comment if you find this analysis useful for your trading day❤️
Silver just hit a record high but a double‑top signals pullback!After a strong rally to new records spurred by safe-haven demand and new entrants, silver is now testing critical support levels near $47‑$48 amid the recent Gaza ceasefire news, forming a classic double‑top pattern that may turn into a long-term Cup & Handle that could place price action in a handle pattern for the years to come.
🔑 Key Drivers (Silver‑focused)
Technical breakout : Price breached $51, approaching the 161.8 % Fibonacci level at $47.50.
Double‑top formation : A clean double‑top suggests a near‑term correction could be on the way.
Support zone : The $47‑$48 area acts as the next major support; a break below could open the door to $45‑$46 levels.
Fibonacci retracement : The 61.8% retracement sits around $49.30, providing a potential bounce point before any deeper pullback.
Want the latest silver analyses, alerts on breakouts, and detailed chart breakdowns?
Subscribe, like, and hit the notification bell – then share in the comments your silver trade setup or questions!
This content is not directed to residents of the EU or UK. Any opinions, news, research, analyses, prices or other information contained on this website is provided as general market commentary and does not constitute investment advice. ThinkMarkets will not accept liability for any loss or damage including, without limitation, to any loss of profit which may arise directly or indirectly from use of or reliance on such information.

Silver - Eventually new all time highs!🪚Silver ( TVC:SILVER ) might soon break out:
🔎Analysis summary:
If we look at the bigger picture, Silver has been consolidating for the past couple of decades. But with the recent strong rally of about +50%, Silver is once again heading back to the previous all time highs. Despite a potential short term correction, Silver remains totally bullish though.
📝Levels to watch:
$42, $34
SwingTraderPhil
SwingTrading.Simplified. | Investing.Simplified. | #LONGTERMVISION

SILVER Will Go Lower From Resistance! Sell!
Here is our detailed technical review for SILVER.
Time Frame: 4h
Current Trend: Bearish
Sentiment: Overbought (based on 7-period RSI)
Forecast: Bearish
The market is on a crucial zone of supply 4,932.1.
The above-mentioned technicals clearly indicate the dominance of sellers on the market. I recommend shorting the instrument, aiming at 4,773.8 level.
P.S
Overbought describes a period of time where there has been a significant and consistent upward move in price over a period of time without much pullback.
Like and subscribe and comment my ideas if you enjoy them!

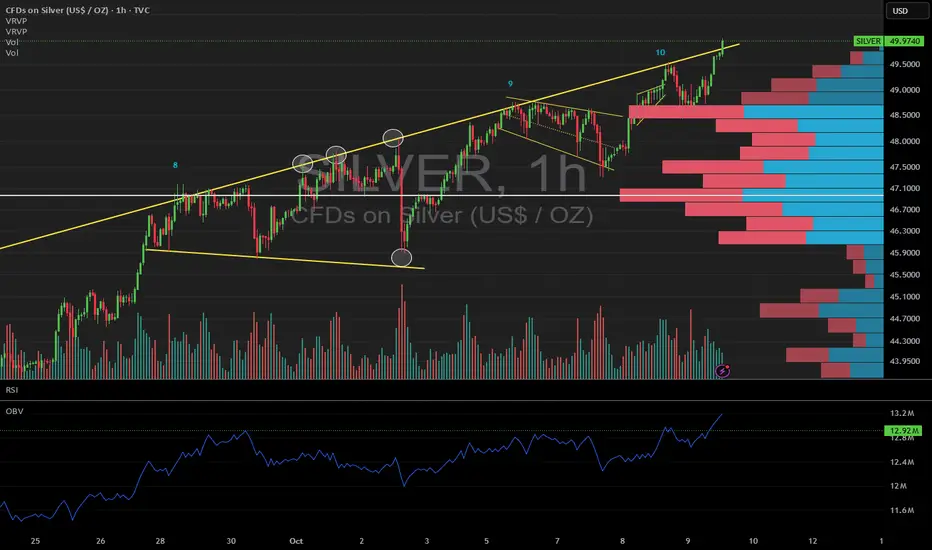
This is huge for silver !!After touching 11 times + the rising resistance, Silver makes a break out right at the 50$ level !!
This could be the level once Gold broke out from at the 2000 level !!
This is huge news for silver !!
XAGUSD-INVESTMENT IDEAXAGUSD is about to break its resistance on montly timeframe and also making a cup and handle pattern if some one want to take trade calculate your risk and invest.

The biggest Silver pump and rally has just startedAfter years, the biggest prediction of the century for silver has begun. It’s following the exact same path that gold did, and now it’s silver’s turn. Soon, Bitcoin and Ethereum will follow the same trajectory.
But why?
The reason is the devaluation of the US dollar and the global printing of money. High liquidity drives people toward precious metals.
So much so that even Warren Buffett is turning to gold and silver after staying away from this market for years.
However, people can’t fully trust gold and silver or spend them easily—they’re mostly just kept under mattresses.
Bitcoin and Ethereum are different. You can spend them anytime, anywhere, using just a hardware wallet.
This is not financial advice—I just wanted to share my perspective with you.
Wishing you success!

SILVER: The Market Is Looking Down! Short!
My dear friends,
Today we will analyse SILVER together☺️
The market is at an inflection zone and price has now reached an area around 49.885 where previous reversals or breakouts have occurred.And a price reaction that we are seeing on multiple timeframes here could signal the next move down so we can enter on confirmation, and target the next key level of 49.478.Stop-loss is recommended beyond the inflection zone.
❤️Sending you lots of Love and Hugs❤️

SILVER C&H FOR A 6X IN NEXT 10 YEARS?Silver has been building a Cup & Handle for 45 years.
Break $50 — and it’s headed to $300.
This time, Silver won’t just follow Gold…
It’ll outrun it.

XAGUSD H1 | Potential Bullish Continuation AheadXAG/USD is falling towards the buy entry which is a pullback support that aligns withthe 38.2% Fibonacci retracement and could bounce from this level to the upside.
Buy entry is at 47.61, which is a pullback support that aligns with the 38.2% Fibonacci retracement.
Stop loss is at 46.74, which is a pullback support that is slightly above the 78.6% Fibonacci retracement.
Take profit is at 49.46, which is aligns with the 161.8% Fibonacci extension.
High Risk Investment Warning
Trading Forex/CFDs on margin carries a high level of risk and may not be suitable for all investors. Leverage can work against you.
Stratos Markets Limited (tradu.com/uk ):
CFDs are complex instruments and come with a high risk of losing money rapidly due to leverage. 65% of retail investor accounts lose money when trading CFDs with this provider. You should consider whether you understand how CFDs work and whether you can afford to take the high risk of losing your money.
Stratos Europe Ltd (tradu.com/eu ):
CFDs are complex instruments and come with a high risk of losing money rapidly due to leverage. 66% of retail investor accounts lose money when trading CFDs with this provider. You should consider whether you understand how CFDs work and whether you can afford to take the high risk of losing your money.
Stratos Global LLC (tradu.com/en ):
Losses can exceed deposits.
Please be advised that the information presented on TradingView is provided to Tradu (‘Company’, ‘we’) by a third-party provider (‘TFA Global Pte Ltd’). Please be reminded that you are solely responsible for the trading decisions on your account. There is a very high degree of risk involved in trading. Any information and/or content is intended entirely for research, educational and informational purposes only and does not constitute investment or consultation advice or investment strategy. The information is not tailored to the investment needs of any specific person and therefore does not involve a consideration of any of the investment objectives, financial situation or needs of any viewer that may receive it. Kindly also note that past performance is not a reliable indicator of future results. Actual results may differ materially from those anticipated in forward-looking or past performance statements. We assume no liability as to the accuracy or completeness of any of the information and/or content provided herein and the Company cannot be held responsible for any omission, mistake nor for any loss or damage including without limitation to any loss of profit which may arise from reliance on any information supplied by TFA Global Pte Ltd.
The speaker(s) is neither an employee, agent nor representative of Tradu and is therefore acting independently. The opinions given are their own, constitute general market commentary, and do not constitute the opinion or advice of Tradu or any form of personal or investment advice. Tradu neither endorses nor guarantees offerings of third-party speakers, nor is Tradu responsible for the content, veracity or opinions of third-party speakers, presenters or participants.

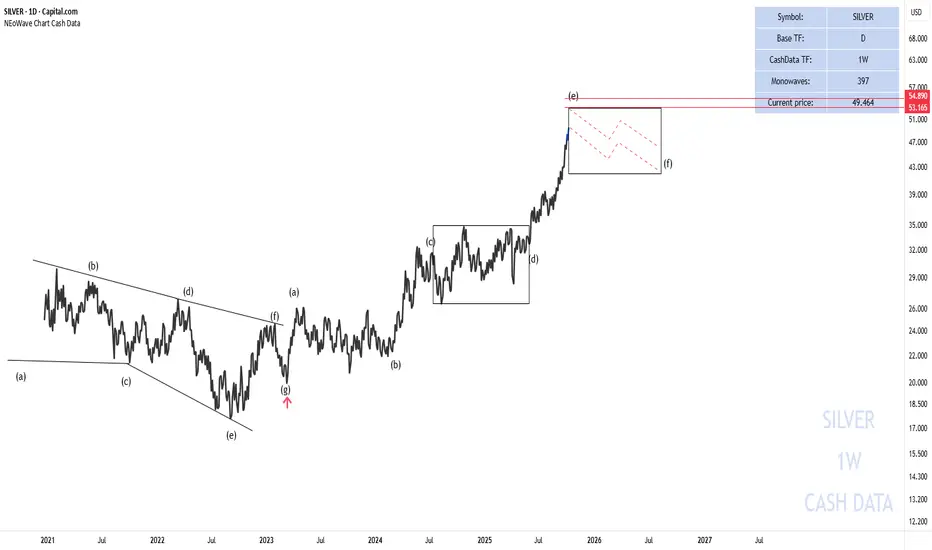
SILVER target based on NEoWave
Based on the weekly cash data, it appears that the trend that began on March 9, 2023, is developing into a diametric pattern, and we are currently in its Wave (e). I expect Wave (f) of the diametric to start from the current prices or the $53–$56 range.
Good luck
NEoWave Chart
Silver at critical resistance, is a great collapse next?Silver has a long history of dramatic price spikes, each coinciding with significant global macro events:
June 1980, the Hunt Brother’s squeeze sent silver parabolic before collapsing
March 2011, post Global Financial Crisis (GFC) stimulus + QE mania led to another blow off top
Present day, amidst chaotic politics and incomprehensible levels of debt price action is once again testing the same resistance zone around $50
This area has proven to be a multi-decade resistance. Each prior approach ended in a swift and brutal correction.
Technical analysis
Monthly chart: Price action has surged aggressively. 300% since the lows of 2020 to the $45-50 resistance band, mirroring the same vertical rallies of 1980 and 2011.
RSI: A long term descending RSI resistance line connects the 1980 and 2011 tops. Current RSI is once again colliding with this barrier, hinting at exhaustion.
Momentum: While silver is undeniably strong, history suggests the upside risk may be limited at these levels compared to the downside potential.
Risk reward breakdown
Upside potential: A clean breakout above $50 could open the door to a true price discovery phase possibly $60+ if silver enters a secular commodities super cycle.
Downside risk: Failure here would mimic the historic collapses:
1980: -90% drawdown
2011: -70% drawdown
A pullback to $25-30 would not be unusual, especially if macro liquidly tightens.
Trading strategy ideas:
Aggressive traders: Consider short setups or profit taking near the $50 resistance, with stops above $52-53 to manage risk.
Conservative traders: Wait for confirmation, either a monthly breakout or close above $50 (bullish) or a strong rejection signal.
Conclusion
Silver has once again like Gold reached historic levels. The risk/reward profile favours caution here on. History shows that vertical rallies into this level tend to end poorly for late longs. Unless silver breaks and holds above $50, the probability of a deep correction remains high.
Is it possible price action continues higher? Sure.
Is it probable? No.
Ww

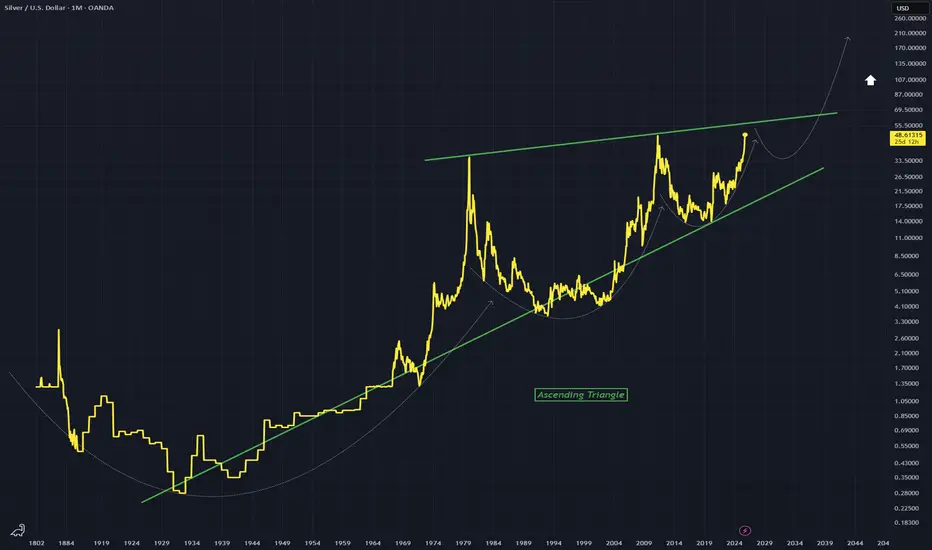
SILVER - Recurring Cup PatternInteresting chart showing repeating cups, each one progressively becoming tighter and tighter within this large ascending triangle on this Monthly chart.
Will another cup form and break out of this triangle? It is possible and would be a massive Breakout.
Again, Monthly chart.
#XAGUSD(SILVER): Price is likely to drop at $41 area. The current trading price of XAGUSD (SILVER) is at an all-time high. This is attributed to global uncertainty and the decline of the US Dollar. However, the lack of significant volume to support this level suggests a potential rapid decline. This decline could facilitate the price reaching a key level of $41.
There are two potential benefits from this drop. Firstly, it would allow for maximisation of trading by selling. Secondly, when the price reaches this level, we can purchase at the discounted price.
We wish you the best of luck and trade safely.
Team Setupsfx_

XAGUSDSilver triggered a buy signal around $21 and has now rallied to $48. Based on my outlook, the final target for this upward move could extend to $78. After that, I expect a correction phase toward the $50 zone, before wave 5 potentially drives prices higher toward the $150 level.

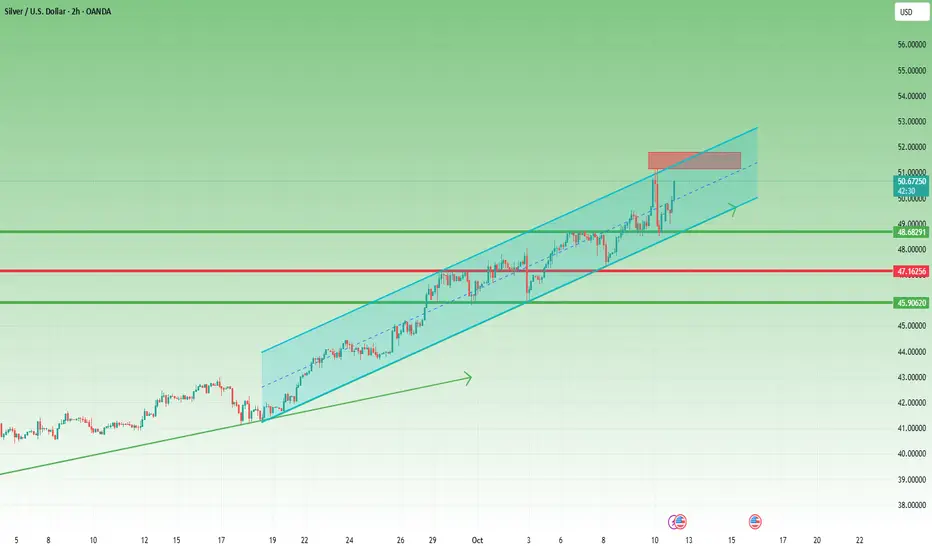
New Silver ATH, Sharp Drop, Strong Rebound – What’s Next?Yesterday:
Silver finally made a new All-Time High, a moment that many precious metal traders have been waiting for.
After touching the 51.20 zone, price also experienced a sharp drop, similar to what we saw in Gold.
However — the situation here is notably different.
________________________________________
Key Technical Observations
1. Support Retest, Not Overlap:
The recent drop found support on a horizontal level that acted as strong resistance earlier this week.
Unlike Gold, the structure didn’t overlap — a clear technical advantage.
2. Bullish Structure Intact:
The correction remained above the ascending channel’s support line, meaning Silver never exited its bullish formation — another plus point.
3. Strong Rebound:
At the time of writing, Silver is showing a solid recovery, reclaiming both the 50.00 level and the median line of the channel — a third technical confirmation of strength.
________________________________________
Trading Bias
Unlike Gold, my bias on Silver is bullish in the short term now.
If Gold manages to rebound above 4,000, as I expect in the short term, there’s a high probability that Silver will print a new ATH.
________________________________________
Key Level to Watch
I’ll be watching closely the upper boundary of the channel and yesterday’s high.
Since I’m currently out of the market and late to join the bullish leg, I’ll wait for price action to show its hand.
If signs of weakness appear in that zone, I’ll consider short opportunities, targeting yesterday’s low.
Until then — it’s a wait-and-see approach.
Could this be correct? Time to get defensive in my opinionThis count has perfect fib extentension and I am beginning to this the pb that we are all expecting is coming soon...very soon. To each is own, but I am going to take some chips off the table here and be ready for a decent pull back to reload...but to each his own.

SILVER (XAGUSD): New ATH & What is Next
Silver successfully broke through a historic resistance
based on a previous ATH.
Bullish keep pushing strong and the market may continue rising easily.
The closest strong psychological resistance is 55.0 level.
It can be reached soon.
❤️Please, support my work with like, thank you!❤️
