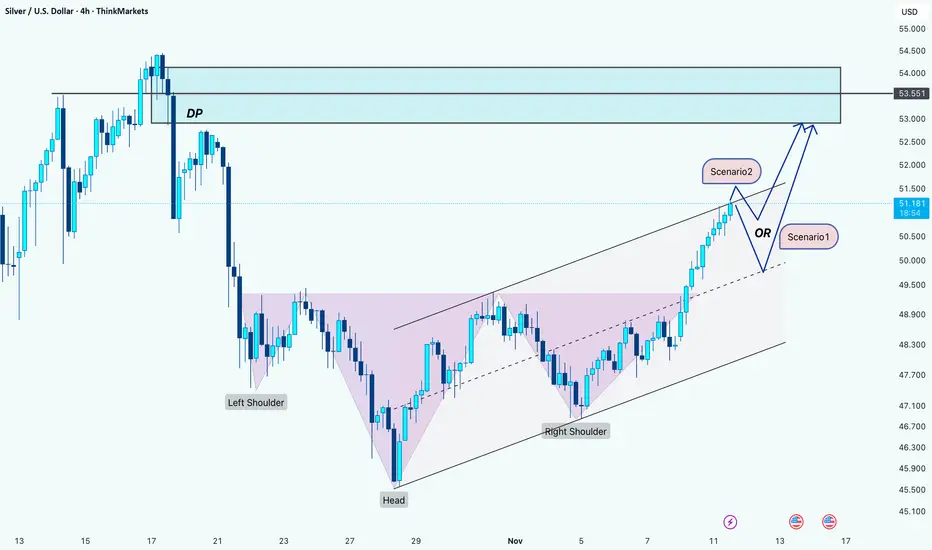
Silver: Approaching Major DP Zone With Two Possible Paths to 53Hi Team!
Silver has completed a clean inverse Head & Shoulders pattern and is climbing steadily within a rising channel. Bullish momentum remains intact as price moves toward the DP (Decision Point) zone, which aligns with a key supply area from the previous breakdown.
As price approaches this zo
Silver.Silver.
Impressive move for today, up over 4% back above $50.
It will have to go up much more, much faster, if $100 is to be breached in early 2026.

Silver Breaks All Levels – New ATH Coming Soon?1. What Happened This Week
Even more aggressive than Gold, Silver delivered an explosive rally, completely blowing past my “normal” target at the 50.50 zone. The move has been vertical, with the metal rising over 10% in just three days — an extremely rare occurrence for a major precious metal.
2.

Silver Price Ready for Lift-Off: Bullish Channel Silver (XAG/USD) is consolidating within a rising channel, with strong Ichimoku cloud support hinting at a potential bullish breakout. After a brief pullback to the lower channel boundary, price action shows signs of rebound momentum targeting the $54 resistance zone. A confirmed break above $53 cou


Possible target of Silver in near future$76 is possible and projected target as per Elliot wave theory where 161% of wave 1. Am I correct or else. Please submit your view also.
Thank you.

SILVER SENDS CLEAR BEARISH SIGNALS|SHORT
SILVER SIGNAL
Trade Direction: short
Entry Level: 4,984.0
Target Level: 4,875.1
Stop Loss: 5,056.8
RISK PROFILE
Risk level: medium
Suggested risk: 1%
Timeframe: 1h
Disclosure: I am part of Trade Nation's Influencer program and receive a monthly fee for using their TradingView charts in my analy

SilverXAGUSD
- Completed " 12345 " Impulsive Waves and " AB " Corrective Wave
- Break of Structure
- Fibonacci Level - 61.80% / 78.60%
- Ascending Triangle as an corrective pattern in Short Time Frame
- Order Block

XAG/USD Set for Decline After Finishing Wave YSilver has completed a clear 5-wave upward move, ending near the 51.23 zone, which likely marks the completion of Wave C of the corrective structure. Price action shows rejection from the upper trendline, signaling that buying momentum is fading. This suggests the start of a new A–B–C corrective dec


See all ideas
Displays a symbol's price movements over previous years to identify recurring trends.