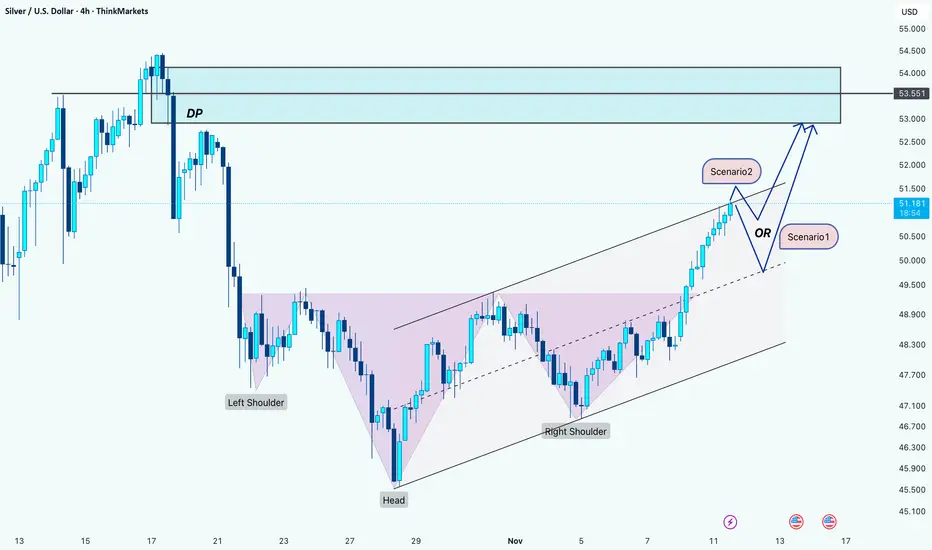
Silver: Approaching Major DP Zone With Two Possible Paths to 53Hi Team!
Silver has completed a clean inverse Head & Shoulders pattern and is climbing steadily within a rising channel. Bullish momentum remains intact as price moves toward the DP (Decision Point) zone, which aligns with a key supply area from the previous breakdown.
As price approaches this zone, two scenarios remain most likely:
Scenario 1:
A rejection from the upper boundary of the channel, leading to a corrective pullback toward the mid-channel or lower trendline, before resuming higher toward the $52.9 target.
Scenario 2:
A shallow pullback or brief consolidation just below the DP zone, followed by bullish continuation that drives price directly into the $52.9 target and possibly beyond.
Regardless of which path plays out, both scenarios point toward the same upside objective at $52.9, as long as the rising channel structure remains intact.
Disclaimer: As part of ThinkMarkets’ Influencer Program, I am sponsored to share and publish their charts in my analysis.
Trade ideas
Silver Price Ready for Lift-Off: Bullish Channel Silver (XAG/USD) is consolidating within a rising channel, with strong Ichimoku cloud support hinting at a potential bullish breakout. After a brief pullback to the lower channel boundary, price action shows signs of rebound momentum targeting the $54 resistance zone. A confirmed break above $53 could trigger an upward move equal to the channel height, continuing the bullish trend. Traders are watching for a breakout confirmation above the midline for a potential long setup.
🧭 Chart Overview
Timeframe: 30-minute chart
Indicator: Ichimoku Cloud (9, 26, 52, 26)
Price: $52.67 (as of the chart time)
Trend Channel: Rising (ascending parallel channel)
---
📊 Price Action Analysis
1. Trend Structure:
The chart shows Silver trading inside a well-defined ascending channel, respecting both upper and lower boundaries.
Price recently bounced off the lower channel support, which often acts as a bullish signal within an ongoing trend.
2. Ichimoku Cloud (Kumo):
The price is hovering around the top of the Ichimoku cloud, suggesting neutral-to-bullish sentiment.
The cloud’s future span (Senkou Span A > Span B) points slightly upward — a sign of potential continuation of the uptrend.
Support lies near the $52.50–$52.60 zone, which aligns with both the lower channel line and the top of the cloud — a strong confluence area.
3. Momentum Observation:
The recent correction looks more like a healthy retracement than a reversal.
Buyers are likely waiting for confirmation before pushing higher.
4. Breakout Levels:
Immediate Resistance: $53.40 (mid-channel + previous top).
Major Resistance: $54.00 (upper channel target).
Support Zone: $52.50–$52.00 (Ichimoku + trendline confluence).
---
🚀 Bullish Scenario
If price closes above $53.40, it would confirm a breakout of the short-term consolidation pattern.
The projected move (based on the channel height) suggests a target near $54.50–$54.60.

Silver.Silver.
Impressive move for today, up over 4% back above $50.
It will have to go up much more, much faster, if $100 is to be breached in early 2026.

Silver Breaks All Levels – New ATH Coming Soon?1. What Happened This Week
Even more aggressive than Gold, Silver delivered an explosive rally, completely blowing past my “normal” target at the 50.50 zone. The move has been vertical, with the metal rising over 10% in just three days — an extremely rare occurrence for a major precious metal.
2. Current Market Context
At the time of writing, Silver is trading directly inside the old all-time-high zone above 54, and the probability of a new ATH being printed soon is very high.
However, as with Gold, trading this kind of momentum with leverage becomes almost impossible. Moves are too fast, volatility is too extreme, and normal risk management gets distorted.
3. Technical Outlook
Technically, Silver is sitting inside major resistance and is clearly overstretched.
But overstretched does not mean it cannot go another 2,000 pips higher before any meaningful correction — the current flow is too strong to underestimate.
Key support levels on the way down:
- 50.50 – first important structural support
- 49.50 – deeper but still valid support
4. Trading Plan
At this point:
- Shorting is pure gambling.
- Buying is also risky — entries are too high and volatility too elevated.
Therefore, the smart trade is to stay patient and simply observe, waiting for a cleaner structure and better levels before participating again.
5. Conclusion
Silver is in a powerful breakout phase, trading inside ATH territory with strong momentum. The trend is bullish, but conditions are extreme, and the best approach now is to stay on the sidelines until the market offers a safer opportunity. ⚡️

Silver $70 targetSilver $70 target. It need to break out of the yellow ascending triangle pattern, maybe by late Nov/early Dec.


SILVER SENDS CLEAR BEARISH SIGNALS|SHORT
SILVER SIGNAL
Trade Direction: short
Entry Level: 4,984.0
Target Level: 4,875.1
Stop Loss: 5,056.8
RISK PROFILE
Risk level: medium
Suggested risk: 1%
Timeframe: 1h
Disclosure: I am part of Trade Nation's Influencer program and receive a monthly fee for using their TradingView charts in my analysis.
✅LIKE AND COMMENT MY IDEAS✅

XAG/USD Set for Decline After Finishing Wave YSilver has completed a clear 5-wave upward move, ending near the 51.23 zone, which likely marks the completion of Wave C of the corrective structure. Price action shows rejection from the upper trendline, signaling that buying momentum is fading. This suggests the start of a new A–B–C corrective decline, where Silver could first drop toward 48–47 levels before any temporary bounce. The overall structure remains bearish in the short term unless the price breaks above the 52.76 invalidation zone. In simple terms: rally looks complete → downside correction likely ahead.
Stay tuned!
@Money_Dictators
Thank you :)

Silver SurferI had this chart published already, it seems it was unpublished, perhaps I violated terms and conditions. Any who, I predict silver will fall. I took a short position at 51.858. Stay tuned.

XAGUSD--Big picture--Possible bullish scenario
--Yearly chart.I dont know the time but 66 USD is quite possible

SIlver (XAGUSD) Next Buying Move SetupIf price fails to break the down-trendline and gives rejection (like bearish candle wick around
This is the first support from your chart.
Strong zone shown in your chart (Support Area).
Reasoning Based on Your Chart
Price is inside a descending triangle/pattern.
Support zone is highlighted below.
A rejection from the trendline gives a safe short entry.
Safe Trading Notes
Wait for confirmation candle at the resistance.
Avoid selling inside the support zone.
Please kindly Support with Boost and Comment i will be Glad i need your valueable feedback

Spot Silver (XAGUSD) Targeting Fresh All-Time HighsSpot Silver (XAGUSD) has mounted a notable recovery following the sharp decline from its all-time high of $54.46 to the $45.40 low registered on 28 October. We interpret this decline as the completion of wave (4) within the broader impulsive structure. While the metal has yet to decisively break above the $54.46 high to fully negate the possibility of a double correction, it currently trades just a few cents below that threshold. Given this proximity, the likelihood of a double correction at this stage appears minimal.
From the wave (4) low, price action has unfolded as a nesting five-wave impulsive sequence. Wave ((i)) concluded at $48.45, followed by a corrective pullback in wave ((ii)) that ended at $47.22. The advance resumed with wave ((iii)) reaching $49.14, while wave ((iv)) retraced modestly to $48.65. The final leg, wave ((v)), terminated at $49.36, thereby completing wave 1 of a higher degree.
Subsequently, a corrective wave 2 developed as a zigzag structure, bottoming at $46.86. The metal has since resumed its ascent in another impulsive nest. From wave 2, wave ((i)) peaked at $54.39. A pullback in wave ((ii)) is currently underway, correcting the cycle from the 5 November low. In the near term, as long as the $45.40 pivot remains intact, dips are expected to attract buyers in 3, 7, or 11 swings, supporting further upside potential.

XAGUSD H | Potential Bearish ReversalMomentum: Bearish
Price is currently reacting off the sell entry, which aligns with the 61.8% Fibonacci retracement and the 161.8% Fibonacci extension.
Sel entry: 50.93
Pullback resistance
61.8% Fibonacci retracement and the 161.8% Fibonacci extension
Stop loss: 52.22
Pullback resistance
Slightly below the 78.6% Fibonacci retracement
Take profit: 49.22
Pullback support
38.2% Fibonacci retracement
Stratos Markets Limited (tradu.com):
CFDs are complex instruments and come with a high risk of losing money rapidly due to leverage. 68% of retail investor accounts lose money when trading CFDs with this provider. You should consider whether you understand how CFDs work and whether you can afford to take the high risk of losing your money.
Stratos Europe Ltd (tradu.com ):
CFDs are complex instruments and come with a high risk of losing money rapidly due to leverage. 70% of retail investor accounts lose money when trading CFDs with this provider. You should consider whether you understand how CFDs work and whether you can afford to take the high risk of losing your money.

Silver Correction Ending: Major Drop AheadSilver (XAG/USD) has completed a 5-wave decline, marking the end of Wave (A)/(1) near the 45.53 level. Since then, price has been retracing upward in a complex W–X–Y corrective structure, which appears to be forming the final leg of Wave (B)/(2). The rise is losing strength near the upper channel, hinting that bulls may soon exhaust. Once Wave (B)/(2) finishes, the next big move is expected to be a strong bearish Wave (C)/(3) decline targeting lower zones near or below 45. In simple terms: last leg of correction nearly done → next big drop ahead.
Stay tuned!
@Money_Dictators
Thank you :)


Possible target of Silver in near future$76 is possible and projected target as per Elliot wave theory where 161% of wave 1. Am I correct or else. Please submit your view also.
Thank you.

SILVER (XAGUSD) | 100-Year Setup Bracing for $3,382 Surge🥈 SILVER | The Supercycle Unfolding — Eyeing $243, Then $3,382 ⚡
Silver has been following a textbook Elliott Wave Supercycle since the 1970s. Wave 1 topped in 1980 near $50, Wave 2 bottomed in 1991 with a deep 0.786 retracement , and since then, we’ve been in a massive Wave 3 that’s still playing out.
Within this ongoing Supercycle Wave 3, we’ve seen five major macro waves:
Wave 1 (1991–1998) – the first impulsive leg.
Wave 2 (1998–2001) – retraced 0.786.
Wave 3 (2001–2011) – the big run to $49.
Wave 4 (2011–2020) – a long 0.5 retracement and re-accumulation phase.
Wave 5 (2020–Now) – the current and final advance of this Supercycle wave.
Inside the current Macro Wave 5 , we’ve already seen Micro 1 top in 2021, Micro 2 bottom in 2022 (0.5 pullback) , and now Micro 3 is underway , targeting the 2.618–3.618 Fib zone ($71–$123) . After that, a Micro 4 correction should follow (around 0.382–0.5), then Micro 5 could push to roughly $243 , which aligns with the 1.618 extension of the entire Supercycle (1)-(2) .
That $243 level may mark the end of Supercycle Wave 3 , setting up for Wave 4 , a long-term correction likely into the $90–$120 rang e (0.382–0.5 retracement). From there, the final Supercycle Wave 5 could begin — a massive impulsive phase aiming for the 2.618 Fibonacci extension near $3,382 🌕
The structure, Fibonacci ratios, and long-term fundamentals all support this roadmap. Industrial demand (solar, EVs, electronics) and ongoing monetary debasement continue to build the fundamental base for a multi-decade silver bull cycle.
📈 We’re in the late stages of Supercycle Wave 3 — and the calm before silver’s next historic acceleration. ⚡
Follow this century-long Silver Supercycle closely — the final wave is unfolding and $3,382 is in sight. Bookmark this idea to track each micro and macro move, and comment your target or thoughts on the Wave 5 breakout. Let’s see who spots the historic setup first!
— Team FIBCOS
#Silver #PreciousMetals #Supercycle #ElliottWave #Fibonacci #MarketStructure #SmartMoneyConcept #LongTermBull #TradingSetup #TechnicalAnalysis #MacroTrend #Commodities

Silver Builds Momentum: Break Above 49.50 in Sight1. What Happened Recently
After rebounding from the 45.50 recent low, Silver rallied strongly into the 49.30–49.50 resistance zone, where it faced short-term selling pressure. A healthy correction followed, taking price back to the 47.00 support area.
2. Market Reaction
From that zone, bulls stepped back in. Since Wednesday last week, the market has been climbing in a constructive and steady manner, suggesting that the correction phase might be complete.
3. Technical Outlook
At the time of writing, Silver is attempting to break above the 49.30–49.50 resistance. If successful, this move could trigger a continuation toward the 50.50 zone, which represents the next meaningful resistance on the chart.
The broader structure remains bullish as long as price stays above 48.00, while dips below 49.00 offer good buying opportunities within the trend.
4. Trading Plan
My preferred approach is to buy dips under 49, with a protective invalidation under 48. First profit targets lie near 50.50, with potential extensions if momentum persists.
5. Conclusion
Momentum has shifted firmly back in favor of the bulls. As long as 48 holds, Silver remains in a bullish phase, and buying dips is the rational play. ⚡️

SilverXAGUSD
- Completed " 12345 " Impulsive Waves and " AB " Corrective Wave
- Break of Structure
- Fibonacci Level - 61.80% / 78.60%
- Ascending Triangle as an corrective pattern in Short Time Frame
- Order Block

SILVER Trading Opportunity! BUY!
My dear subscribers,
My technical analysis for SILVER is below:
The price is coiling around a solid key level - 50.560
Bias - Bullish
Technical Indicators: Pivot Points Low anticipates a potential price reversal.
Super trend shows a clear buy, giving a perfect indicators' convergence.
Goal - 51.903
My Stop Loss - 49.919
About Used Indicators:
By the very nature of the supertrend indicator, it offers firm support and resistance levels for traders to enter and exit trades. Additionally, it also provides signals for setting stop losses
Disclosure: I am part of Trade Nation's Influencer program and receive a monthly fee for using their TradingView charts in my analysis.
———————————
WISH YOU ALL LUCK

SILVER: Bearish Continuation is Highly Probable! Here is Why:
Looking at the chart of SILVER right now we are seeing some interesting price action on the lower timeframes. Thus a local move down seems to be quite likely.
Disclosure: I am part of Trade Nation's Influencer program and receive a monthly fee for using their TradingView charts in my analysis.
❤️ Please, support our work with like & comment! ❤️

From Gold to Silver — The Next Big Move on XAGUSD Following our previous series of Gold analyses, where that massive drop unfolded exactly as projected,
this time we’re turning our focus to Silver (XAGUSD) ⚡️
After completing a clear five-wave decline, Silver has been forming a corrective rally as wave (ii) —and it now seems to be in the final subwaves of this correction.
The market looks ready to kick off wave (iii) to the downside, which is often the most powerful and impulsive leg in the entire sequence! 🔥
📍The current zone is where we expect the correction to end and the main bearish trend to take control once again.
As always, patience and precision matter most here — the next move could define the market’s direction for the coming weeks.
--------------------------------------------------------------------------------------------
🚀 Who am I?
I'm Mahdi, a prop firm trader with 7+ years of experience in technical analysis, mainly focusing on Smart Money Concepts and Elliott Wave theory.
I specialize in delivering high-quality trading signals, market insights, and educational content tailored for serious traders and investors.
📊 My Tools: SMC, Elliott Wave, Fibonacci, Liquidity Grabs, Order Blocks
💼 Prop Challenge Passed: Yes | Funded Account: In Progress
🔗 Follow for consistent updates and trading insights.

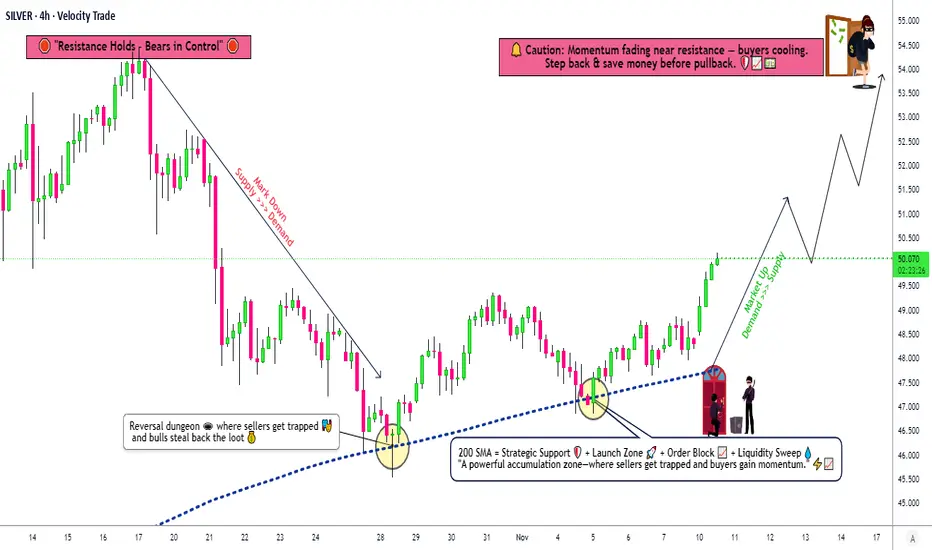
XAG/USD Key Zone Reaction – Are Bulls Ready to Take Control?🥈 XAGUSD: SILVER VS US DOLLAR 💰
Metals Market Opportunity Blueprint | Swing Trade Analysis
📊 MARKET STRUCTURE & SETUP
✅ Current Price Action: $48.34 | 52-Week Range: $28.16 - $54.50
✅ Technical Trend: Bullish Bias Confirmed
✅ Setup Type: Double Pullback Retest of 200 SMA
🎯 THE THIEF STRATEGY: LAYERED ENTRY APPROACH
This is NOT a single entry point strategy. We employ the THIEF LAYERING METHODOLOGY — multiple limit orders positioned at strategic support zones to maximize entry efficiency and reduce average entry price.
📍 ENTRY LAYERS (Buy Limit Orders):
Layer 1: $48.000 ⭐ (Immediate Support)
Layer 2: $48.500 ⭐ (Pullback Zone)
Layer 3: $49.000 ⭐ (Resistance Break)
Layer 4: $49.500 ⭐ (Extended Support)
💡 Pro Tip: You can increase/decrease layers based on your risk tolerance and position size. Accumulate, don't dump!
🛑 STOP LOSS MANAGEMENT
📌 Thief Original SL: $47.000
⚠️ This is MY suggested level based on technical structure
🔴 IMPORTANT: Dear Ladies & Gentlemen (Thief OG's) — Set YOUR OWN stop loss based on YOUR risk profile
💪 This is YOUR money, YOUR risk, YOUR decision
Adjust SL based on your strategy, account size, and risk/reward ratio
🚀 PROFIT TARGET STRATEGY
🎪 Target Zone: $54.000
📈 Technical Basis: 200 SMA acts as strong dynamic resistance
⚡ Market Structure: Overbought territory warning
🔔 Trap Alert: Potential sell-side liquidity trap at resistance
⚠️ Target Notes:
🔴 IMPORTANT: Dear Ladies & Gentlemen (Thief OG's) — Set YOUR OWN take profit target
📊 Don't just copy my TP blindly — analyze price action yourself
💼 You earn the profits, you manage the exit — YOUR choice, YOUR reward
Consider trailing stops or partial profit-taking strategy
🔗 CORRELATED PAIRS TO MONITOR (Key Dollar Pairs)
1️⃣ TVC:DXY (US Dollar Index)
Correlation: INVERSE ↔️ As DXY strengthens, XAG/USD weakens
Why Monitor: Strong dollar headwind for silver prices
Watch Level: DXY above 105.00 = bearish for silver
Strategy: If DXY rallies, reduce silver long positions
2️⃣ $XAU/USD (Gold vs Dollar)
Correlation: POSITIVE ✅ Silver follows gold's lead
Why Monitor: Gold is the "big brother" in precious metals
Watch Level: If gold breaks $2,100, silver likely follows
Strategy: Gold weakness = caution on silver longs
3️⃣ FX:EURUSD (Euro vs Dollar)
Correlation: INVERSE ↔️ Weak dollar = strong euro
Why Monitor: Dollar weakness supports precious metals
Watch Level: EURUSD above 1.1200 = bullish for silver
Strategy: Strong euro environment = tailwind for XAG
4️⃣ FX:USDJPY (Dollar vs Japanese Yen)
Correlation: INVERSE ↔️ Dollar weakness supports risk-on sentiment
Why Monitor: Risk appetite indicator (yen often "fear" currency)
Watch Level: USDJPY below 145.00 = risk-on (silver bullish)
Strategy: Lower USDJPY = better environment for commodities
5️⃣ SP:SPX / S&P 500 Index
Correlation: POSITIVE ✅ Risk-on markets support commodities
Why Monitor: Stock market rallies often lift precious metals
Watch Level: SPX new highs = bullish momentum for silver
Strategy: Market strength = broader bullish sentiment
📋 TRADE CHECKLIST BEFORE ENTRY
✅ Price action confirms double pullback on 200 SMA
✅ DXY showing weakness or neutral bias
✅ XAU/USD supporting bullish thesis
✅ No major macro events in next 4-6 hours
✅ Volume confirmation on breakout
✅ Risk/Reward ratio minimum 1:2
✅ Position size = % of account (YOUR decision)
⚡ KEY TRADING RULES
Layering ≠ Averaging Down Losers
Build positions at PRE-PLANNED levels only
Don't add to losing positions outside your strategy
Stop Loss is Sacred
NO moving stops to breakeven without reason
Protect capital first, chase profits second
Take Profits Strategically
Partial exits: Scale out at resistance zones
Don't go all-in, don't take all-out at once
Dollar Monitoring is Mandatory
Strong DXY = reconsider position
Weak DXY = stay long with conviction
Risk Management Over Everything
Your SL & TP = your rules
No trade is worth emotional decision-making