Silver (XAGUSD) Next Selling Move AnalysisWhat the chart shows
Resistance zone: Around 59.300 – 59.500
Support zone: Around 57.800 – 58.000
Price is currently near 58.94 (according to the screenshot).
The drawn prediction suggests a push up toward resistance, then rejection, then a drop back to support.
Short Idea
The safer short is near the resistance zone.
Entry (Sell)
Around 59.30 – 59.50
(This is where sellers were expected in the chart.)
Stop-loss
Above 59.70
(A breakout above this would invalidate the short setup.)
Take-profit
TP1: 58.50
TP2: 58.00 (support area)
Why this makes sense
Market is moving in a range.
Price often rejects at resistance in a ranging market.
A lower-high pattern is developing, which favors shorting at the top of the range.
Note
For best accuracy, check the live price—if price is already dropping, wait for a pullback before entering.
Trade ideas

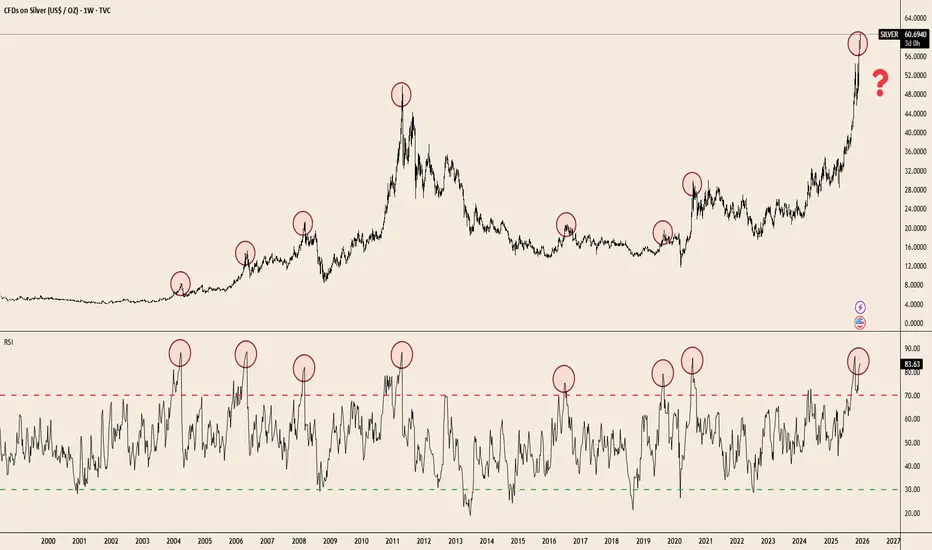
Silver at Extremes: RSI Signals Haven’t Missed in 20 YearsTVC:SILVER has delivered a massive breakout — up +109.9% YTD — but the weekly RSI is now pushing into one of the most extreme zones seen in two decades. Historically, every major spike into the 80–85 RSI band has preceded cooling periods, consolidations, or full reversals.
The chart makes the pattern clear:
• Each parabolic advance since 2004 ended with RSI extremes similar to today.
• Price is testing the same overextension zone seen at the 2011 blow-off top and the 2020 surge.
• Weekly RSI rarely stays above 80 for long — momentum tends to reset before the next leg can form.
This doesn’t guarantee a top.
But when a commodity doubles in a single year and hits long-term RSI ceilings simultaneously, risk/reward becomes asymmetric.
Silver’s trend remains powerful — the question now is how sustainable the slope is.
SILVER Is Very Bearish! Sell!
Please, check our technical outlook for SILVER.
Time Frame: 1h
Current Trend: Bearish
Sentiment: Overbought (based on 7-period RSI)
Forecast: Bearish
The price is testing a key resistance 5,871.4.
Taking into consideration the current market trend & overbought RSI, chances will be high to see a bearish movement to the downside at least to 5,754.1 level.
P.S
Overbought describes a period of time where there has been a significant and consistent upward move in price over a period of time without much pullback.
Like and subscribe and comment my ideas if you enjoy them!

Silver Hits New ATH — Major Reversal Zone Ahead? Bearish SetupSilver( OANDA:XAGUSD ) managed to increase by more than +20% over the last 10 trading days, creating a new All-Time High(ATH) and attracting the attention of many traders in the financial markets.
Silver is currently near Potential Reversal Zone(PRZ) , Yearly Resistance(5), Monthly Resistance(1), and the round number $60.00.
Silver also managed to break the support line, which indicates weakness in the uptrend.
In terms of classic technical analysis, silver managed to rise with the help of the ascending triangle pattern, but we must keep in mind that this pattern is a weak continuation.
In terms of Elliott Wave theory, silver is completing the main wave 5, and this wave could complete at PRZ.
Additionally, we’re noticing a Regular bearish Divergence(RD-) between the price peaks, which adds to the bearish sentiment.
I expect silver to drop to at least $55.10 after breaking the support zone($56.83-$56.37).
First Target: $55.10
Second Target: $53.73
Stop Loss(SL): $61.63(Worst)/$60.54
Do you think silver can go above $60?
💡 Please respect each other's opinions and express agreement or disagreement politely.
📌 Silver/ U.S. Dollar Analyze (XAGUSD), 4-hour time frame.
🛑 Always set a Stop Loss(SL) for every position you open.
✅ This is just my idea; I’d love to see your thoughts too!
🔥 If you find it helpful, please BOOST this post and share it with your friends.

XAG/USD: Major Resistance Cleared, What Comes Next?🥈 XAG/USD — SILVER VS U.S. DOLLAR
Metals Market • Swing / Day Trade Opportunity Guide 🧭📈
⚙️ Market Outlook — Bullish Confirmation
Silver has broken through a major resistance zone, shifting momentum firmly into bullish territory.
This breakout signals the presence of strong buyers stepping in, making the market attractive for both short-term and swing-trade setups.
🎯 Trade Plan
📌 Entry:
Enter at any available level after the confirmed breakout retest.
Bullish continuation patterns are forming, giving us a clean pathway to the upside.
🛡️ Stop Loss — Thief Style SL @ 57.000
Dear Ladies & Gentlemen (Thief OG’s), secure your capital wisely.
Adjust SL according to your personal system, risk appetite, and style.
I do not recommend copying my SL blindly — your strategy = your rules.
🎯 Target — Profit With Precision @ 62.000
We have:
🧱 Strong resistance zone
🔥 Overbought conditions expected
🎭 Potential bull-trap areas above
So escape with profits once the market hits our zone.
Dear Ladies & Gentlemen (Thief OG’s), your TP is also your choice — manage your profits with discipline.
🔗 Correlated & Related Pairs to Watch ($ Versions Included)
Tracking these helps confirm momentum, spot divergences, and follow overall metals sentiment.
1️⃣ XAU/USD (Gold vs USD) — TVC:GOLD
Why watch?
Gold and Silver often move together due to safe-haven demand.
When Gold surges strongly while Silver lags, Silver usually follows.
If Gold rejects from resistance, Silver may also cool off.
Key Point:
Gold strength = higher probability continuation in Silver’s bullish wave.
2️⃣ XAU/XAG (Gold-to-Silver Ratio) — $GoldSilverRatio
Why watch?
A falling ratio means Silver is gaining strength faster than Gold.
A rising ratio signals Silver weakness.
Key Point:
A drop in the ratio supports our bullish Silver narrative.
3️⃣ DXY (US Dollar Index) — TVC:DXY
Why watch?
Silver is priced in USD.
When DXY drops, metals typically rise due to USD weakening.
Key Point:
If TVC:DXY shows bearish momentum → Silver bullish continuation is more confident.
4️⃣ XAG/EUR (Silver vs Euro) — OANDA:XAGEUR
Why watch?
Useful to understand Silver’s global demand, not just USD-denominated.
If Silver is bullish across currencies, then the trend is fundamentally strong.
Key Point:
Multi-currency strength confirms genuine Silver demand.
5️⃣ Copper Futures (HG) — CAPITALCOM:COPPER
Why watch?
Silver has partial industrial demand.
When copper rises, it signals industrial activity strength → bullish for Silver.
Key Point:
Copper strength = supportive macro backdrop for Silver.
🧠 Final Outlook
A clean breakout, supportive cross-metal correlations, and favorable USD weakness give Silver an attractive path toward 62.000.
Trade smart, protect your capital, lock in profits, and execute like true Thief OG’s. 🥷📊

SILVER (XAGUSD) – Short-Term DangerOn Monday, I highlighted something important in my Silver analysis: after a full week of rectangle consolidation, the most probable scenario was an upside break — with a projected target around 61.
I also repeated a point I’ve been making for weeks: Silver continues to look stronger than Gold.
Fast-forward to now:
🔹 That 61 target has been reached
🔹 Silver rallied more than 3,000 pips from the bottom to the high yesterday
🔹 The broader bullish trend is not in question
Let me be very clear: this post is not about denying the bullish structure.
The trend is intact, momentum is real, and a new ATH is absolutely possible.
⚠️ The Warning: A Short-Term Drop Is Becoming Likely
This is a timing post, not a trend post.
If you are a short-term trader and not already long, entering here is pure FOMO — and extremely risky.
Why? Because the market just moved 13,000 pips in 20 days. That is not sustainable without a reset.
Technically, the structure is stretched, and the probability of a corrective move is increasing.
📉 Levels to Watch for a Pullback
- 59 – my base expectation for the next corrective wave
- 55 – not my primary scenario, but absolutely possible considering the size of the latest rally
Neither scenario breaks the bullish trend. These would simply be healthy retracements inside the larger upward trajectory.
📌 Final Thoughts
The trend is bullish.
The long-term outlook is strong.
But the entry right now is terrible unless you're already positioned.
Stay disciplined. Wait for the market to reset.
Silver will offer better opportunities — don’t let FOMO make the decision for you!

XAGUSD--LONG--Long bias
--entry and tp levels are as shown on the chart
--Also check below 12M chart I published before. (I added down below)

Silver Rally Stalls: Correction Zone Targets $59.95📉 Silver Analysis — Pullback Setup Active
Silver has completed a strong breakout from a long consolidation box and pushed into the 61.00–61.40 resistance zone, where bullish momentum is now slowing. The chart shows:
Strong rally channel broken on the upside.
Price stalling at resistance, forming an M-top rejection pattern.
Ichimoku cloud below, offering the next major support zone.
Projected drop targets the 59.90–59.95 area, aligning with the cloud support and previous breakout retest.
🔻 Bearish Expectation
If price continues rejecting around 61.00–61.40, Silver is likely to retrace back to the 59.95 support zone.
📌 Key Levels
Resistance: 61.00 – 61.40
Immediate Support: 60.50
Main Target: 59.95
🎯 Bias: Short-Term Bearish
Momentum is cooling, breakout overstretched, and clouds support the pullback scenario.

Short silver, triple top pattern.Silver is trading at triple top. Has a high chance to return to support at 57. Good feeling about this trade. RRR is at about 1.5

Silver Pauses After ATH RunLast week, silver printed a series of new ATHs.
However, after Monday’s one, each subsequent high was only marginal, and the market shifted into a consolidation box — very similar to gold’s recent price action.
The uptrend is still dominant, but for a new accelerated bullish leg, silver needs a clean break above 59.
If that happens, the measured move points toward a target near 61.
On the downside, if bulls lose control of the 57 zone, the most probable outcome becomes a drop toward 54.
For now, it’s a classic wait-and-see environment.

XAGUSDXAGUSD price could test the 61.98-62.34 level. If the price fails to break through 62.34, a short-term downtrend is likely. Consider selling in the red zone.
🔥Trading futures, forex, CFDs and stocks carries a risk of loss.
Please consider carefully whether such trading is suitable for you.
>>GooD Luck 😊
❤️ Like and subscribe to never miss a new idea!

XAGUSD-SELL weekly chart Reg ChannelSomeone ask me about SILVER. The same situation applies here as GOLD. It is very overbought and way above its reg. channel parameters and should translate into move towards the middle range of this channel.
Strategy SELL @ $ 57-59.50 and take profit near $ 46.00. Eventually we should see below $ 40.00 again.

XAGUSDXAGUSD's trend is still bullish, but if the price fails to break through $64, a short-term pullback is possible. Consider selling in the red zone.
🔥Trading futures, forex, CFDs and stocks carries a risk of loss.
Please consider carefully whether such trading is suitable for you.
>>GooD Luck 😊
❤️ Like and subscribe to never miss a new idea!

Silver Extends Gains as Wave Structure Points HigherSilver broke higher last week sharply and decisively, while gold has not followed to the upside as strongly. However, with the gold–silver ratio falling, silver remains the stronger performer at this stage. Because of this relative strength, the move could be wave (3) of an ongoing five-wave bullish impulse, especially given the strong extension higher and the fact that gold is also approaching an all-time high.
Silver may continue to grind higher, and there appears to be room toward the 261.8% Fibonacci extension and the 68–70 zone to complete a lower-degree impulse within wave (3). Currently it can be trading in subwave 3 with room for more gains, just be aware of subwave 4 pullback before a bullish resumption within subwave 5 of (3).

SilverXAGUSD
- Bullish Channel as an corrective pattern in Short Time Frame
- RSI - Divergence
- Completed " 1234 " Impulsive Waves
- Break of Structure
- S / R Level

XAGUSD – Mid-Term Bullish Structure
After breaking above the $55 resistance and delivering a 100% return in 2025, silver continues to demonstrate strong bullish momentum. As long as price respects its trend structure and progresses toward its predefined targets, the mid-term uptrend remains intact.
Silver to the moon, ASAP.

SILVER (XAGUSD) – Completed Grand Cycle & Super Cycle Wave 5SILVER (XAGUSD) – Completed Grand Cycle (shown in BLACK) & Super Cycle (shown in BLUE) Wave 5
Medium-term Bearish | Immediate Target: 55.20 (Wave A)
Structure: Full Completion of 5-Wave Impulse → Start of Corrective A–B–C
1. Cycle Structure Overview
Your chart clearly shows that Silver has completed a major 5-wave structure at multiple degrees:
Grand Cycle – Wave (I) to (V)
Super Cycle – Wave 1 to 5
Primary Cycle – 1–2–3–4–5 within Super Cycle 5
This kind of multi-frame exhaustion typically leads to a broad and deep corrective structure, usually an A–B–C decline.
The sharp rejection at the top and extended Fib targets also validate the exhaustion of Wave 5.
2. Wave 5 Completion Confirmation
Key observations that confirm the top:
Price hit the 161.8% extension of Wave 3, which often marks terminal fifth waves.
MACD / RSI divergence (visible on lower TFs).
Ending diagonal / rising wedge characteristics in the final sub-wave 5.
Low volume breakout at the extreme top → common in terminal patterns.
Thus, Silver has reached a high-probability major top.
4. How the Full Corrective Pattern Looks (A–B–C)
After completing Wave A:
Wave B
A corrective rise
Could reach 61.8% retracement
Rough target: 58.50 – 59.80 zone
Wave C
A deeper fall
Often equals Wave A
Could test the 50.00–47.00 zone
Your chart correctly shows this deeper C-wave target
Your projected path is consistent with a Zig-Zag (5-3-5) correction, which is the most common after a powerful 5-wave impulse.
Key Levels to Monitor
Resistance (Top Confirmed):
61.50–62.00 region (Wave 5 termination)
Immediate Support:
59.00
57.80
Primary A-Wave Target:
55.20 – 55.50
Medium-term C-Wave Target:
50.00 – 47.00
Conclusion
Silver has completed a multi-degree 5-wave bull cycle and is now entering a corrective A–B–C structure.
The first leg Wave A should be a clear 5-wave decline, targeting 55.20.
Your chart correctly captures:
Cycle completion
Sub-wave termination
Immediate 5-wave bearish setup
Logical targets for A, B, and C
The analysis strongly supports a medium-term bearish phase before the next major accumulation zone.
Disclaimer
This analysis is for educational purposes only and not investment advice. Market conditions vary; please manage risk appropriately.

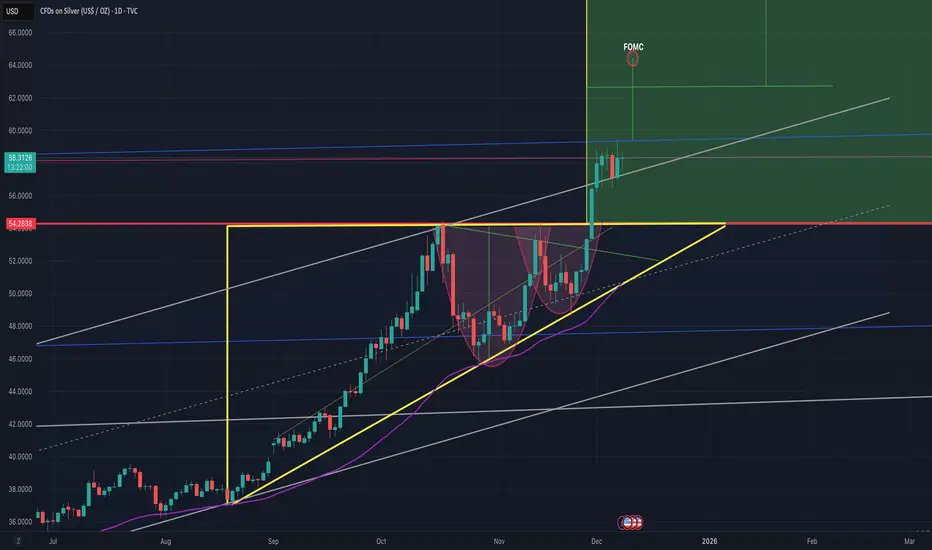
Silver Price Hits Historic Record Around $64Silver Price Hits Historic Record Around $64
On 27 November, we suggested that silver was preparing to challenge its all-time high. Since then (marked with the orange arrow), XAG/USD has risen by roughly 18%, breaking above the psychological $60-per-ounce threshold for the first time in history.
The rally has been driven by strong retail inflows into silver ETFs, alongside expectations of a structural supply deficit by 2026 due to robust industrial demand—particularly from solar energy, electric vehicles, and data-centre infrastructure.
The weakening of the US dollar following the Federal Reserve’s decision on Wednesday also helped lift dollar-denominated silver to a new historic peak near $64.
Technical Analysis of XAG/USD
A review of the XAG/USD chart shows that the price has been moving within a rising channel that encapsulates the uptrend beginning in early September.
Within this structure:
→ the channel median acted as a springboard for price growth on 4 December;
→ the line dividing the upper half of the channel into quarters switched from resistance (earlier in the month) to support on 10 December;
→ silver is now trading near the channel’s upper boundary, which may behave as significant resistance (as it did in mid-October).
Given these factors, the market may now be heavily overheated, leaving it vulnerable to a correction. Should this scenario begin to unfold, we could see a bearish break of the steep upward trajectory that has lifted silver by around 30% from the 21 November low.
This article represents the opinion of the Companies operating under the FXOpen brand only. It is not to be construed as an offer, solicitation, or recommendation with respect to products and services provided by the Companies operating under the FXOpen brand, nor is it to be considered financial advice.


SilverXAGUSD
- Completed " 12345 " Impulsive Waves and " A " Correction Waves
- RSI - Divergence
- Resistance Level
- Break of Structure
- Fibonacci Level - 100.00% / 121.70%

SILVER - The ATH Retest Opportunity!!!🚀Silver has officially broken above its all-time high - a major milestone for the metal. But nothing moves in a straight line, and healthy trends always correct before continuing higher.
📉Price is now on its way to retest the previous ATH zone in red, which aligns perfectly with the rising trendline. This creates a powerful confluence area where buyers have historically stepped back in with strength.
⚔️As Silver taps into this intersection, we will be looking for trend-following longs, expecting the bulls to defend the zone and push toward new highs.
🏹The structure is bullish. The trendline is intact. The level is clean.
Now we wait for the reaction… will the bulls reload here? 🤔
⚠️ Disclaimer: This is not financial advice. Always do your own research and manage risk properly.
📚 Stick to your trading plan regarding entries, risk, and management.
Good luck! 🍀
All Strategies Are Good; If Managed Properly!
~Richard Nasr

Update on Silver's Road Map towards $100.Update on Silver's Road Map towards $100.
Acceleration phase still intact.
Next correction likely starts when we close below that "very steep" line.
Still some play room before Q2 2026 is reached.
