XAGUSD - Signal#XAGUSD - Signal
H4 - Formation of the 3rd wave + breakout of the trend line. Stop behind the high of the 2nd wave.
Entry: 48.19986
TP: 47.19755 - 46.35812 - 44.82284 - 43.16576
Stop: 49.15511
Trade ideas

SILVER USDHI GUYS,
CORRECTION AND UPDATE ON SILVER TECHNICAL
We are bullishly moving through the SIGNAL BOX H8,H4,H6.

Long-Term Silver Analysis with 100% SensitivitySilver has shown a strong and steady upward trend with no major price drops. This reflects growing industrial demand, investor confidence, and the metal’s unique position as both a precious and industrial asset. So far, this analysis has proven to be the most accurate and successful among long-term forecasts.
Sasha charkhchian

Silver - 6-month analysis and resultsThe strength of the price movement in silver has continued to increase since the 6-month analysis was sent for it, because this price analysis was done at the stop of the price movement, and with this increase in the price of silver and all metals in the financial markets, the price will increase.
Sasha Charkhchian

Silver sideways consolidation capped at 4980Silver remains in a bullish trend, with recent price action showing signs of a corrective pullback within the broader uptrend.
Support Zone: 4737 – a key level from previous consolidation. Price is currently testing or approaching this level.
A bullish rebound from 4737 would confirm ongoing upside momentum, with potential targets at:
4980 – initial resistance
5066 – psychological and structural level
5166 – extended resistance on the longer-term chart
Bearish Scenario:
A confirmed break and daily close below 4737 would weaken the bullish outlook and suggest deeper downside risk toward:
4667 – minor support
4600 – stronger support and potential demand zone
Outlook:
Bullish bias remains intact while the silver holds above 4737. A sustained break below this level could shift momentum to the downside in the short term.
This communication is for informational purposes only and should not be viewed as any form of recommendation as to a particular course of action or as investment advice. It is not intended as an offer or solicitation for the purchase or sale of any financial instrument or as an official confirmation of any transaction. Opinions, estimates and assumptions expressed herein are made as of the date of this communication and are subject to change without notice. This communication has been prepared based upon information, including market prices, data and other information, believed to be reliable; however, Trade Nation does not warrant its completeness or accuracy. All market prices and market data contained in or attached to this communication are indicative and subject to change without notice.

Ichimoku Insight: “Run Through Clouds” Buy SignalWhen price breaks above the cloud and the lagging line (Chikou Span) confirms by staying above both price and cloud, it’s not just bullish—it’s historically strong.
✅ Price above cloud
✅ Cloud green and rising
✅ Lagging line above price and cloud
✅ Tenkan-Sen > Kijun-Sen
This setup blends momentum with confirmation. Ideal for traders who value clarity, structure, and risk awareness.
🔍 Always wait for candle close.
🛡️ Use the cloud as dynamic support.
📉 Risk management isn’t optional—it’s strategy.
#TechnicalAnalysis #Ichimoku #TradingStrategy #RiskManagement #STAeducation

XAG/USD Analysis: Price Stabilises Below the Psychological LevelXAG/USD Analysis: Price Stabilises Below the Psychological Level
October proved exceptionally volatile for the silver market — the price broke past a historical record, climbing above $50. However, after widespread profit-taking, the market reversed downward.
XAG/USD is currently influenced by several factors:
→ prospects for Federal Reserve policy;
→ the easing of trade tensions between the United States and China;
→ the potential government shutdown and related news.
As indicated by the ATR indicator, volatility is declining — suggesting that supply and demand forces may be finding a balance.
Technical Analysis of the XAG/USD Chart
The broad upward channel remains intact, though it is worth noting that its median line has shifted from acting as support to serving as resistance.
From a bullish perspective:
→ the lower boundary of the channel acts as strong support;
→ the bullish A-B-C-D structure indicates that demand is recovering.
From a bearish perspective: if the silver price continues to rise, it will face resistance at:
→ the psychological $50 mark;
→ the 21 October drop zone, where selling pressure previously dominated.
Given the above, it is reasonable to assume that:
→ in the near term, the price may consolidate around the QL line;
→ if bearish momentum resumes, the alternative downward channel (shown in red) will gain relevance.
This article represents the opinion of the Companies operating under the FXOpen brand only. It is not to be construed as an offer, solicitation, or recommendation with respect to products and services provided by the Companies operating under the FXOpen brand, nor is it to be considered financial advice.

XAGUSD - Silver BUY CAPITALCOM:SILVER
Previously, Silver had a huge selloff, but on October 28, price on Daily timeframe tapped into 50 EMA, created a doji candle and failed to make LL to support continuing sell bias
Price on 1H, 4H, and Daily timeframe are all trading above EMA50
4H making HH-HL and recently broke above major resistance at 48.6, where bearish momentum appeared to sit at.
After breaking above said resistance, price came up and created a HH, then came down to retest the same resistance thats now reacting as support.
While doing so, price came down and tapped into the 50% Fib area, which was also where the previous HH was at, and price then created a strong bullish candle on 4H rejecting that same level.
Scaling down to 1H we can see the 1H candle that closed above a minor pullback LH structure and is also where the 4H closed at. I consider that 1H candle my entry and targeting either -62% Fib or another major resistance at 52.338 .

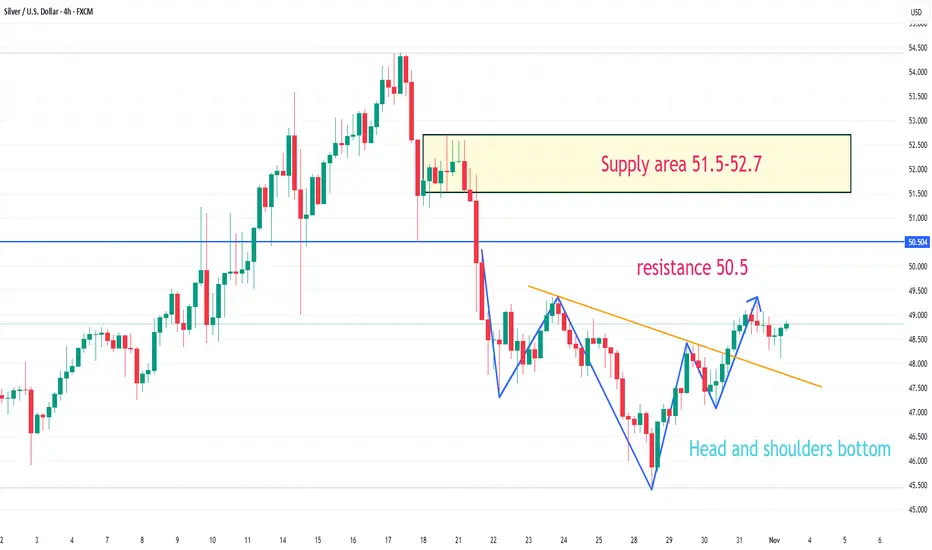
XAGUSDThe 49-49.5 level seems to be a very strong resistance for silver... After the structure changes from bullish to bearish, clear targets are available in the picture.

XAGUSD has formed a head and shoulders bottom patternOn the 4-hour chart, XAGUSD has formed a head and shoulders bottom pattern. Currently, watch for resistance around 49.4; a break above this level could lead to further upward movement, with resistance around 50.5, and further upside potential in the 51.5-52.7 area after that.
xagusd 1h🔹 Overall Outlook and Potential Price Movements
In the charts above, we have outlined the overall outlook and possible price movement paths.
As shown, each analysis highlights a key support or resistance zone near the current market price. The market’s reaction to these zones — whether a breakout or rejection — will likely determine the next direction of the price toward the specified levels.
⚠️ Important Note:
The purpose of these trading perspectives is to identify key upcoming price levels and assess potential market reactions. The provided analyses are not trading signals in any way.
✅ Recommendation for Use:
To make effective use of these analyses, it is advised to manually draw the marked zones on your chart. Then, on the 5-minute time frame, monitor the candlestick behavior and look for valid entry triggers before making any trading decisions.

SILVER Technical & Order Flow AnalysisOur analysis is based on a multi-timeframe top-down approach and fundamental analysis.
Based on our assessment, the price is expected to return to the monthly level.
DISCLAIMER: This analysis may change at any time without notice and is solely intended to assist traders in making independent investment decisions. Please note that this is a prediction, and I have no obligation to act on it, nor should you.
Please support our analysis with a boost or comment!

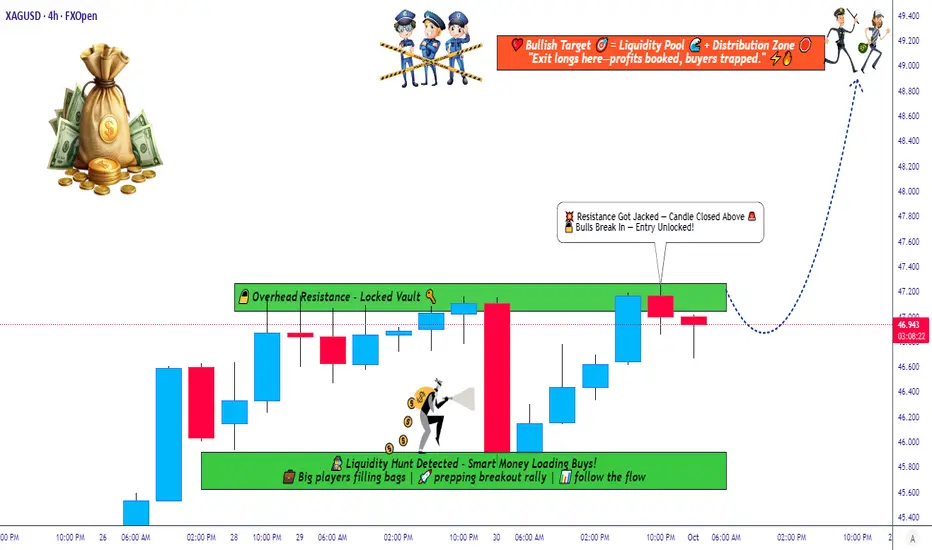
Silver Strategy Map — Thief Layers, Smart Targets, and Risk Zone📊 XAG/USD “Silver vs U.S Dollar” — Metals Market Wealth Strategy Map (Swing/Day Trade)
🔑 Plan: Bullish Setup
This setup follows the “Thief Strategy”, which means using layered limit entries to scale into the trade. Instead of going all-in at one level, we “steal the entries” across multiple layers.
💰 Layered Buy Limit Entries (Example Setup):
46.200
46.400
46.600
46.800
47.000
👉 You can increase layers as per your own plan and risk style.
🛑 Stop Loss (Protective Exit): 45.600
(This is my thief SL — but you’re free to adjust as per your own risk appetite.)
🎯 Target Zone: 49.000
⚠️ Around 49.300, we see a “Police Barricade” (heavy resistance + overbought conditions + potential trap).
That’s where profits should be taken — escape with gains before the trap closes!
Why This Setup?
Support Zones: Strong accumulation zones forming near 45.600–46.000.
Trend Bias: Silver remains bullish in the medium-term metals market outlook.
Layering Strategy Advantage: Reduces entry risk and allows better average fill.
Profit Zone: 49.000 aligns with strong supply area + RSI extension risk.
🔗 Correlation & Related Pairs to Watch
OANDA:XAUUSD (Gold vs USD): Gold often leads Silver’s moves — watch Gold for early signals.
TVC:DXY (US Dollar Index): A weaker USD usually boosts metals.
TVC:PLATINUM & CAPITALCOM:PALLADIUM : Industrial metals correlation — strong moves here can influence Silver sentiment.
TVC:SILVER Futures: Always track COMEX Silver contracts for volume confirmation.
✨ “If you find value in my analysis, a 👍 and 🚀 boost is much appreciated — it helps me share more setups with the community!”
📌 Disclaimer: This is a Thief-style trading strategy, created just for fun and educational sharing. Not financial advice — trade at your own risk.
#XAGUSD #Silver #Metals #TradingStrategy #SwingTrade #DayTrade #ThiefStrategy #Gold #DXY #Forex #Commodities
Market Insight: Silver’s Next Move Hinges on MA Breakout!🎯 XAG/USD: The Great Silver Heist - Bearish Breakout Setup! 💰
📊 ASSET OVERVIEW
Pair: XAG/USD (Silver vs U.S. Dollar)
Market: Precious Metals
Strategy Type: Swing/Day Trade
Bias: 🐻 BEARISH
🎭 THE HEIST PLAN (Trading Setup)
🔴 Entry Zone: The Breakout
Level: $49.50 (MA Breakout Zone)
Signal: Waiting for price to break below moving average support
Confirmation: Clean break with volume + momentum shift
🛑 Stop Loss: The Safety Vault
Level: $52.00
Purpose: Protection for potential pullback scenarios
Note: This SL accommodates a possible bounce before continuation down
⚠️ Risk Disclaimer: Fellow traders, this stop loss is MY risk tolerance. YOU decide your own risk parameters. Trade what YOU can afford to lose. Your money, your rules! 🎰
🎯 Target: The Escape Route
Primary Target: $47.00
Why This Level?
🚧 Strong resistance zone acting as support (role reversal)
📈 Overbought conditions on lower timeframes
Potential bull trap zone - perfect profit extraction point
⚠️ Profit Disclaimer: This is MY target based on MY analysis. YOU make your own profit decisions. Lock gains when YOUR strategy says so. Always secure the bag at YOUR comfort level! 💼
🔍 TECHNICAL ANALYSIS BREAKDOWN
Key Factors:
Moving Average Breakdown - Price rejecting MA as new resistance
Market Structure - Lower highs forming on H4/D1 timeframes
Resistance Cluster - Multiple confluences at $52 area
Volume Profile - Decreasing buy pressure
What I'm Watching:
📉 Sustained close below $49.50
📊 Volume confirmation on breakdown
🕒 Time alignment with USD strength cycles
💱 RELATED PAIRS TO MONITOR (Correlation Watch)
Metals Family:
XAU/USD (Gold) - Moves in tandem with silver ~70% correlation
GC1! (Gold Futures) - Leading indicator for precious metals sentiment
HG1! (Copper Futures) - Industrial metals correlation
USD Strength Plays:
TVC:DXY (Dollar Index) - Inverse correlation with metals
FX:EURUSD - Risk-on/risk-off sentiment gauge
FX:USDJPY - Safe haven flow indicator
Key Point: When DXY 📈 = Precious metals 📉 typically. Watch Fed policy signals and real yields for directional bias!
🎪 THE "THIEF STYLE" STRATEGY PHILOSOPHY
This setup follows the "steal profits when the market sleeps" approach:
🎯 Identify overextended moves
⏰ Wait for breakout confirmation
💨 Execute with precision
🏃 Escape before the reversal
It's all about timing, patience, and taking what the market gives!
Conduct your own research (DYOR)
Use proper risk management
Never risk more than you can afford to lose
Consider consulting a licensed financial advisor
💼 No Guarantees: No trading outcome is guaranteed. Markets are unpredictable. Trade responsibly!
📢 ENGAGEMENT FOOTER
✨ "If you find value in my analysis, a 👍 and 🚀 boost is much appreciated — it helps me share more setups with the community!"
🏷️ HASHTAGS
#XAGUSD #Silver #PreciousMetals #BearishSetup #SwingTrading #DayTrading #ForexTrading #MetalsTrading #TechnicalAnalysis #BreakoutStrategy #SilverTrading #USD #DXY #ForexSignals #TradingIdeas #ChartAnalysis #PriceAction #RiskManagement #ForexCommunity #TradingView #MarketAnalysis
🎬 End of Analysis | Trade Safe, Trade Smart! 🎬

SILVER My Opinion! SELL!
My dear friends,
Please, find my technical outlook for SILVER below:
The price is coiling around a solid key level - 48.678
Bias - Bearish
Technical Indicators: Pivot Points Low anticipates a potential price reversal.
Super trend shows a clear sell, giving a perfect indicators' convergence.
Goal - 47.933
About Used Indicators:
The pivot point itself is simply the average of the high, low and closing prices from the previous trading day.
Disclosure: I am part of Trade Nation's Influencer program and receive a monthly fee for using their TradingView charts in my analysis.
———————————
WISH YOU ALL LUCK

XAGUSDHow to become successful in forex and stock trading:
1.Master fundamentals and technical analysis.
2.Build and follow a solid trading plan.
3.Apply strict risk management (4–6% rule).
4.Stay disciplined—control fear and greed.
5.Record and analyze every trade.
6.Focus on high-quality setups only.
7.Diversify across assets and markets.
8.Keep evolving—study, adapt, and grow daily.

Silver is in the Bullish directionHello Traders
In This Chart XAGUSD HOURLY Forex Forecast By FOREX PLANET
today XAGUSD analysis 👆
🟢This Chart includes_ (XAGUSD market update)
🟢What is The Next Opportunity on XAGUSD Market
🟢how to Enter to the Valid Entry With Assurance Profit
This CHART is For Trader's that Want to Improve Their Technical Analysis Skills and Their Trading By Understanding How To Analyze The Market Using Multiple Timeframes and Understanding The Bigger Picture on the Charts

SILVER: Long Trading Opportunity
SILVER
- Classic bullish setup
- Our team expects bullish continuation
SUGGESTED TRADE:
Swing Trade
Long SILVER
Entry Point - 48.678
Stop Loss - 48.476
Take Profit - 49.035
Our Risk - 1%
Start protection of your profits from lower levels
Disclosure: I am part of Trade Nation's Influencer program and receive a monthly fee for using their TradingView charts in my analysis.
❤️ Please, support our work with like & comment! ❤️

XAGUSD, Silver , Parabolic move aheadSilver-XAGUAD after breaking past previous ATH, retested and formed a bullish candle on weekly timeframe. Expecting new high and target or 68-70 by end of year or before.
If you like this idea, do share and boost. :)

SILVER 4H - double top before the dropAfter a strong rally, silver retested the 49.0–49.5 area aligning with the key 0.618 Fibonacci level. On the 4H chart, we see a clear double-top pattern with falling volume and oscillator divergence. Price already broke below the short-term trendline and failed to hold above resistance - a classic sign of fading bullish momentum.
Fundamentally, silver faces pressure as the dollar stabilizes and rate-cut expectations fade. Industrial demand from Asia is cooling too, reducing the “safe-haven” appeal.
Tactically, while price stays below 49.5, the path of least resistance is down toward 43.8 and possibly 41.1 - key accumulation zones. A breakout above 50.0 would cancel the bearish setup.
Every silver rally ends the same way - right when everyone starts to believe it’ll never end.

Xagusd Trade idea Following price action.
Price came into our H4 POI with a shift of structure on the M15.
What I'm looking for is sell in the upcoming week.
Pipful week ahead.


SILVER-BULLISH POTENTIAL ZONESILVER has shown bullish momentum as it has retraced to 0.5-0.6 fib level and made a falling wedge with a bullish divergence .
