XAGUSD: countertrend setup🛠 Technical Analysis: On the 1-hour timeframe, Silver (XAGUSD) is forming a classic "Head and Shoulders" reversal pattern, signaling a potential shift from the recent uptrend to a bearish correction. Price is currently testing the critical neckline support around 56.600; a confirmed breakdown below this level would validate the pattern. The projected trade aims for a decline toward the confluence of the ascending trendline and the 100 SMA near the 54.750 support zone.
🌍 Fundamental Analysis: The metal is facing selling pressure as traders book profits ahead of crucial US economic data due this week, specifically the ISM Services PMI and the Non-Farm Payrolls (NFP). Market sentiment suggests that any signs of resilience in the US labor market could bolster the Dollar and bond yields, thereby weighing on non-interest-bearing assets like Silver. Additionally, year-end portfolio rebalancing in December often triggers volatility and corrective moves in commodities.
❗️ Trade Parameters (SELL) ❗️
➡️ Entry Point: Sell on breakdown of the neckline support (approx. 56.300 – 56.600)
🎯 Take Profit: 54.059
🔴 Stop Loss: Above the right shoulder resistance (approx. 57.903)
⚠️ Disclaimer: This is a potential trade idea based on current analysis; market conditions and price direction are subject to change based on news factors and volatility.
Trade ideas

Silver trying to break 45 YEARS horizontal resistance at $54 !!!Silver trying to break 45 YEARS horizontal resistance at $54 today !!! I made a prediction it would reach $54 by 26 Nov, but didn't quite there yet. Once $54 resistance is broken, silver will revalue itself between $100-$200 within 2 quarters. It's going to be an epic jaw dropping move.
Don't leverage/trade with margin... silver short term volatile moves will wipe you off financially for good. Buy the real bullion or ETF long term. Good luck silver stackers...

'Cinderella Gold' Episode 2 — Silver is Not Waiting Anymore 'Cinderella Gold' Episode 2 — Silver is Not Waiting Anymore 👑
Once upon a breakout… 📈
Back in March 2023, I dropped “Cinderella Gold Ready to Shine” — a bold claim that silver would rise from the shadows while the world watched only gold.
Fast forward to today — Silver (XAGUSD) is above $53 , and this chart doesn’t lie.
The forgotten sister of gold is no longer waiting for a dance…
She’s leading the entire ballroom now.
💥 Key Technical Levels
• $50.03 — now confirmed as new support
• $60.58 — next resistance / golden ratio (.618 fib)
• $73.24 — the “New Target” zone
• Ultimate fib expansion? $80+ is not fiction if momentum continues 🔭
This isn’t some one-day wonder. This is the result of 10+ years of structural consolidation breaking wide open.
And if you still think silver is a sidekick, you’re not reading the right story.
🧪 Why Now? The Tech-Silver Symbiosis
Most forget this:
Silver outperforms gold when technology is booming.
Why? Because unlike gold, silver isn’t just money — it’s semiconductors, solar panels, EV batteries, AI chips and the future of industry itself.
• 💻 Tech bull cycle → industrial demand skyrockets
• 🔋 Green energy transition → silver becomes critical infrastructure
• 🛠️ The macro tailwind + physical scarcity = explosive upside
🧠 Food for Thought 🍃
When tech runs hot, silver runs hotter.
It’s the metal that reflects not just fear — but progress.
Gold is the vault.
Silver is the spark.
One Love,
The FXPROFESSOR 💙
⚠️ Disclaimer
Disclaimer: These are my personal thoughts on the market. They are not financial advice. Every trade is your responsibility. Manage your risk and protect your capital.

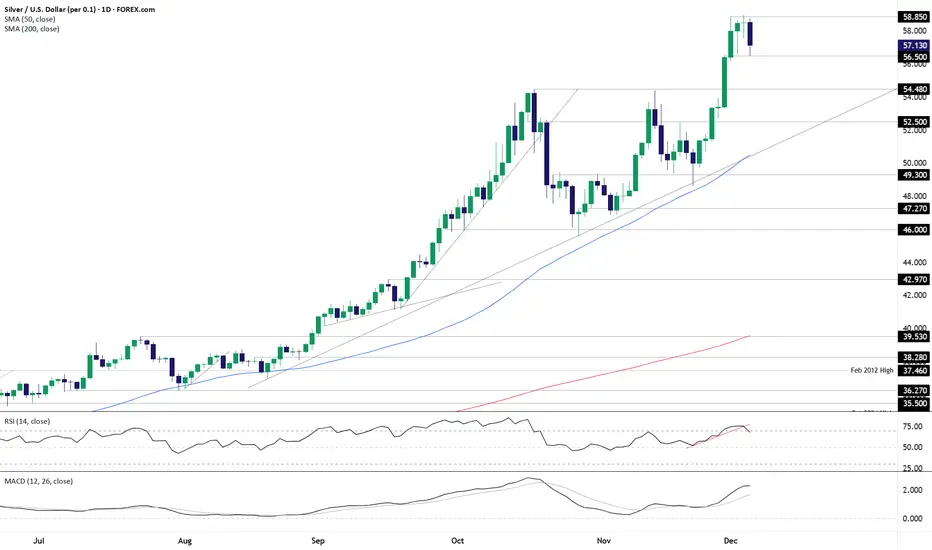
Three candles, one message: Bulls bewareSilver has completed a three-candle evening star pattern following a sharp run higher, warning of bearish reversal risk. However, before acting on the signal, it would be preferable to see the price push below $56.50 before considering short setups, providing a level where a stop could be placed above it for protection against reversal.
Downside targets to consider include $54.48, $52.50 or August uptrend support/50DMA, the latter found today at $50.48.
RSI (14) has broken its uptrend and is curling over but remains above the neutral 50 level, indicting waning upside strength. MACD provides a similar message, beginning to curl over towards the signal line while remaining firmly in positive territory. It’s not a bearish picture being provided by the oscillators, but it does provide a reason for bulls to be cautious around these levels.
While the option is there to act immediately on the bearish signal and initiate shorts at current levels, given the bullish frenzy seen in silver over recent months, risk management looms as particularly important for anyone considering bearish setups.
Good luck!
DS
SILVER AT MULTI DECADE HIGHSilver has broken 46 years high one can go long with target of 85 with stop 45.
SILVER USDHI GUYS
I have stopped trading silver until it rallies all the way up to area of interest as illustrated.
NOTE . this was due to a false price pattern i posted last week.
i have to know every move before it happens once an error occurs then i make correction or wait for a few months to edit the trading future script on 6 month 12 month and 24 months

SILVER USDHI GUYS,
well yesterday sells were rejected as there was no entry due to a sudden growth or bullish move.
Today i expect sell soon.
There is a (possible) repetition of the same structure only this time it has to sell on a Wednesday (wed) in 2weeks time.

Silver potential drop incoming?Silver came to within whiskers of reaching $59, before easing lower in the last couple of days, and it is now disapplying a potential H&S pattern on the hourly. If the pattern's neckline at 56.45-56.50 area breaks, then we could potentially see a quick drop to the next support which comes in between $53.90 to $54.48. Within this zone, $54.22 is an interesting H1 level to watch for a potential bounce should we get to it.
By Fawad Razaqzada, market analyst with FOREX.com

XAG/USD : Bearish Pullback Meets Bullish Reversal at Key DemandXAG/USD 30-Minute Chart Analysis: Bearish Pullback Meets Bullish Reversal Signals at Key Demand Zone
This TradingView chart, authored by GoldMasterTrades on December 4, 2025, at 13:49 UTC-5, depicts the XAG/USD (Silver/US Dollar) pair on a 30-minute timeframe. It illustrates intraday price action spanning approximately December 2 to December 6, 2025, based on the x-axis timestamps (from 21:00 on Dec 2 through 12:00 on Dec 6). The candlestick format highlights a recent downtrend amid high volatility, with annotations pointing to a potential bullish turnaround. At the time of the snapshot, XAG/USD is quoted at 57.319, with a high of 57.424, low of 57.186, close of 57.234, marking a decline of -0.085 (-0.15%) and robust volume of 19.61K.
The overall narrative captures silver's volatile nature in late 2025, where the metal has surged over 83% year-to-date amid supply fears and industrial demand, but now faces short-term corrective pressure. The chart shows a sharp sell-off from highs near 58.00, probing a reversal zone around 57.20, accompanied by a volume burst and pattern bust—classic signs of exhaustion and impending recovery. This setup aligns with broader market dynamics, where silver recently hit record highs above $58.85 before pulling back. Below, I'll dissect the chart in a professional TradingView idea style, incorporating technical details, fundamentals, and trader insights for comprehensive depth.
Chart Overview and Timeframe Context
The 30-minute chart provides granular insights into short-term momentum, perfect for day traders navigating silver's sensitivity to USD strength, interest rates, and commodity cycles. XAG/USD, often correlated with gold but amplified by industrial uses (e.g., solar panels, electronics), has been in a parabolic uptrend throughout 2025, breaking all-time highs amid global supply constraints.
Key visual components:
Candlesticks: A series of red bearish bodies dominate the left and center, indicating seller control, with increasing wick lengths signaling volatility. Recent candles at the bottom show smaller bodies and longer lower shadows, hinting at buyer defense.
Annotations:
Green horizontal band: "Reversal Zone - Demand Zone" around 57.00–57.20, with a green circle marking the pivot low.
Purple label: "Volume Burst" at the trough, denoting a surge in activity.
Black upward arrow and label: "Pattern Bust," suggesting a failed bearish continuation.
"Ask" in red at 57.436 and "Bid" in blue at 57.237, reflecting the current spread.
U.S. flag and lightning icons at the bottom, likely indicating U.S. data releases (e.g., ahead of key jobs data).
Price Scale: Y-axis from ~56.00 to 59.00, with the action centered around 57.00–58.00, a psychologically significant area post-recent highs.
This configuration screams "bull trap reversal": bears push aggressively lower, but high-volume absorption at support sets the stage for a squeeze higher.
Technical Analysis: Patterns and Indicators
From a pure price action lens, the chart reveals a corrective pullback within a larger uptrend, with reversal cues emerging:
Downtrend Structure: The left side features a topping pattern with lower highs from ~58.50, cascading into a steep decline of about 1.5% (over 80 pips). This forms a descending channel, with red candles exhibiting long upper wicks—evidence of rejection at resistance. The move likely triggered by profit-taking after silver's explosive rally to $58.85 earlier in the week.
Reversal Zone and Demand Dynamics: The green band (57.00–57.20) represents a high-probability demand zone, where prior support (possibly from 4H/ daily charts) intersects with Fibonacci levels (e.g., 38.2% retracement of the recent leg up). Price tagging this area with a "Volume Burst" indicates capitulation: sellers exhaust, and institutions accumulate. In ICT/SMC frameworks, this is a liquidity sweep followed by order block defense.
Volume Burst and Momentum Shift: The purple annotation highlights a spike in volume (19.61K overall, but localized burst at lows), a bullish divergence signal. High turnover at extremes often precedes reversals, as it reflects panic selling absorbed by smart money. If overlaid with RSI (implied but not shown), expect oversold readings rebounding above 30.
Pattern Bust Mechanics: The "Pattern Bust" label with an upward arrow points to a failed bearish setup—likely a flag or head-and-shoulders continuation. Instead of breaking lower, price rejects the zone and forms a potential hammer/doji, trapping shorts and fueling a short-covering rally. A close above 57.50 would confirm the bust, targeting prior highs.
Key Levels and Projections: Support holds at 57.00 (zone low), with resistance at 57.80 (mid-channel) and 58.00 (psychological). Upside extensions could reach 58.50–58.90, aligning with record highs. Downside risks if the zone fails: 56.60–56.00, as noted in recent analyses.
This technical picture favors bulls if confirmed, but silver's volatility demands caution—average true range (ATR) likely elevated post-surge.
Fundamental Context for XAG/USD
Silver's 2025 performance has been stellar, up over 83% YTD driven by industrial demand (e.g., green energy) and supply fears, but December 4 sees a 1.67% dip to 57.51 amid USD rebound and data anticipation. Key drivers include:
Supply Constraints: Growing fears of shortages have propelled prices, with analysts eyeing $60+ long-term.
Economic Data: Pullback tied to rejection at $58.90 ahead of U.S. jobs data, which could influence Fed rate cut expectations.
Market Sentiment from X: Recent posts show mixed views—bullish on record breaks (e.g., "Ons Gümüş 58.8$ seviyesiyle tüm zamanların rekorunu kırdı") but bearish targets to 53-54$ if downside accelerates. Traders signal buys on H1 timeframes if 57.52 holds, or shorts on breaks. Elliott Wave forecasts suggest more upside post-correction.
Cross-reference with economic calendars: Watch NFP or inflation prints for volatility spikes.
Trade Idea: Bullish Reversal Setup with High R:R Potential
Capitalizing on the chart's signals:
Entry: Long on confirmation above 57.40 (breaking the downtrend line), or dip-buy in the reversal zone with volume support.
Stop Loss: Below the demand low at 56.90, risking 30–50 pips.
Take Profit: TP1 at 57.80 (prior resistance), TP2 at 58.50 (recent highs), TP3 at 59.00+ if momentum builds. Trail stops using 30-min ATR.
Risk-Reward Ratio: 1:2 minimum—aim for 60–100 pips upside.
Alternative: Short on zone failure below 57.00, targeting 56.60.
Timeframe Fit: Suited for intraday (2–8 hours), aligning with London/NY sessions.
This idea leverages SMC concepts like order blocks and liquidity grabs for edge.
Risk Management and Trader Mindset
Silver's leverage amplifies risks—volatility can wipe accounts without discipline. Core principles:
Position Sizing: Risk 0.5–1% per trade; use calculators to scale based on stop distance.
Emotional Control: Don't chase—wait for pattern bust confirmation to avoid whipsaws. Journal setups for review.
Multi-Timeframe Validation: Check 1H/4H for uptrend intact; avoid trading during low-liquidity hours.
Broader Mindset: View pullbacks as opportunities in bull markets. Study historical silver zones (e.g., 2021 surge) for patterns. Continuous education via webinars or X communities enhances edge.
Cautionary Note: Fundamentals like Fed policy can override techs—trade with news filters.
In summary, this 30-minute XAG/USD chart signals a high-conviction bullish reversal amid a corrective dip, with volume and structure supporting upside. If validated, it could propel silver back toward $58–60 resistance. Monitor real-time developments on TradingView or reliable platforms. Trade responsibly.

Silver Historical High - intraday Analysis 01-Dec-2025Silver prices reached a new all time high supported by several fundamental factors:
* Fed rate cut expectations which are currently at 90% that we will have rate cut in Dec-25 meeting.
* Demand on Silver especially that its used in production related to technology and AI.
In this video, we mark several area of interest we will be monitoring in the upcoming days/weeks.
Disclaimer: easyMarkets Account on TradingView allows you to combine easyMarkets industry leading conditions, regulated trading and tight fixed spreads with TradingView's powerful social network for traders, advanced charting and analytics. Access no slippage on limit orders, tight fixed spreads, negative balance protection, no hidden fees or commission, and seamless integration.
Any opinions, news, research, analyses, prices, other information, or links to third-party sites contained on this website are provided on an "as-is" basis, are intended only to be informative, is not an advice nor a recommendation, nor research, or a record of our trading prices, or an offer of, or solicitation for a transaction in any financial instrument and thus should not be treated as such. The information provided does not involve any specific investment objectives, financial situation and needs of any specific person who may receive it. Please be aware, that past performance is not a reliable indicator of future performance and/or results. Past Performance or Forward-looking scenarios based upon the reasonable beliefs of the third-party provider are not a guarantee of future performance. Actual results may differ materially from those anticipated in forward-looking or past performance statements. easyMarkets makes no representation or warranty and assumes no liability as to the accuracy or completeness of the information provided, nor any loss arising from any investment based on a recommendation, forecast or any information supplied by any third-party.
Risk Warning: 74% of retail investor accounts lose money when trading CFDs with this provider. You should consider whether you can afford to take the high risk of losing your money. Please refer to our full risk disclaimer on our website.

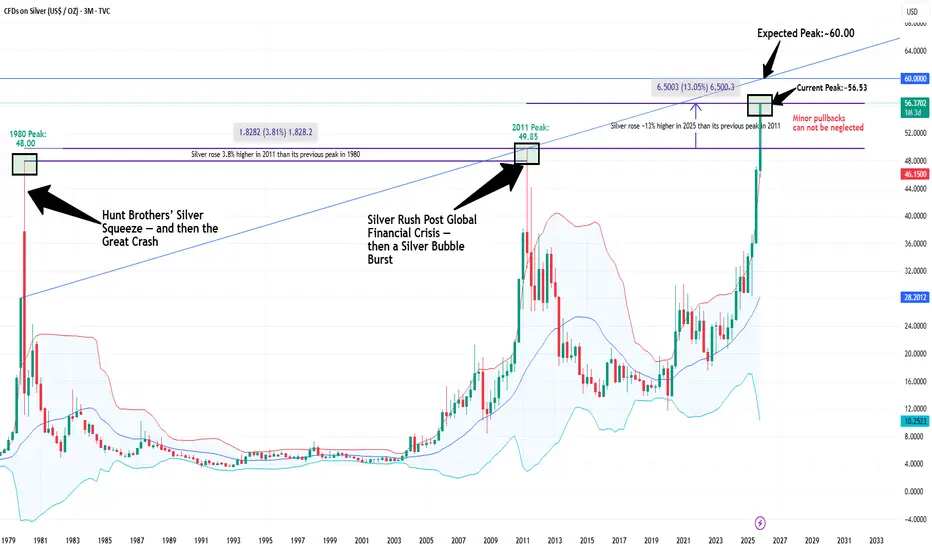
Silver is showing a historic picture: What's Next??Right now, Silver is showing a historic picture:
It has reached above the 1980 (Hunt Brother Silver Squeeze) and 2011 (GFC Silver Bubble) highs and above 55.0 for the first time in history.
But is it the climax or just an interval?????????
While everyone is debating over an "AI bubble-bursting or inflating," meanwhile, precious metals (Gold/ Silver) are crushing the markets
Tip of the Decade: Own assets or be left behind.
XAG/USD DailyThe final day of trading last week saw buyers smash through the 54.00 barrier which has been a ceiling for the precious metal in late October and early November.
The question now is can the buyers maintain price above the level?
Look for a trade that meets your strategy rules.

Is the Silver Price Preparing to Challenge Its Record High?Is the Silver Price Preparing to Challenge Its Record High?
The United States is celebrating Thanksgiving, meaning trading activity across financial markets will be lower than usual today (and to some extent tomorrow). Yesterday, we noted a decline in volatility in the gold market.
Against this backdrop, the silver market is drawing attention – and may not allow traders to relax. As the XAG/USD chart shows, silver has risen by more than 7% since the start of the week.
It is reasonable to assume that the holiday-induced drop in liquidity has opened the door to broader price movements. It is not impossible that we may soon see an attempt to break the all-time high (around $54.45 per ounce), which as of this morning lies roughly 1% away.
Technical Analysis of XAG/USD
Examining the XAG/USD chart, we can identify key swing points that allow us to outline an ascending channel. This week’s strong advance has pushed silver into the upper half of that channel.
The bulls’ strength is reflected in:
→ the steep slope of the orange channel, within which we see impulsive bullish candles followed by brief corrections – a classic pattern of a strong market;
→ a higher peak on the Awesome Oscillator.
Given this context, it is plausible that the median line could switch from resistance to support (as it has previously – shown by arrows), potentially helping the bulls gather the confidence needed to challenge the record high.
This article represents the opinion of the Companies operating under the FXOpen brand only. It is not to be construed as an offer, solicitation, or recommendation with respect to products and services provided by the Companies operating under the FXOpen brand, nor is it to be considered financial advice.

Silver traded sideways with resilience; strategy update:
We precisely entered a long position near $56.8, and the price rebounded above $58, ultimately resulting in substantial profits. This isn't just talk; it's proven real-world experience. This trade was truly brilliant; you can check our historical recommendations to verify its accuracy.
In trading, we strictly adhered to a strategy based on professional analysis, carefully controlling the pace. Although the price briefly broke below the key support level of $57, we remained patient and utilized professional analytical methods. Ultimately, the price successfully rebounded to our pre-set profit-taking range. All operations ultimately achieved the expected profit target, perfectly demonstrating the value of this strategy. If you need to recover significant losses or obtain precise trading signals, please contact me.
Silver is currently performing strongly, showing more resilience than gold. However, it's consolidating sideways, and support levels haven't been breached. Due to its high volatility in recent days, setting small stop-losses for short-term trades is difficult; precise entry points are crucial to avoid being caught in a breakout. For trading, watch the support level around 56.5-57. If a large bearish candle breaks through this level, watch for support around 55.6. Meanwhile, resistance around 58.5-59 is also significant. Personally, I prefer a pullback in silver's short-term outlook compared to further gains. My bullish view remains unchanged; a pullback is a consolidation phase for a healthier, more sustainable upward trend.

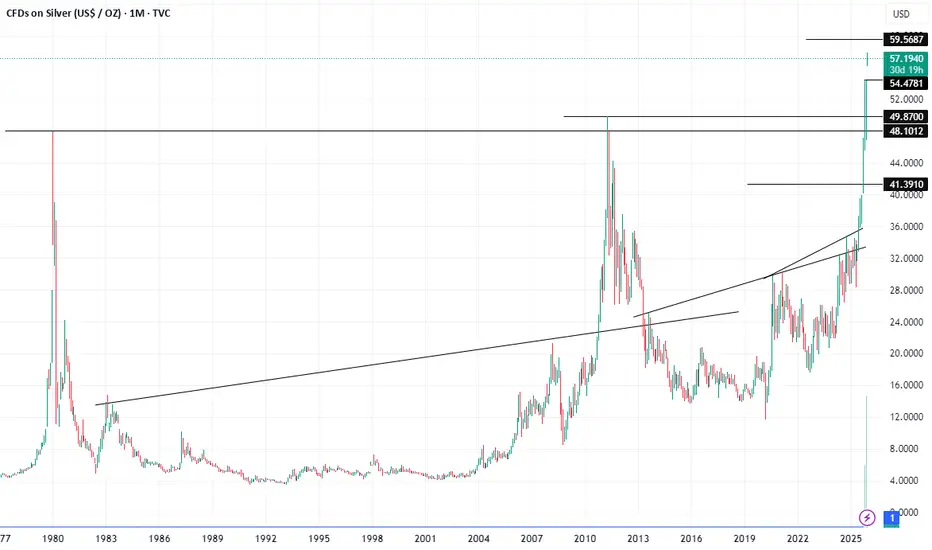
SILVER: The Mother of All Cup and Handles? 45-Year BreakoutThis analysis highlights what could be the most significant long-term technical pattern currently forming in the financial markets: a massive, multi-decade Cup and Handle formation on the silver/USD monthly chart.
The Cup (1980 – 2011)
The Cup began with the historic spike in 1980 and was completed with the rally to the same resistance level around $50 per ounce in 2011. This vast, 31-year, rounded consolidation zone represents a massive accumulation and basing phase.
The Handle (2011 – Present)
Following the 2011 peak, silver entered the "Handle" phase. This is the final consolidation period, characterized by price compression and sideways action below the key $50 resistance zone. This phase serves to shake out weak hands and build the energy required for a major long-term structural breakout.

SILVER Will Grow! Long!
Here is our detailed technical review for SILVER.
Time Frame: 17h
Current Trend: Bullish
Sentiment: Oversold (based on 7-period RSI)
Forecast: Bullish
The market is testing a major horizontal structure 5,240.5.
Taking into consideration the structure & trend analysis, I believe that the market will reach 5,614.1 level soon.
P.S
Please, note that an oversold/overbought condition can last for a long time, and therefore being oversold/overbought doesn't mean a price rally will come soon, or at all.
Like and subscribe and comment my ideas if you enjoy them!

Rising Channel / Ascending TriangleLooks like this could be a good set up for silver right now for ATH. Looking for 65 once fomo starts after break out above 60 levels.
SilverDivergence, Double top then Triple Top, Rising wedge, Resistance played its role now, trend line is at breakup point. I guess its a retracement of silver till Fib 0.382

Silver Current target 77$
Last time we corrected *59% in 274 days .
And it took 912 days ( 480%) to the new high .
I see a similar scenario
( if we reach 77$)
Wich is the target for this cup&handle break out on silver .
274 days from 77$-33$ (-59%)
912 days from 33$-173$ ( + 440%)
I expect 77$ somewhere from jan - feb 26’

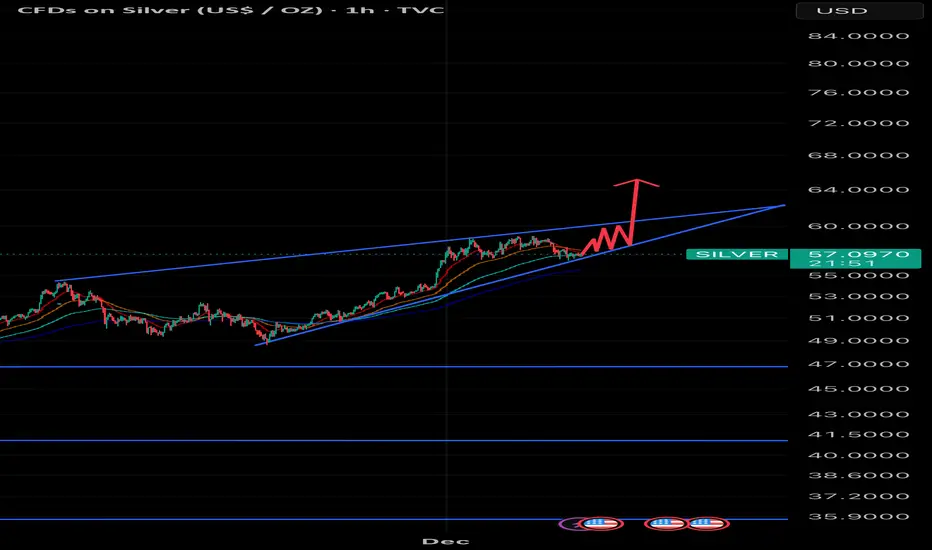
Silver can accelerate the momentumSilver is moving within the strong momentum expansion, having jumped for more than 4 daily volatility levels from the 20-day moving average for the last several days.
That usually represent a strong price discovery pattern, when the market searches for the new equilibrium: $60 is considered to be the next possible stop, but may extend beyond this level with ease.
ETF and options volume have been growing so far. Metal traders rotate from Gold to Silver, as it produces the next big fally.
As it's the overheated market, the idea might unfold quickly on the H1 timeframe, if the price would lock inside of a consolidation area as shown at the chart.
Timing is crucial in such situations, as volatility is quite high.
Remember - this is not a signal, it's just the idea for a trade. Consider making your own research and never forget to manage your risk!

XAGUSD it's further bulishh scnerios? #SILVER.. market stagnent even gold drop but silver constant hold his bulish pattern ..
So if market holds further then upside 60 plus can be a possible next stop ..
Good luck
Trade wisely

Silver is not done yetthis one seems easy on the eye, i dont really trade silver but target seems obvious

Silver (XAGUSD) Breaks a 14-Year Ceiling — Rounding Bottom Targe🌐 Market Context
Silver has just completed one of the most significant structural breakouts in modern commodity history. After consolidating for nearly 14 years beneath the 2011 high, price has surged through the multi-decade barrier at $50, launching into a new secular markup phase.
The current monthly candle shows extremely strong momentum, placing Silver firmly into price discovery, with volatility expanding and sentiment shifting from skepticism to early optimism.
🔍 Technical Analysis
📌 1. Completed 14-Year Rounding Bottom Pattern
Your chart clearly illustrates a massive Rounding Bottom that has been forming since the 2011 peak around ~$49.80. This long-duration base indicates extensive accumulation and supply absorption, as described in your analysis .
📌 2. Clean Breakout Above Historical Top
Silver has broken and closed above the historical April 2011 top, with price currently sitting near $56.50.
The breakout comes with strong volume expansion, validating institutional participation — a key signal emphasized in the PDF’s breakout mechanics section .
📌 3. Retest Zone / Golden Zone
Your chart marks a Golden Zone between ~$50.5 and ~$52.8.
This aligns with classical TA: former resistance → new support. Any pullback to this zone is structurally bullish.
📌 4. Projection Targets
Your overlay shows a Target Zone between ~$72 and ~$80, with an extended target of ~$87–$88.
These are consistent with:
Measured Move target ($86.40)
1.618 and 2.618 Fibonacci Extensions
Inflation-adjusted historical equivalents (implying plenty of room overhead)
📌 5. Price Behavior
The monthly chart shows:
Strong breakout candles
No meaningful upper wick → buyers firmly in control
No overhead market structure → pure price discovery
🎯 Bias: Strongly Bullish
The confluence of a completed 14-year base, a decisive breakout above a historic ceiling, and “Blue Sky” Fibonacci confluence gives this setup a high-conviction bullish bias.
As long as Silver remains above the $50–$52 support flip, the breakout structure remains intact.
🧭 Trade Plan / Setup (Not Financial Advice)
Potential Entries
Aggressive: Current market zone ($55–56)
Conservative: Pullback into the Golden Zone ($50.5–$52.8)
Breakout Continuation: Weekly close above $56.60 (Fib trigger)
Invalidation / Stop Ideas
Structural invalidation only if monthly closes below $46 (Handle top)
Short-term invalidation: daily close below $51
Targets
TP1: $65
TP2: $72–$75 (1.618 major extension)
TP3: $86 (measured move target)
Parabolic Extension: $100+ (2.618 fib; price discovery thesis)
These align with your projection models and analysis tables in the PDF .
📝 Summary / Final Thoughts
Silver has officially entered the early stages of a secular bull cycle after resolving a decade-plus consolidation. The breakout above $50 is not just a technical event — it’s the ignition point of a structural repricing supported by volume, pattern completion, and long-term fundamentals.
With no historical resistance ahead, Silver is now operating in open sky territory, where momentum, psychology, and algorithmic reactions can drive powerful and extended rallies.
This is one of the cleanest large-timeframe breakout structures currently visible across global markets.
