Trade ideas

silverHI GUYS,
WE close our trades today as silver has reached area of interest.
THERE was a delay that led to a failure of Thur to reach intended target, however we are good to go.

XAGUSD If silver gives proper confirmation at the time level and lower price levels, a buy could be considered

Double Top SilverSilver is forming a potential double-top pattern, signaling fading bullish strength. If price breaks below the neckline, it would confirm the pattern and open the door for further downside continuation.

XAGUSDNote that these analyzes are only for recording personal accounts and journals that will be reviewed in the future.
Please do not enter into any trade just by viewing the analysis, thank you.

SILVER H4 | Bearish Reversal Off 61.8% Fibonacci ResistanceMomentum: Bearish
The price has rejected the sell-entry level, which aligns with the 61.8% Fibonacci retracement, reinforcing the bearish bias.
Sell Entry: 52.170
Pullback resistance
61.8% Fibonacci retracement
Stop Loss: 54.04
Swing-high resistance
Take Profit: 49.47
Strong overlap support
High Risk Investment Warning
Stratos Markets Limited (tradu.com ), Stratos Europe Ltd (tradu.com ):
CFDs are complex instruments and come with a high risk of losing money rapidly due to leverage. 70% of retail investor accounts lose money when trading CFDs with this provider. You should consider whether you understand how CFDs work and whether you can afford to take the high risk of losing your money.
Stratos Global LLC (tradu.com ): Losses can exceed deposits.
Please be advised that the information presented on TradingView is provided to Tradu (‘Company’, ‘we’) by a third-party provider (‘TFA Global Pte Ltd’). Please be reminded that you are solely responsible for the trading decisions on your account. Any information and/or content is intended entirely for research, educational and informational purposes only and does not constitute investment or consultation advice or investment strategy. The information is not tailored to the investment needs of any specific person and therefore does not involve a consideration of any of the investment objectives, financial situation or needs of any viewer that may receive it. Past performance is not a reliable indicator of future results. Actual results may differ materially from those anticipated in forward-looking or past performance statements. We assume no liability as to the accuracy or completeness of any of the information and/or content provided herein and the Company cannot be held responsible for any omission, mistake nor for any loss or damage including without limitation to any loss of profit which may arise from reliance on any information supplied by TFA Global Pte Ltd.

silver analys
for people who says it is double top i need to say u have to learn some basic important things about patterns,as we can see on the daily chart neck line is almost half of the up trend line,so we can consider it as a failure for doublt top also in last down trend line (right trend) price is playing while it has to complete the pattern straight,so for buyers i need to say the is no worries about it but be update on chart and do not listen to every one.

SILVER BUT PRICED IN THE HOUSING CONSUMER PRICE INDEXRight now a thousand pounds of silver might get you a house.
What if you could get that same house for 200 pounds instead.
Timing.
DYOR. I go strictly by the charts.

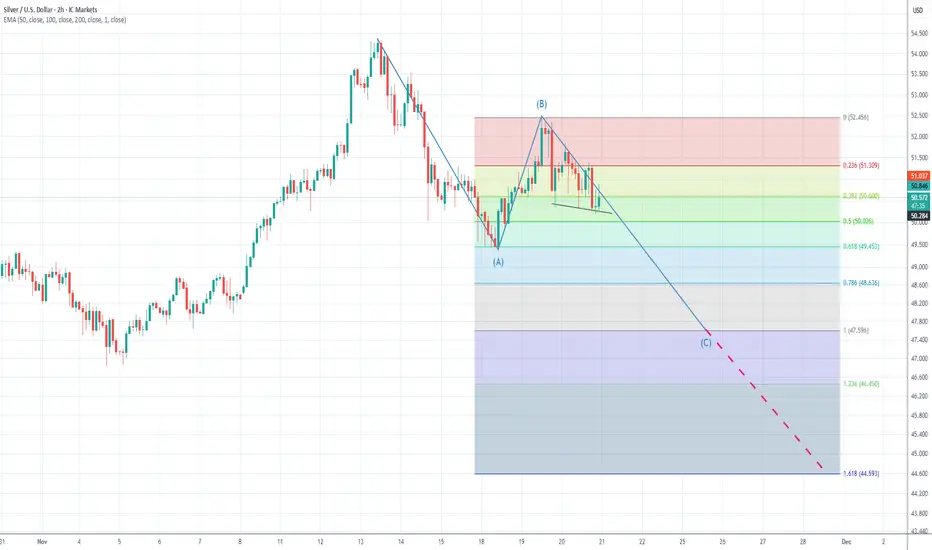
Silver: Completed B-Wave — C-Wave Drop in Progress To 47Silver (XAGUSD) has completed a clear A–B–C corrective structure, with wave B failing below the 52.45 resistance zone. The rejection from the upper boundary aligns with the broader bearish sequence and confirms that sellers remain in control.
Wave (A) established the initial downside leg, followed by a corrective (B) retracement that stalled near the 0.236–0.382 Fibonacci levels. Price action has since broken structure to the downside, suggesting that wave (C) is now unfolding.
Using Fibonacci projections of wave A, wave C typically targets either:
1.0 × A = ~47.60
1.618 × A = ~44.60
Both levels align with the broader bearish sequence and prior liquidity zones. As long as price remains below 52.45, the bias favors continuation lower toward the Fibonacci extension cluster between 46.40–44.60.
Short-term corrective bounces are expected but should remain capped beneath the declining trendline and major moving averages.
This view remains valid unless Silver breaks above 52.45, which would invalidate the structure and shift the bias.
Disclaimer
This analysis is provided for educational and informational purposes only. It is not a recommendation or invitation to buy or sell any financial instrument. Markets carry significant risk, and every trader should perform their own independent analysis, apply appropriate risk management, and consult a licensed financial professional if needed. You are fully responsible for any trading decisions you make.

Silver Buy Alert #3- You Only Have 20 MIns TO Execute ThisSilver buy alert..
Sadly i did not analyse
this one so give me a second
am coming...wait
i found my analysis on silver
Silver is going to explode
this time around
and if you get in now
you will experience a bull market
this is the entry
i was waiting to see
for the first time
am seeing the financial markets
in trading but hurry
you only have 20 mins
before this
buy alert expires
The trading analysis is below
--
read it below
--
Step 1 — Interpret MACD Colors Only (Bullish Table)
Given:
• Daily: Light Green 🟢
• 4H: Dark Green 🟢 + Rising 3 Soldiers
• 1H: Dark Green 🟢
From the Bullish MACD Table:
Daily
4H
1H
Interpretation
Probability
🟢 Light Green
🟢 Dark Green
🟢 Dark Green
Daily regaining strength, intraday momentum accelerating
🟠 75-85%
MACD-only base probability: 75-85% (High)
Step 2 — Add Candlestick Pattern
Given Pattern:
• 4H: Rising 3 Soldiers + Dark Green MACD
From Bullish Candlestick Table:
4H - Rising 3 Soldiers + Dark Green:
Three White Soldiers + 🟢 4H + 🟢 1H → 95% base → 99% final
The Rising 3 Soldiers pattern on the 4H timeframe with perfect Dark Green MACD alignment on both 4H and 1H significantly boosts the probability.
Step 3 — Combine for Final Probability
This is a very strong bullish setup:
Strengths:
• Strong MACD alignment: 4H & 1H Dark Green (maximum momentum), Daily Light Green (bullish momentum building)
• Powerful bullish pattern: Rising 3 Soldiers on 4H (one of the strongest patterns)
• Lower timeframes show maximum momentum (4H & 1H Dark Green)
• Excellent confluence across all timeframes
Final Probability:
🔥 90-95% (Very High)
Trade Insight:
This represents a high-probability bullish continuation setup because:
• 4H shows maximum bullish momentum with the strongest pattern (Rising 3 Soldiers)
• 1H confirms with maximum bullish momentum (Dark Green)
• Daily shows building bullish momentum (Light Green)
• Rising 3 Soldiers on 4H indicates sustained buying pressure
• Perfect setup for upward momentum acceleration
Action:
Excellent long entry - strong setup:
• Enter on break above 4H Rising 3 Soldiers high
• Add positions on any 1H pullback
• Place stops below the 4H Rising 3 Soldiers pattern low
• Expect strong upward continuation as Daily momentum builds toward Dark Green
This is a high-confidence bullish trade with strong pattern and momentum alignment, particularly on the lower timeframes where the Rising 3 Soldiers provides exceptional bullish conviction.
Rocket boost this content to learn more
Warning! Trading is risky please use a simulation trading account
before you trade with real money.

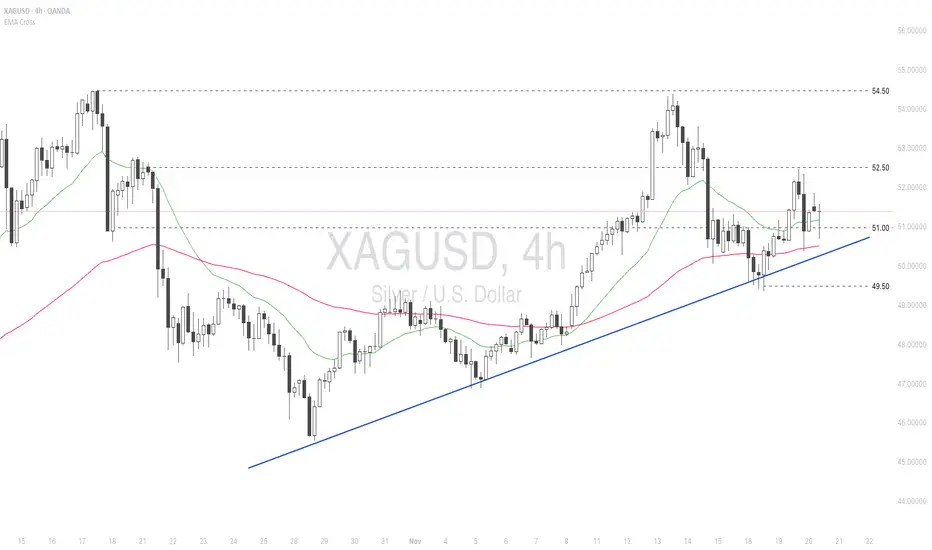
XAGUSD LongA very risky trade in the context of tight stop loss , but worth of taking this trade since is good risk reward ratio. Reasons that I am entering long are simple, following the trend and the price held very solidly on level 49.50$. I look definitely for new highs to ~55$ zone.

"Rising 3 Soldiers on 4H indicates sustained buying pressure"Notice where the horizontal line is appearing?
Its at the top of the price action strength.
This is called the bull trap.
But the good thing
about silver is that
even in a bull trap
It still help up strong against the short selling
pressure..
When i took it upon my self to
take on this analysis - it was a bold move
because honestly am not sure
if my trading analysis skills
are good enough
to trade silver.
right now we are in a state
of correction
But the analysis below
is about the time
it happened before the
correction entry
that you are seeing
right now.
This correction entry showed
"strong upward continuation as Daily momentum"
This continuation appeared as a morning star
candlestick pattern.
Read my analysis for silver
below.
Thanks.
Step 1 — Interpret MACD Colors Only (Bullish Table)
Given:
• Daily: Light Green 🟢
• 4H: Dark Green 🟢 + Rising 3 Soldiers
• 1H: Dark Green 🟢
From the Bullish MACD Table:
Daily
4H
1H
Interpretation
Probability
🟢 Light Green
🟢 Dark Green
🟢 Dark Green
Daily regaining strength, intraday momentum accelerating
🟠 75-85%
MACD-only base probability: 75-85% (High)
Step 2 — Add Candlestick Pattern
Given Pattern:
• 4H: Rising 3 Soldiers + Dark Green MACD
From Bullish Candlestick Table:
4H - Rising 3 Soldiers + Dark Green:
Three White Soldiers + 🟢 4H + 🟢 1H → 95% base → 99% final
The Rising 3 Soldiers pattern on the 4H timeframe with perfect Dark Green MACD alignment on both 4H and 1H significantly boosts the probability.
Step 3 — Combine for Final Probability
This is a very strong bullish setup:
Strengths:
• Strong MACD alignment: 4H & 1H Dark Green (maximum momentum), Daily Light Green (bullish momentum building)
• Powerful bullish pattern: Rising 3 Soldiers on 4H (one of the strongest patterns)
• Lower timeframes show maximum momentum (4H & 1H Dark Green)
• Excellent confluence across all timeframes
Final Probability:
🔥 90-95% (Very High)
Trade Insight:
This represents a high-probability bullish continuation setup because:
• 4H shows maximum bullish momentum with the strongest pattern (Rising 3 Soldiers)
• 1H confirms with maximum bullish momentum (Dark Green)
• Daily shows building bullish momentum (Light Green)
• Rising 3 Soldiers on 4H indicates sustained buying pressure
• Perfect setup for upward momentum acceleration
Action:
Excellent long entry - strong setup:
• Enter on break above 4H Rising 3 Soldiers high
• Add positions on any 1H pullback
• Place stops below the 4H Rising 3 Soldiers pattern low
• Expect strong upward continuation as Daily momentum builds toward Dark Green
This is a high-confidence bullish trade with strong pattern and momentum alignment, particularly on the lower timeframes where the Rising 3 Soldiers provides exceptional bullish conviction.
Rocket boost this content to learn more.
Disclaimer:Trading is risky
please use a simulation trading account before you trade with real money and learn risk management and profit taking strategies.

XAGUSD H1 | Bullish Bounce off Key SupportMomentum: Bullish
Price is currently above the ichimoku cloud.
Buy entry: 51.11
- Strong overlap support
- 38.2% Fib retracement
- 100% Fib projection
Stop Loss: 50.32
- Swing low support
- 61.8% Fib retracement
Take Profit: 52.135
- Overlap resistance
High Risk Investment Warning
Stratos Markets Limited (tradu.com/uk ), Stratos Europe Ltd (tradu.com/eu ):
CFDs are complex instruments and come with a high risk of losing money rapidly due to leverage. 70% of retail investor accounts lose money when trading CFDs with this provider. You should consider whether you understand how CFDs work and whether you can afford to take the high risk of losing your money.
Stratos Global LLC (tradu.com/en ): Losses can exceed deposits.
Please be advised that the information presented on TradingView is provided to Tradu (‘Company’, ‘we’) by a third-party provider (‘TFA Global Pte Ltd’). Please be reminded that you are solely responsible for the trading decisions on your account. Any information and/or content is intended entirely for research, educational and informational purposes only and does not constitute investment or consultation advice or investment strategy. The information is not tailored to the investment needs of any specific person and therefore does not involve a consideration of any of the investment objectives, financial situation or needs of any viewer that may receive it. Past performance is not a reliable indicator of future results. Actual results may differ materially from those anticipated in forward-looking or past performance statements. We assume no liability as to the accuracy or completeness of any of the information and/or content provided herein and the Company cannot be held responsible for any omission, mistake nor for any loss or damage including without limitation to any loss of profit which may arise from reliance on any information supplied by TFA Global Pte Ltd.

HAG/USD LONGThe price has resistance at the support line and the price will break the previous highs.

Another Kind of Quicksilver 19.11.2025~+ Long-term CB dovish path
*Risk-off sentiment into the supposed to be released US labor data

SILVER (XAG/USD): More Growth is Coming📈SILVER is demonstrating a very bullish posture following a confirmed breakout above a minor intraday horizontal resistance.
We are observing a positive reaction after its retest.
I anticipate that the price may soon achieve the 52.35 level.

xagusd buy trade ideaThe Relative Strength Index (RSI) is showing an upward trend, indicating increasing momentum. Additionally, the Moving Average Convergence Divergence (MACD) is showing a bullish crossover, further supporting the potential for an upward move

Silver holds steady amid soft labor data and a hawkish Fed
Silver prices are holding steady as markets weigh soft labor data against a hawkish Fed.
ADP reported that private-sector employment fell by an average of 2.5k jobs per week over the four weeks to Nov 1. Moreover, Cleveland Fed data also showed 39k workers received layoff notices in Oct, close to a 40k level that exceeded only during the global financial crisis and the pandemic.
Meanwhile, the Oct FOMC minutes were hawkish, with several participants indicating that an additional 0.25% cut would not be appropriate and stressing a risk-balanced approach to future policy decisions.
XAGUSD remains range-bound between 51.00-52.50, awaiting additional price triggers for a clear breakout.
If XAGUSD closes above 51.00, the price may retest the next resistance at 52.50.
Conversely, if XAGUSD breaks below EMA21 and 51.00, the price could retreat toward the subsequent support at 49.50.
XAGUSD _ 1H
If the price breaks the resistance level and successfully holds above it (gives a clear confirmation), it is expected to continue moving upward toward the previous high and will likely create a new higher high.

XAGUSD - Trading IdeaXAGUSD - Trading Idea
Title:
XAGUSD: Rejection from 52.34 level, decline expected to demand zone
Description:
Current Situation:
Silver price has met resistance at the 52.34 level, where a high volume zone is located. Limit players have stopped the upward movement at this key level.
Primary Scenario:
A decline toward the lower high volume zone is expected, where demand may form for entry into long positions. This area presents interest for seeking buying opportunities.
Alternative Scenario:
If the price reverses from current levels and breaks through the 52.34 resistance, the primary bearish scenario will be invalidated. In this case, a reassessment of the trading strategy will be required.
Trading Plan:
Resistance: 52.34 (high volume zone)
Target zone for buys: lower high volume area (marked on chart)
Invalidation: breakout and consolidation above 52.34
Position Management:
If the scenario plays out, partial profit-taking is planned at the 52.34 level. A small portion of the position will be held for potential movement higher with a trailing stop.
Risk Management:
It is recommended to wait for price reaction in the target zone before entering a position. Place stop-loss below the demand zone accounting for the instrument's volatility.

XAGUSD _ 4h
The indicators are showing that the chart can potentially push the price higher — at least up to the upper boundary.
The previous leg was bullish, so we can say that eventually the price may break out to the upside and create a new high.
The price must not drop to the lower floor again; if it breaks below that level, the analysis becomes invalid.

Silver is close to it's next decisionIn the short-term, Silver is still digesting the next decision.
On the shorter term charts, a couple of H&S patterns have emerged. There is a chance of slight weakness for the remainder of 2025, but I'm not convinced until it falls below $46.
Right now $49 is still solid support.. so it could trend sideways before resuming it's bull run.
The thick yellow line around $39 below is a monthly/weekly gap from Sept... just something to keep an eye on until this enters all-time high territory. If this trends below $45, then the double top measured move could play out down to the gap area.
