Silver Market Once in a Lifetime Breakout: 120/140 USD PT📌 Base case unchanged: I’m still targeting $125–$150 within 12–24 months. The next leg of the bull run should accelerate after the all-time-high (~$49–$50) breaks and sticks. Spot is circling the mid-$40s (recent highs ~$46–$47), so the setup is in place. 💎✨
🎯 Bottom line
Silver’s structural deficit + gold leadership + policy-driven cost inflation meet a fresh technical regime. The ATH break is the ignition; $65–$75 is the first destination, and the $125–$150 12–24M target stays live if real yields drift down and PV/electronics demand stays elevated despite thrifting. Manage the whipsaws; respect $38 as the cycle guardrail. BUY/HOLD bias remains warranted. 🚀💎🔥
________________________________________
📊 Technical Outlook (2-week candles)
• Structure: Multi-year Cup & Handle from 2011 → 2020 base → 2024/25 handle. The $40 neckline break is done; a weekly/monthly close > $49.50 flips the market into price discovery.
• Levels that matter:
— Resistance: $49–$50 (ATH), then $65–$75 (measured move / vacuum), interim supply near $57–$60.
— Support: $44.5–$45 (breakout retest), $41–$42 (former cap), deeper $38 and $34 (trend break if lost).
• Momentum breadth: Higher highs on price with constructive consolidation while gold prints records → classic GSR mean-reversion tailwind. 📈⚡
________________________________________
🧭 12–24 Month Path Outlook
Base (55%) – Break & run: Close above $50 triggers trend systems and discretionary chase → extension to $65–$75 by mid-’26, stair-step into $100–$125 by late ’26/early ’27; overshoot to $150 on macro squeeze. 🚀
Alt up (15%) – Blow-off: Parabolic sprint to $85–$100 immediately post-break, sharp retrace to high-$60s, then grind to $125–$150.
Pullback (25%) – Fakeout & reload: Failure at $49–$50, mean reversion to $41–$42 or even $38, rebuild positioning; timeline slips ~1–2 quarters.
Bear tail (5%) – Macro shock: USD spike + real-yield jump + PV air-pocket; lose $34 → cycle delay (target deferred, not canceled). ⚠️
________________________________________
🚦 Catalyst Scorecard — Visible & Hidden Drivers (0–10)
1. Fed path & real yields — 9.0/10 (Bullish)
The Fed cut 25 bps on Sept 17 (now 4.00–4.25%) and signaled scope for more easing this year; several officials reinforced that bias. Lower real yields are the single strongest tailwind for non-yielding metals. 🏦
2. U.S. Dollar trend — 6.0/10 (Net-Bullish for silver)
DXY has been firm the last two weeks, a minor headwind; but with the Fed easing bias, dollar upswings look tactical, not structural. Any USD rollover clears the runway. 💵
3. Gold leadership & GSR mean-reversion — 8.5/10 (Bullish)
Gold at/near record highs ~$3.75–$3.80k keeps silver in tow. GSR ~80–84 is elevated vs. bull-market medians → skew favors silver outperformance on a gold grind. 🪙⚖️
4. Structural deficit — 8.5/10 (Bullish)
Fourth straight sizable deficit; ~678 Moz cumulative drawdown since 2021. 2025 still projected to run a ~115–120 Moz deficit despite softer bar/coin demand. 📉📦
5. Industrial demand (PV/Electronics) — 7.5/10 (Bullish with nuance)
PV/electrical demand at record highs; PV up again in 2024 (+3% y/y) and installations broadened across 38 “>1GW” countries. Offsetting force: silver thrifting (0BB, copper plating) → another 10–12% loading cut likely in 2025. Net: total ounces still robust as capacity growth outpaces thrifting… for now. ☀️🔋
6. ETP/ETF flows — 7.5/10 (Bullish)
Global silver ETPs flipped to net inflows in 2024 (+62 Moz) and kept adding into 2025. SLV shows ~15,362 tonnes in trust as of Sept 26—a sizable base of “sticky” investment metal. 📊📈
7. LBMA & COMEX stocks / liquidity premia — 7.0/10 (Bullish)
LBMA silver in London: 24,646 t (Aug) — up m/m but well below pre-2020 peaks; COMEX registered ~196 Moz. Tight-ish float + delivery frictions can widen location premia during spikes. 🏭📦
8. Tariff & logistics regime — 7.0/10 (Bullish via inflation/frictions)
U.S. 50% copper tariff (Aug 1) lifts domestic copper premia and can indirectly affect by-product silver flows and refining economics. Recent gold bar tariff confusion also showed how policy can snarl bullion logistics; LBMA welcomed clarifications, and noted silver discussions continue—headline risk persists. 🚢⚙️
9. Base-metal supply shocks (by-product linkage) — 6.5/10 (Bullish)
Grasberg disruptions and Peru protest-related shutdowns point to emerging fragility in copper output; since much silver comes as a by-product, copper hiccups can tighten silver supply at the margin. ⛏️🌍
10. Mexico policy/permitting — 6.0/10 (Bullish later, volatile now)
World’s top silver producer remains mired in regulatory overhang; exploration still depressed post-2023 reforms. Any genuine permitting thaw would be years from ounces—near-term effect is restraint. 🇲🇽📜
11. India retail/investment demand — 6.5/10 (Bullish)
Silver hitting record rupee highs; local ETFs up ~50%+ YTD; retail investment +7% y/y in H1’25. Seasonal tailwinds into festivals. 🎉🇮🇳
12. China macro & manufacturing — 5.5/10 (Mixed)
Electronics appetite is steady, PV leadership intact; property stress caps jewelry, but investment demand remains opportunistic. Net: supportive on dips, headline-sensitive. 🏗️🇨🇳
13. Systematic/CTA & options positioning — 6.0/10 (Volatility amplifier)
Trend models chased the $40 break; dealer gamma turns negative above $45–$47 at times, inviting intraday whipsaws. 🎯📉📈
14. Geopolitics (Ukraine/Mideast/Taiwan) — 5.5/10 (Event-Bullish)
Safe-haven jolts remain episodic; they matter more after the ATH triggers chase behavior. 🌍🔥
________________________________________
🧨 Hidden (under-traded) catalysts
• GSR compression trade: Once $50 breaks, programmatic rebalancing from gold to silver can accelerate relative gains. (GSR in the 60s pulls silver deeper into triple digits fast.) ⚖️💥
• By-product elasticity: Copper policy & outages (tariffs, mine incidents) can reduce silver by-product feed even as PV demand hums—this is not fully priced. 🔧⛏️
• Vault/warehouse microstructure: LBMA/COMEX stock changes vs. delivery notices can suddenly widen time/location spreads → sparks short-term basis fireworks that lift spot. 📦⏳
________________________________________
🛠️ Positioning & Execution
• Core: BUY/HOLD core metal exposure; add on $44–$45 retests; reload heavier on $41–$42.
• Breakout tactics: On a weekly close > $50, ride call spreads (e.g., $60/$90 9–15M out on SI or SLV) or risk-reversals (sell $35 puts to fund $80–$100 calls).
• Risk controls: Invalidate momentum if weekly close < $38; cut leverage.
________________________________________
🧩 Fundamental NOTES
• Spot context: XAG/USD ~$46, 52-week range ~$28–$46.7. ATH ~$49–$50 (1980/2011).
• Deficit math: Metals Focus/Silver Institute show fourth straight deficit; 2025 deficit ~117 Moz amid record industrial demand and only modest supply growth.
• Supply: 2024 mined = 819.7 Moz; 2025e ≈ 835.0 Moz (+1.9% y/y). Primary mine share keeps slipping; AISC fell in 2024 (by-product credits).
• PV nuance: Silver loadings ↓ ~10–12% in 2025e, but global PV installations broadened; total silver ounces into PV remain lofty even as intensity falls.
• Vaults/ETFs: LBMA London holdings 24,646 t (Aug). SLV metal in trust 15,361.84 t (Sep 26). COMEX registered ~196 Moz.
• Macro winds: Fed cut and may cut more in 2025 → lower real yields + easier USD path.
• Policy kicker: U.S. copper tariffs live; gold bar tariffs clarified after August confusion; silver remains under policy watch—any mis-classification can jolt premia.
________________________________________
SILVER trade ideas

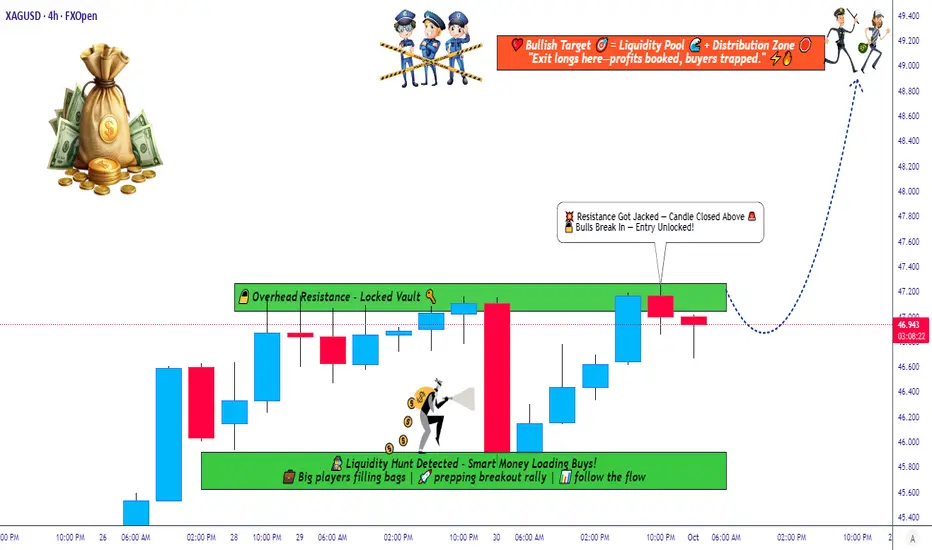
SILVER (XAG/USD): One More Bullish Wave is Coming?!⚠️ SILVER appears to be confined within a horizontal range, as observed on the 4-hour chart. The price is currently nearing the upper limit of this range.
Given the prevailing strong bullish trend, there is a considerable likelihood of a continued upward movement.
A breakout and a 4-hour candle closing above the indicated resistance level would serve as a dependable confirmation.
The subsequent objective for buyers is anticipated to be 49.00.
Conversely, the market might persist in its consolidation phase, trading within the established range.

Silver at critical resistance, is a great collapse next?Silver has a long history of dramatic price spikes, each coinciding with significant global macro events:
June 1980, the Hunt Brother’s squeeze sent silver parabolic before collapsing
March 2011, post Global Financial Crisis (GFC) stimulus + QE mania led to another blow off top
Present day, amidst chaotic politics and incomprehensible levels of debt price action is once again testing the same resistance zone around $50
This area has proven to be a multi-decade resistance. Each prior approach ended in a swift and brutal correction.
Technical analysis
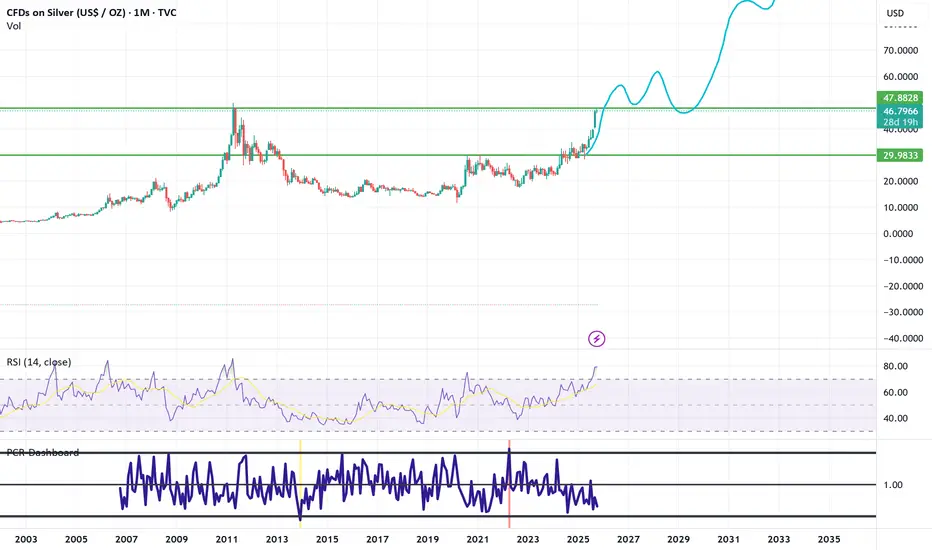
Monthly chart: Price action has surged aggressively. 300% since the lows of 2020 to the $45-50 resistance band, mirroring the same vertical rallies of 1980 and 2011.
RSI: A long term descending RSI resistance line connects the 1980 and 2011 tops. Current RSI is once again colliding with this barrier, hinting at exhaustion.
Momentum: While silver is undeniably strong, history suggests the upside risk may be limited at these levels compared to the downside potential.
Risk reward breakdown
Upside potential: A clean breakout above $50 could open the door to a true price discovery phase possibly $60+ if silver enters a secular commodities super cycle.
Downside risk: Failure here would mimic the historic collapses:
1980: -90% drawdown
2011: -70% drawdown
A pullback to $25-30 would not be unusual, especially if macro liquidly tightens.
Trading strategy ideas:
Aggressive traders: Consider short setups or profit taking near the $50 resistance, with stops above $52-53 to manage risk.
Conservative traders: Wait for confirmation, either a monthly breakout or close above $50 (bullish) or a strong rejection signal.
Conclusion
Silver has once again like Gold reached historic levels. The risk/reward profile favours caution here on. History shows that vertical rallies into this level tend to end poorly for late longs. Unless silver breaks and holds above $50, the probability of a deep correction remains high.
Is it possible price action continues higher? Sure.
Is it probable? No.
Ww

Silver - Eventually new all time highs!🪚Silver ( TVC:SILVER ) might soon break out:
🔎Analysis summary:
If we look at the bigger picture, Silver has been consolidating for the past couple of decades. But with the recent strong rally of about +50%, Silver is once again heading back to the previous all time highs. Despite a potential short term correction, Silver remains totally bullish though.
📝Levels to watch:
$42, $34
SwingTraderPhil
SwingTrading.Simplified. | Investing.Simplified. | #LONGTERMVISION

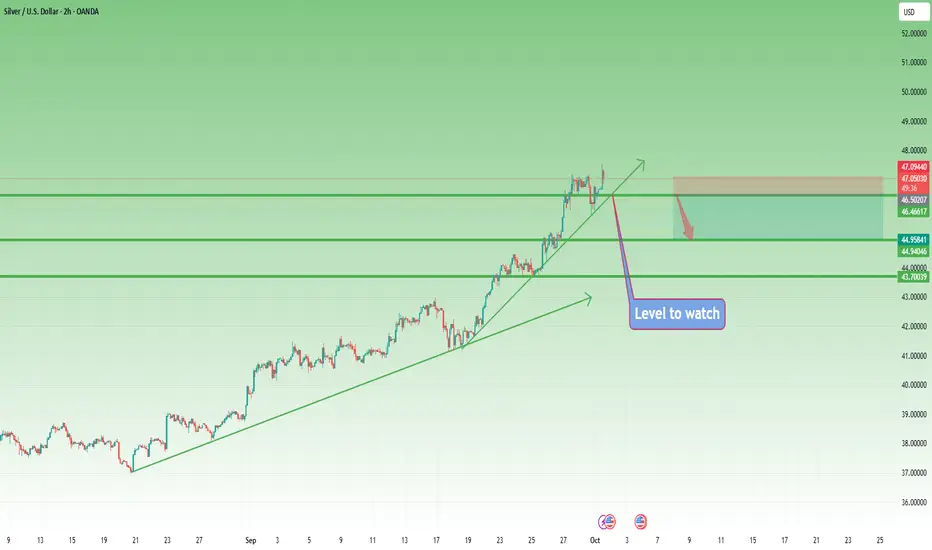
Silver Analysis – Multi-Year Highs but Correction LoomsSeptember has been a remarkable month for Silver, with prices running from the 40 zone all the way to 47.50, marking an impressive 20% gain and printing a new multi-year high.
Just like Gold, the long-term trend remains strongly bullish – no doubts there.
However, also like Gold, the recent rally looks overstretched, and history tells us that sharp corrections often follow such aggressive moves.
Yesterday, after touching above 47, Silver sold off hard and dipped to an intraday low of 45.78. Bulls quickly stepped back in, and overnight the market managed to print new highs around 47.57.
For now, the price remains elevated, but with correction looming, I believe the bearish side will eventually prevail in the short-term.
🔑 Technical Perspective:
• Key support to watch: 46.80.
• If this level fails to hold, we could see a stronger sell-off than yesterday’s, with the most appropriate near-term target sitting around 45.00.
🚀 As always, the market needs to confirm, but at these elevated levels, caution is warranted for late buyers.
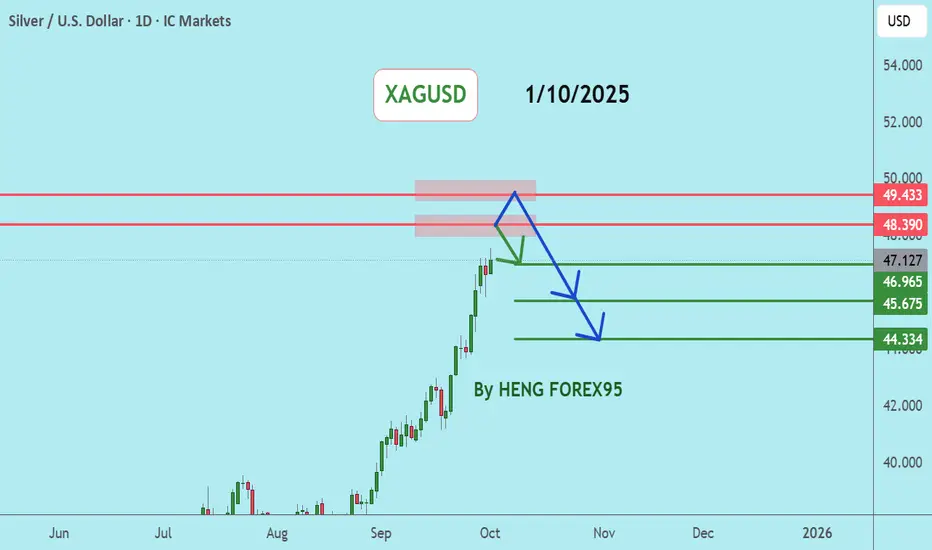
XAGUSDSilver price is in a strong uptrend. The price has a chance to test the 48.39-49.75 level, which is a key resistance zone. If the price cannot break through the 49.75 level, it is expected that the price has a chance to go down in the short term. Consider selling in the red zone.
🔥Trading futures, forex, CFDs and stocks carries a risk of loss.
Please consider carefully whether such trading is suitable for you.
>>GooD Luck 😊
❤️ Like and subscribe to never miss a new idea!
Sell Silver @47Sell SILVER @47
Silver will face major resistance at 47-48
Target1 - 40
Target2 - 37.8
Buy Silver at 40-37 only/-
Disclaimer :-
I am not SEBI registered. The information provided here is for education purposes only.
I will not be responsible for any of your profit/loss with this channel suggestions.
Consult your financial advisor before taking any decisions.

SILVER (XAGUSD): ALL-TIME HIGH AHEAD!
A bullish rally may temporarily stop soon as Silver
is approaching a major resistance cluster based on a current All-Time High.
48.0 - 50.0 zone will be an important structure from where the market may retrace.
After a pullback from that, be ready for another bullish wave and a breakout of the underlined area.
❤️Please, support my work with like, thank you!❤️
I am part of Trade Nation's Influencer program and receive a monthly fee for using their TradingView charts in my analysis.

Trader Tilki | XAGUSD (Silver) 1H Analysis: Strategic Buy ZonesHello Guys,
Here’s my XAGUSD-SILVER analysis. I’ve received many requests for this, and every follower matters to me — I can’t ignore your demands.
As you know, SILVER usually moves in positive correlation with GOLD and often reacts the same way to news events.
The buy levels I’ll be watching:
🔵 BUY level: 44.66118
🔵 BUY level: 44.02180
🟢 Target level: 46.64801
🔴 Set your stop level according to your own margin.
If price reaches these zones, I’ll definitely open a buy position and take my shot.
Let’s see together how this analysis plays out.
Every like is my biggest motivation to keep sharing these analyses.
Thanks to everyone supporting and following me!

Could this be correct? Time to get defensive in my opinionThis count has perfect fib extentension and I am beginning to this the pb that we are all expecting is coming soon...very soon. To each is own, but I am going to take some chips off the table here and be ready for a decent pull back to reload...but to each his own.

XAGUSD H1 | Potential Bullish Continuation AheadXAG/USD is falling towards the buy entry which is a pullback support that aligns withthe 38.2% Fibonacci retracement and could bounce from this level to the upside.
Buy entry is at 47.61, which is a pullback support that aligns with the 38.2% Fibonacci retracement.
Stop loss is at 46.74, which is a pullback support that is slightly above the 78.6% Fibonacci retracement.
Take profit is at 49.46, which is aligns with the 161.8% Fibonacci extension.
High Risk Investment Warning
Trading Forex/CFDs on margin carries a high level of risk and may not be suitable for all investors. Leverage can work against you.
Stratos Markets Limited (tradu.com/uk ):
CFDs are complex instruments and come with a high risk of losing money rapidly due to leverage. 65% of retail investor accounts lose money when trading CFDs with this provider. You should consider whether you understand how CFDs work and whether you can afford to take the high risk of losing your money.
Stratos Europe Ltd (tradu.com/eu ):
CFDs are complex instruments and come with a high risk of losing money rapidly due to leverage. 66% of retail investor accounts lose money when trading CFDs with this provider. You should consider whether you understand how CFDs work and whether you can afford to take the high risk of losing your money.
Stratos Global LLC (tradu.com/en ):
Losses can exceed deposits.
Please be advised that the information presented on TradingView is provided to Tradu (‘Company’, ‘we’) by a third-party provider (‘TFA Global Pte Ltd’). Please be reminded that you are solely responsible for the trading decisions on your account. There is a very high degree of risk involved in trading. Any information and/or content is intended entirely for research, educational and informational purposes only and does not constitute investment or consultation advice or investment strategy. The information is not tailored to the investment needs of any specific person and therefore does not involve a consideration of any of the investment objectives, financial situation or needs of any viewer that may receive it. Kindly also note that past performance is not a reliable indicator of future results. Actual results may differ materially from those anticipated in forward-looking or past performance statements. We assume no liability as to the accuracy or completeness of any of the information and/or content provided herein and the Company cannot be held responsible for any omission, mistake nor for any loss or damage including without limitation to any loss of profit which may arise from reliance on any information supplied by TFA Global Pte Ltd.
The speaker(s) is neither an employee, agent nor representative of Tradu and is therefore acting independently. The opinions given are their own, constitute general market commentary, and do not constitute the opinion or advice of Tradu or any form of personal or investment advice. Tradu neither endorses nor guarantees offerings of third-party speakers, nor is Tradu responsible for the content, veracity or opinions of third-party speakers, presenters or participants.

XAGUSDSilver triggered a buy signal around $21 and has now rallied to $48. Based on my outlook, the final target for this upward move could extend to $78. After that, I expect a correction phase toward the $50 zone, before wave 5 potentially drives prices higher toward the $150 level.

Silver Price: October Kicks Off with a 14-Year HighSilver Price: October Kicks Off with a 14-Year High
As the XAG/USD chart shows, today silver prices climbed above the $47.50 per ounce mark for the first time since 2011. Since the beginning of the month, silver has appreciated by approximately 15%.
Why is silver rising?
According to media reports, demand for so-called safe-haven assets has intensified amid the US government shutdown, which officially began on 1 October. President Trump has placed the blame on Democrats, while maintaining optimism that the shutdown could be leveraged to streamline the work of federal agencies.
Trading Economics further highlights that the Silver Institute forecasts a deficit in the global silver market. Production is expected at 844 million ounces – around 100 million ounces short of demand, which continues to be driven by the expansion of solar energy, consumer electronics, and data centres.
Technical analysis of the XAG/USD chart
On 22 September, when analysing the XAG/USD chart, we:
→ Drew a long-term upward blue channel, along with a steeper orange channel indicating accelerated growth.
→ Noted that the silver price had broken above the upper boundary of the blue channel and suggested that XAG/USD was in a vulnerable position for a potential correction.
Shortly thereafter (as shown by the red arrow), the price encountered resistance. However, it was insufficient to trigger a pullback, as the upper boundary of the blue channel acted as support (S), allowing silver to continue its ascent within the orange channel.
Yesterday, when reviewing the gold chart, we noted a sharp decline in precious metals at the start of Monday’s session. Although bulls managed to recover during the US session (signalling robust demand), bears remain present – underscored by today’s failure to hold above Monday’s high (marked by the black arrow).
Applying any oscillator (such as RSI) will likely reveal signs of bearish divergence, pointing to a weakening bullish momentum.
Taking the above into account, we could assume that:
→ The market remains bullish. While demand forces may be losing steam, the momentum of the rally could continue to play a significant role.
→ A correction is possible – for example, towards the lower boundary of the orange channel (S2), which is reinforced by a bullish FVG (an imbalance zone favouring buyers).
This article represents the opinion of the Companies operating under the FXOpen brand only. It is not to be construed as an offer, solicitation, or recommendation with respect to products and services provided by the Companies operating under the FXOpen brand, nor is it to be considered financial advice.

White Box is near term tgtThe white box on this chart is my near term target (next 3 monhts)...then we should see a pull back of some size...until then stay long and strong in my opinion. Yes there may be a few small dips along the way, but I wil not be exiting any of my longs until this zone is reached.

XAGUSDKey Market Drivers
US Political Instability: Concerns over a potential government shutdown are driving demand for safe-haven assets like gold.
Federal Reserve Policies: Growing bets on Fed rate cuts are weakening the US dollar and supporting gold prices.
Geopolitical Risks: Renewed tariffs on global trade are adding to market uncertainty.

Silver long term playBeen tracking silver for a decade and joined during the pandemic.
40 years of data, cup and handle formation and three 5wave eliot.
3th wave, point 3, is close to hitting the 48$ target ,
Wich is top of the cup and handle, big price resistence.
I expect a good 30% correction there to the 32 to 38 range, and a final extension to 96$ wich is the cupandhandle target and top of the log range (yellow line) by 2027.
There is a chance a squeeze like in the 70's might happen, with a even higher target, but ill be selling most of my silver at 96$.

SilverIt looks like silver is nearing a critical point. Above the ATH it unlocks a new growth trajectory which probably does not stop before a mininmum 3X from the ATH. Else it falls down and attempts another cup with handle with the handle depth lower than the previous.
The first ATH was in 1980. The second was in 2011. - 31 years.
The second ATH was in 2011. The third ATH was in 2025 - 14 years.
If silver falls down below ATH by almost 40%, probably the fourth ATH will need to wait about 5-6 years till it attemps to crossover ATH again.
If this crosses ATH now, there isa consolidation for an year or so may be at aroundthe neckline or a bit higher than that and then there is a sharp upmove. Silver may touch 160 levels on this chart in 15 years, that will be a 4X move in 15 years..
SILVER The Target Is DOWN! SELL!
My dear friends,
My technical analysis for SILVER is below:
The market is trading on 47.990 pivot level.
Bias - Bearish
Technical Indicators: Both Super Trend & Pivot HL indicate a highly probable Bearish continuation.
Target -47.247
Recommended Stop Loss -4848.0
About Used Indicators:
A pivot point is a technical analysis indicator, or calculations, used to determine the overall trend of the market over different time frames.
Disclosure: I am part of Trade Nation's Influencer program and receive a monthly fee for using their TradingView charts in my analysis.
———————————
WISH YOU ALL LUCK
SILVER Free Signal! Sell!
Hello,Traders!
SILVER Triple-top rejection at premium levels confirms distribution phase. SMC shows liquidity sweep above highs before sharp drop through neckline, shifting order flow bearish.
-------------------
Stop Loss: 4,721$
Take Profit: 4,537$
Entry: 4,632$
Time Frame: 3H
-------------------
Sell!
Comment and subscribe to help us grow!
Check out other forecasts below too!
Disclosure: I am part of Trade Nation's Influencer program and receive a monthly fee for using their TradingView charts in my analysis.

SILVER.SILVER.
You NEED an important consolidation to properly launch a boom cycle.
The further you are away from the last important consolidation, the closer you are to the next one.
The lower risk entry points is when the important consolidation ends.
You won't find that now.

SilverXAGUSD
- RSI - Divergence
- Fibonacci Level - 38.20% / 50.00%
- Demand Zone
- Break of Structure
- Completed " 12345 " Impulsive Waves

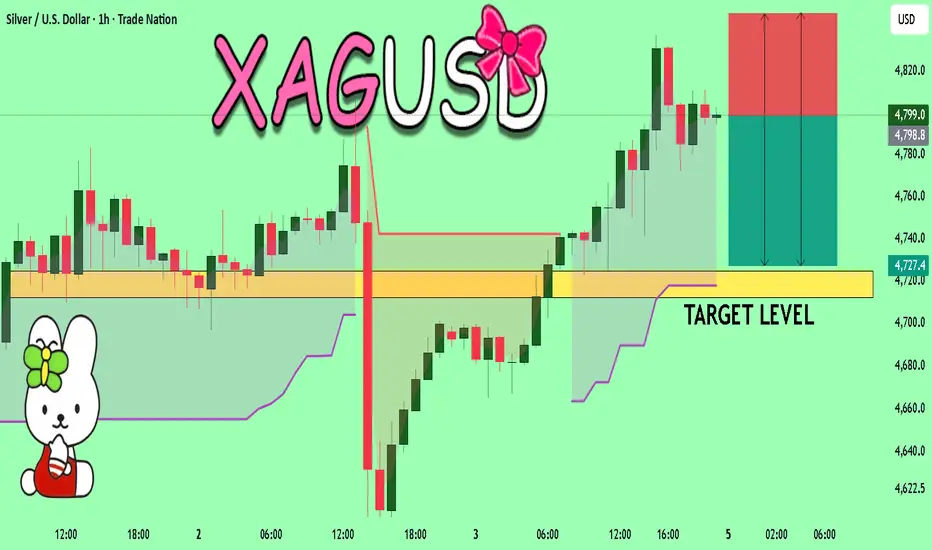
Silver Strategy Map — Thief Layers, Smart Targets, and Risk Zone📊 XAG/USD “Silver vs U.S Dollar” — Metals Market Wealth Strategy Map (Swing/Day Trade)
🔑 Plan: Bullish Setup
This setup follows the “Thief Strategy”, which means using layered limit entries to scale into the trade. Instead of going all-in at one level, we “steal the entries” across multiple layers.
💰 Layered Buy Limit Entries (Example Setup):
46.200
46.400
46.600
46.800
47.000
👉 You can increase layers as per your own plan and risk style.
🛑 Stop Loss (Protective Exit): 45.600
(This is my thief SL — but you’re free to adjust as per your own risk appetite.)
🎯 Target Zone: 49.000
⚠️ Around 49.300, we see a “Police Barricade” (heavy resistance + overbought conditions + potential trap).
That’s where profits should be taken — escape with gains before the trap closes!
Why This Setup?
Support Zones: Strong accumulation zones forming near 45.600–46.000.
Trend Bias: Silver remains bullish in the medium-term metals market outlook.
Layering Strategy Advantage: Reduces entry risk and allows better average fill.
Profit Zone: 49.000 aligns with strong supply area + RSI extension risk.
🔗 Correlation & Related Pairs to Watch
OANDA:XAUUSD (Gold vs USD): Gold often leads Silver’s moves — watch Gold for early signals.
TVC:DXY (US Dollar Index): A weaker USD usually boosts metals.
TVC:PLATINUM & CAPITALCOM:PALLADIUM : Industrial metals correlation — strong moves here can influence Silver sentiment.
TVC:SILVER Futures: Always track COMEX Silver contracts for volume confirmation.
✨ “If you find value in my analysis, a 👍 and 🚀 boost is much appreciated — it helps me share more setups with the community!”
📌 Disclaimer: This is a Thief-style trading strategy, created just for fun and educational sharing. Not financial advice — trade at your own risk.
#XAGUSD #Silver #Metals #TradingStrategy #SwingTrade #DayTrade #ThiefStrategy #Gold #DXY #Forex #Commodities
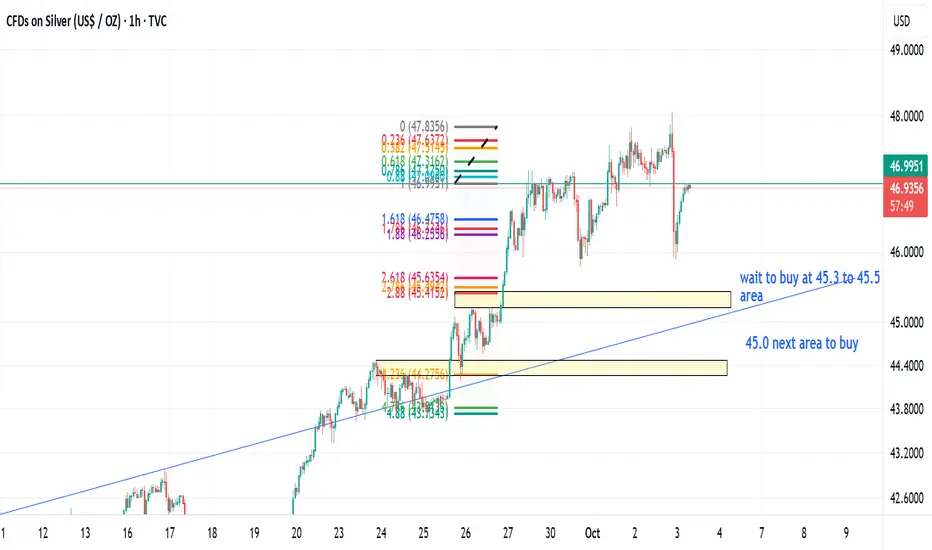
Friday 3 October Silver trade Idea Silver had dropped from 48.0 yesterday.
Based on
1. Dominant Candle break Fibo
2. Support and Resistance
3. Trendline support
Next price level to consider to buy is 45.3-45.5 area, if it drop further, we can look at 45.0 area.