Trade ideas

Monthly Metals Analysis: Gold (XAUUSD), Issue 211 The analyst expects XAGUSD’s price to rise by the specified end time, based on quantitative analysis.
The take-profit level only indicates the potential price range during this period — it’s optional and not a prediction that price will reach it.
You don’t need to go all-in or use leverage to trade wisely.
Allocating just a portion of your funds keeps overall risk minimal.
Our approach follows institutional portfolio principles — not the all-in or blow-up trading style often seen on social media.
Results are measured over the full time window, regardless of whether the take-profit level is hit.
The validity of this analysis is based on a specific time range (until 06 Jan 2025), and after this period, the analysis will be reviewed and updated (once every 28 days).
Next analysis : Monthly Forex Analysis: GBP/USD – Issue 213

Silver – Can the Break to Record Highs Be Maintained?Silver’s impressive upside run so far this week, which has seen it trade from a low of 56.165 on Monday to register a new record high at 58.96 yesterday, seems to be taking a pause in early trading on Thursday morning, with the price currently trading down around 1.8% at 57.44 at time of writing (0700 GMT).
With liquidity in the Silver market nowhere near as deep as in its bigger parent Gold, these types of exaggerated moves can happen more frequently, especially when trading at new extremes such as the record high that was reached a mere 24 hours ago. Where Silver moves next into the weekend may be determined by a combination of factors, such as positioning, performance of the US dollar and technical factors.
From a positioning standpoint, the debasement trade which has been underpinning much of Silver’s rally over the last 3-6 months still remains in place but can at times be subject to pullbacks as the trade can get crowded and this may be part of the reason for the drop this morning. There could be potential for further profit taking into Friday’s close, especially with the pivotal Federal Reserve interest rate decision now less 7 days away (December 10th).
From the US dollar point of view, as mentioned above, with the Fed rate decision now around the corner, traders may be more sensitive to the release of any available US labour market data. Today’s scheduled release of the Challenger Job Cuts at 1230 GMT and Weekly Jobless Claims at 1330 GMT could lead to further US dollar volatility, which may impact Silver prices. As a general rule a higher dollar makes Silver more expensive for foreign investors and vice versa.
Finally, interlinked with these two drivers are the technicals. Whether key support or resistance levels hold or a broken on a closing basis could lead to bigger directional moves into the weekend or early next week. So being apprised of these levels in advance can be prudent from a risk management approach.
Technical Update: Can New All-Time Highs Maintain The Push Higher?
Silver has enjoyed a positive late‑November to early‑December period, advancing more than 21% from the November 21st low of 48.62 to Wednesday’s 58.96 high. This move has produced new all‑time highs, with fresh upside acceleration following the closing break above the previous 54.45 October 17th record high.
While it might be argued that this type of price activity remains constructive with the potential for further gains, some traders may view the latest upside moves as becoming over‑extended, raising the risk of future price weakness.
In this environment, staying aware of relevant support and resistance levels may prove valuable in gauging Silver’s next directional themes.
Possible Resistance Levels: .
New all‑time highs place price activity into uncharted territory, making it difficult to establish valid resistance levels. In such cases, Fibonacci extensions can provide valuable guidance, highlighting potential areas where fresh selling pressure may emerge once more.
For Silver, Fibonacci extension calculations based on the last significant correction seen between October 17th and October 28th suggest that current price strength may be approaching a potential resistance at 59.79, which is the 61.8% extension level.
A closing break above 59.79 might now be required to open scope for a push to higher levels like the 100% extension level which sits at 63.15.
Possible Support Levels:
It is often difficult to determine with certainty when upside conditions have become over‑extended and of course this alone doesn’t guarantee price weakness. As such, closing breaks below support may be required to trigger a corrective phase in price. In the case of Silver, traders may view Monday’s session low of 56.16 as the first support.
Closing breaks below the 56.16 level, if seen, could reinforce the possibility of over‑extended upside conditions leading to continued price weakness. Such moves could open the way for tests of 54.95, which is the 38.2% Fibonacci retracement, and possibly even extend toward 53.75, the deeper 50% retracement level.
The material provided here has not been prepared accordance with legal requirements designed to promote the independence of investment research and as such is considered to be a marketing communication. Whilst it is not subject to any prohibition on dealing ahead of the dissemination of investment research, we will not seek to take any advantage before providing it to our clients.
Pepperstone doesn’t represent that the material provided here is accurate, current or complete, and therefore shouldn’t be relied upon as such. The information, whether from a third party or not, isn’t to be considered as a recommendation; or an offer to buy or sell; or the solicitation of an offer to buy or sell any security, financial product or instrument; or to participate in any particular trading strategy. It does not take into account readers’ financial situation or investment objectives. We advise any readers of this content to seek their own advice. Without the approval of Pepperstone, reproduction or redistribution of this information isn’t permitted.

Unlocking Global Market Potentiality1. Understanding Global Market Potentiality
Global market potentiality refers to the capacity of a business, sector, or economy to expand internationally by tapping into new customer segments, geographic regions, or emerging market trends. It includes evaluating:
Market size and future growth trajectory
Consumer behaviour, demographics, and purchasing power
Technological readiness and adoption
Competitive intensity and entry barriers
Regulatory environments and trade policies
Economic cycles and geopolitical stability
The core idea is to identify where the next wave of demand will arise and position your business to serve it early.
2. Why Global Expansion Matters More Than Ever
Several structural shifts make global expansion a necessity rather than an option:
a) Saturation in Domestic Markets
Many industries face slow growth at home due to mature consumption patterns. Global markets offer fresh demand and diversification.
b) Rising Middle Class in Emerging Economies
Asia, Africa, the Middle East, and Latin America are witnessing unprecedented income growth. This expands consumer demand for retail, financial services, healthcare, and technology.
c) Digital Connectivity
E-commerce, online services, fintech, and automation allow a business to reach global customers without heavy physical infrastructure.
d) Supply-Chain Diversification
Businesses can optimize costs, reduce risk, and improve efficiency by sourcing and manufacturing across multiple regions.
e) Competitive Advantage
Companies operating globally gain exposure to innovation, talent, and ideas—accelerating long-term competitiveness.
3. Key Pillars to Unlock Global Market Potentiality
a) Deep Market Research & Intelligence
The first step is thorough market analysis:
TAM, SAM, SOM evaluation
Demand forecasting
Cultural insights and consumer behaviour
Competitor benchmarking
Pricing and localization requirements
Tools such as data analytics, AI-driven forecasting, and global market databases help businesses identify high-potential regions with precision.
b) Understanding Local Regulations
Every market has unique legal requirements:
Import/export rules
Trade agreements and tariffs
Licensing and certifications
Data privacy and digital compliance
Taxation and repatriation of profits
Compliance reduces risk and prevents costly delays. Successful companies take a proactive approach through local legal teams or partnerships.
c) Building a Localized Strategy
A global strategy succeeds only when it feels local. Localization can include:
Tailored product designs
Customized marketing messages
Local languages and cultural alignment
Region-specific pricing
Local payment systems and logistics
For example, payment adoption differs widely—UPI in India, Alipay in China, and card-heavy systems in Europe.
d) Strong Global Brand Positioning
A credible global brand signals trust. Brand positioning should combine universal values (quality, reliability, innovation) with tailored regional messaging.
e) Digital-First Global Entry
Technology accelerates international growth:
E-commerce platforms
Social media for global brand visibility
Cloud-based operations
AI-driven customer segmentation
Cross-border digital payments
SaaS distribution models
Digital entry reduces costs and creates scalable access to multiple markets.
f) Strategic Partnerships & Alliances
Local partners accelerate learning and reduce risk:
Distributors and channel partners
Local manufacturers
Franchise operators
Government or regulatory coordination
Joint ventures for shared expertise
These partnerships help companies navigate cultural, legal, and logistical challenges.
g) Flexible Global Supply Chain & Operations
Operational excellence is key to serving global demand:
Multi-country manufacturing
Nearshoring or friend-shoring
Smart warehousing
Real-time logistics tracking
Vendor diversification
Resilient supply chains protect a business against disruptions like political instability, pandemics, and climate events.
4. Emerging High-Potential Global Markets
Several regions now present outsized opportunities:
1. Asia-Pacific
India, China, Indonesia, Vietnam, Philippines → Rapid urbanization and digital-first consumers.
2. Middle East & GCC
Saudi Arabia & UAE → Economic diversification, luxury demand, infrastructure investment.
3. Africa
Kenya, Nigeria, South Africa → Rising digital adoption, youthful population, fintech growth.
4. Latin America
Brazil, Mexico, Chile → Expanding middle class and commodity-driven growth.
Each region offers distinct opportunities in sectors like fintech, renewable energy, EVs, healthcare, edtech, logistics, and consumer goods.
5. Industry Sectors with the Highest Global Potential
a) Technology & Digital Services
AI, cloud computing, cybersecurity, automation, SaaS, digital payments.
b) Healthcare & Pharmaceuticals
Demand increasing due to aging populations, chronic diseases, and biotechnology.
c) Renewable Energy
Solar, wind, hydrogen, green technology, EV ecosystem.
d) Consumer Goods & Retail
Apparel, FMCG, lifestyle products, luxury retail.
e) Infrastructure & Real Estate
Smart cities, construction, urban development.
f) Agriculture & Food Processing
Global food security and supply chain modernization.
g) Financial Services
Fintech, insurance, wealth management, cross-border investing.
6. Risks in Global Expansion & How to Mitigate Them
Unlocking global potential also involves addressing risks:
a) Geopolitical Instability
Use diversified markets and supply chains to minimize exposure.
b) Currency Volatility
Hedge using forex instruments or multi-currency accounts.
c) Cultural Misalignment
Invest in localization and local leadership teams.
d) Regulatory Complexity
Maintain compliance through legal counsel and continuous monitoring.
e) Competitive Pressure
Innovate faster, build brand loyalty, and offer differentiated value.
f) Operational Challenges
Adopt scalable digital infrastructure and supply-chain automation.
7. The Role of Innovation in Global Success
Innovation is the engine that unlocks global potential:
AI-driven product development
Manufacturing automation
Sustainability and green innovation
Data-led decision-making
Digital-first customer interfaces
Companies that innovate grow faster, capture new segments, and outperform global competitors.
8. Building a Future-Ready Global Strategy
A strong global strategy includes:
Vision: Clear long-term goals
Market Prioritization: Choosing high-ROI markets
Execution Framework: Market entry → expansion → consolidation
Resource Allocation: Capital, talent, technology
Continuous Learning: Monitoring trends and adapting
This ensures that the business remains resilient, competitive, and scalable across markets.
Conclusion
Unlocking global market potentiality is not a one-time decision—it is a continuous strategic journey. Companies that successfully globalize benefit from expanded customer bases, diversified revenue streams, innovation exposure, and long-term resilience. With the right combination of market research, localization, regulatory alignment, digital strategy, partnerships, and supply chain strength, businesses can turn global opportunities into sustainable success. The future belongs to companies that think internationally, act strategically, and adapt quickly to global change.
Silver Nears Pennant Breakout, Yet Downside Risks RemainSilver prices were overbought heading into the week of trading on 1 December. However, after reaching those overbought levels, prices consolidated for much of the week, struggling to move above resistance at $59 per contract.
Following a week of consolidation, silver prices now appear poised to push higher again. They have formed what looks to be a pennant pattern, and a move above roughly $58.90 would confirm a breakout. Extrapolating the size of the prior advance suggests silver, and based on 100% of that rise, it could reach around $65 in the near future.
Momentum indicators, including the RSI, continue to show that silver remains in an uptrend, indicating that momentum is still strong. On that basis, once this consolidation phase ends, silver could be on its way to significantly higher levels.
If silver fails to break out and instead moves lower, falling beneath the uptrend within the pennant pattern, it would likely need to drop below $56.50 to confirm a negative break. Such a move would probably see silver prices retreat to around $51.50, which was the support–resistance level identified as the metal formed its cup-and-handle pattern in late November.
If, for any reason, support at $51.50 proves insufficient and fails to hold, silver could decline towards support at around $47.50, which marks the lower end of the cup-and-handle pattern and also aligns with the lower Bollinger Band.
Written by Michael J. Kramer, founder of Mott Capital Management.
Disclaimer: CMC Markets is an execution-only service provider. The material (whether or not it states any opinions) is for general information purposes only and does not take into account your personal circumstances or objectives. Nothing in this material is (or should be considered to be) financial, investment or other advice on which reliance should be placed.
No opinion given in the material constitutes a recommendation by CMC Markets or the author that any particular investment, security, transaction, or investment strategy is suitable for any specific person. The material has not been prepared in accordance with legal requirements designed to promote the independence of investment research. Although we are not specifically prevented from dealing before providing this material, we do not seek to take advantage of the material prior to its dissemination.

Technical Analysis: Silver (XAG/USD) - Monthly & Weekly Outlook1. Price Action & Breakout:
Silver has successfully broken out and consolidated above the key $48 level on the weekly timeframe with a strong bullish candle.
This breakout is technically significant and confirms buyer strength.
2. Trend Analysis:
Primary Trend: 🟢 Strongly Bullish on both Monthly and Weekly timeframes.
The long-term structure remains upward, but caution is advised in the short term.
3. Market Condition & Warning:
⚠️ Overbought Alert: All timeframes are currently showing overbought conditions based on key oscillators (RSI, Stochastic).
While the trend is bullish, the risk of a corrective pullback has increased substantially.
4. Chart Pattern & Targets:
Major Pattern: A Long-Term Cup and Handle pattern has formed and is now CONFIRMED with the recent breakout.
Long-Term Projection: Based on pattern measurement, potential targets are set at:
Target 1: 65$
Target 2: 90$
5. Important Consideration:
Missing Correction: Notably, a meaningful pullback following the weekly breakout has NOT yet occurred.
High Volatility Expected: Silver's path upward is likely to be characterized by significant volatility and sharp corrections.
Key Levels:
Support: $48.00 (Previous Resistance, now support)
maybe Resistance: $65.00 (Psychological Level)
Bias: 🟢 Bullish for the long-term, but expect high volatility.
OANDA:XAGUSD #SILVER - Monthly/Weekly
✅ CONFIRMED BREAKOUT above $48 on Weekly.
✅ LONG-TERM CUP & HANDLE pattern activated.
🟢 TREND: Strongly Bullish (M & W).
🎯 LT TARGETS: $90 - $100 (Pattern Based).
⚠️ WARNING: All TFs in Overbought territory. No significant pullback yet. High volatility expected. Trade with caution!
"We view silver as a strong investment and have added it to our portfolio."🔥
Disclaimer: This is our team's analysis, not investment advice. The markets are highly volatile. Always do your own research before trading.
What are your thoughts on Silver's next move?

Hit All Your Monthly Targets with XAGUSDLadies and gentlemen, XAGUSD is about to activate a trigger that could kick off another uptrend rally for silver—but nailing it won't be that easy... let's break it down. 🔍
I’m Skeptic , founder of Skeptic Lab. If you want to elevate your long-term performance through genuine psychology, data-driven insights, and proven strategies, you’ve landed in the right spot.
In the daily timeframe, after smashing through the ceiling at 54.47959 and surging 8% , we're now ranging just below the resistance at 58.79759 . But every candle that's printed has been pushing hard to break this level: long lower shadows and short upper ones, signaling sellers tried to drag the price down, but buyers fought back fiercely and closed the body strong.
Tomorrow's rate news drops. Over 89.6% are betting on a 25 basis point cut (source: according to the CME FedWatch Tool). What does this mean in plain English? Borrowing gets cheaper, liquidity floods into stocks, companies ramp up investments = boom for commodities, equities, and Bitcoin. But on the flip side, the market might have already priced this in.
Silver's massive run-up these past weeks? Largely because forecasts have been screaming "rate cut incoming"...
My take? If we can open the position today and lock in profits tomorrow pre-news—making it fully risk-free—that's ideal. If we hit stop loss, hey, we gained real market insight (priceless), and exited with zero risk hanging over us. Win the trade? Massive R/R upside. + Slash your risk—drop from 1% to 0.1% exposure—so a stop barely stings. (News trades have lower win rates, hence the low risk play :) )
In the 1H timeframe, a breakout candle above 58.79759 fires our long trigger. Stay out of lower frames, please! They're full of shit candles, insane volatility, and fakeout traps—since the core momentum and real action is locked in 1H right now.
That's it—DO NOT FOMO in, and if this analysis hits your feed, a quick boost on that rocket button keeps the vibes going :) 🩵
Now get outta here.

Silver is not done yetthis one seems easy on the eye, i dont really trade silver but target seems obvious

SilverDivergence, Double top then Triple Top, Rising wedge, Resistance played its role now, trend line is at breakup point. I guess its a retracement of silver till Fib 0.382

analyse for silver
what did i tell u guys???!!! just check my last update and u will see.
have a great week

XAGUSD 1h
Silver hold the price above a resistance line in the consolidation zone, if the 4h candle closed above this line there would be chance to move upward, also for swingers, we need to see close of daily candle above the box to meet ATH.
Stay tuned for our next updates.


Silver: corrective pause after growthSilver (XAGUSD) has entered a corrective phase after a confident rally. The chart shows that upward impulses have begun to lose strength, while the price is gradually shifting lower, forming a pullback structure.
The current dynamics suggest that the market is seeking balance after the previous rise. Corrective moves are becoming more pronounced, and consolidation near local resistance levels reflects buyer caution.
The fundamental backdrop also provides no clear support: interest in safe-haven assets remains, but dollar strength puts pressure on silver. As a result, the asset stays in a corrective zone, where the next direction will depend on the reaction to key levels.
Thus, XAGUSD is in a pullback phase, and the market’s next steps will determine whether the correction develops into a deeper decline or becomes preparation for a new impulse.

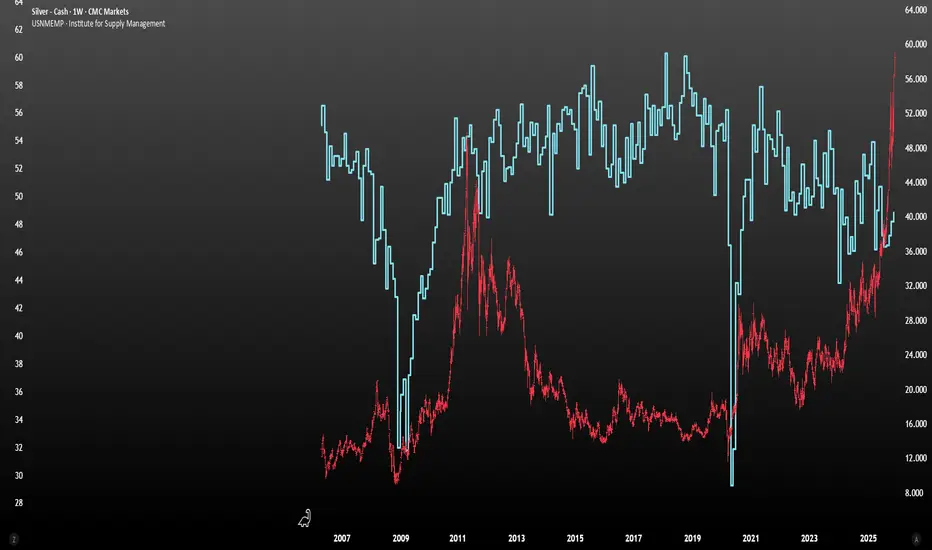
50 Shades of Grey Metal : A Silver Price StorySilver BULL PHASE PRICE PREDICTION MODEL
1. Using Historical GOLD/SILVER Ratio:
The Gold/Silver ratio has once again demonstrated its value as a long-term cyclical indicator. Historically, readings above 100 suggest a significant valuation disparity in which gold becomes relatively expensive and silver presents an attractive upside opportunity.
In the current cycle, gold appears to have formed a top near $4,200, after which silver initiated a confirmed breakout. As a result, the Gold/Silver ratio has already compressed to approximately 70. Should this trend continue toward its historical mean near 40, the implied price target for silver becomes substantially higher.
Under the assumption that gold remains capped around $4,200, a ratio of 40 would project silver at roughly $105 per ounce. With the metal currently trading around $69, this scenario indicates a potential appreciation of approximately 50% from present levels.If we assume gold topping at $5000 and GOLD/SILVER ratio reach 45-40 then Silver price will be $110-125.
Gold tops at $4200 -> Silver $105
Gold tops at $5000 -> Silver $110-125
2. Using Silver Technical Analysis:
Technically, silver has completed a major breakout from a long-term rounded bottom—also known as a saucer pattern. This structure has been forming for decades, with the key resistance level sitting near $48, a price ceiling that held for almost 45 years. Silver’s decisive move above this historic barrier, followed by a surge to a new all-time high of $69, confirms the validity and strength of the breakout.
Using the measured-move methodology typically applied to rounded bottom/saucer patterns, the projected upside target for this formation comes in around $85. This level represents the technical completion of the pattern and serves as a logical intermediate target within the broader bull phase.
3. Using Historical Silver Bull Market as a Price Guide:
Historically, during the major bull cycles of the 1980 and 2011, silver advanced by more than 1,000%, underscoring its tendency for extreme upside acceleration once momentum takes hold. If silver were to exhibit a comparable structural move in the current cycle—supported by the strength of the recent breakout and the robust momentum profile—the metal could reasonably target the $140–$150 range. Such a move would represent an appreciation of roughly 200% above the previous all-time high, aligning with the magnitude of past parabolic phases observed in the silver market.
BOTTOM LINE
Considering the convergence of these three analytical approaches—combined with my market experience, as well as the prevailing sentiment and momentum—silver appears positioned to reach the $120 range as a reasonable and achievable target for the current bull phase.
CAUTION: EDUCATION PURPOSE ONLY. NOT INVESTMENT ADVICE. DYOR

SILVER BEARS WILL DOMINATE THE MARKET|SHORT
SILVER SIGNAL
Trade Direction: short
Entry Level: 5,843.1
Target Level: 5,765.0
Stop Loss: 5,895.0
RISK PROFILE
Risk level: medium
Suggested risk: 1%
Timeframe: 9h
Disclosure: I am part of Trade Nation's Influencer program and receive a monthly fee for using their TradingView charts in my analysis.
✅LIKE AND COMMENT MY IDEAS✅

Markets don’t move randomly — they leave signals.Here are two technical cues that lined up ahead of the recent rally in silver:
🔹 10th November → A confirmed buy signal on the Directional Movement Index (DMI). The BLUE line crossed above the ORANGE line and broke past previous peaks on the indicator.
🔹 21st November → A bounce off the trendline + 55 day moving average. This same trendline first acted as support, then flipped to resistance, and later back to support — a classic example of the Polarity Principle in action.
📈 These signals highlight how technical analysis can map out market sentiment shifts.
Disclaimer:
The information posted on Trading View is for informative purposes and is not intended to constitute advice in any form, including but not limited to investment, accounting, tax, legal or regulatory advice. The information therefore has no regard to the specific investment objectives, financial situation or particular needs of any specific recipient. Opinions expressed are our current opinions as of the date appearing on Trading View only. All illustrations, forecasts or hypothetical data are for illustrative purposes only. The Society of Technical Analysts Ltd does not make representation that the information provided is appropriate for use in all jurisdictions or by all Investors or other potential Investors. Parties are therefore responsible for compliance with applicable local laws and regulations. The Society of Technical Analysts will not be held liable for any loss or damage resulting directly or indirectly from the use of any information on this site.

SILVER My Opinion! SELL!
My dear followers,
I analysed this chart on SILVER and concluded the following:
The market is trading on 58.349 pivot level.
Bias - Bearish
Technical Indicators: Both Super Trend & Pivot HL indicate a highly probable Bearish continuation.
Target - 57.776
Safe Stop Loss - 58.724
About Used Indicators:
A super-trend indicator is plotted on either above or below the closing price to signal a buy or sell. The indicator changes color, based on whether or not you should be buying. If the super-trend indicator moves below the closing price, the indicator turns green, and it signals an entry point or points to buy.
Disclosure: I am part of Trade Nation's Influencer program and receive a monthly fee for using their TradingView charts in my analysis.
———————————
WISH YOU ALL LUCK

XAG/USD : Bearish Pullback Meets Bullish Reversal at Key DemandXAG/USD 30-Minute Chart Analysis: Bearish Pullback Meets Bullish Reversal Signals at Key Demand Zone
This TradingView chart, authored by GoldMasterTrades on December 4, 2025, at 13:49 UTC-5, depicts the XAG/USD (Silver/US Dollar) pair on a 30-minute timeframe. It illustrates intraday price action spanning approximately December 2 to December 6, 2025, based on the x-axis timestamps (from 21:00 on Dec 2 through 12:00 on Dec 6). The candlestick format highlights a recent downtrend amid high volatility, with annotations pointing to a potential bullish turnaround. At the time of the snapshot, XAG/USD is quoted at 57.319, with a high of 57.424, low of 57.186, close of 57.234, marking a decline of -0.085 (-0.15%) and robust volume of 19.61K.
The overall narrative captures silver's volatile nature in late 2025, where the metal has surged over 83% year-to-date amid supply fears and industrial demand, but now faces short-term corrective pressure. The chart shows a sharp sell-off from highs near 58.00, probing a reversal zone around 57.20, accompanied by a volume burst and pattern bust—classic signs of exhaustion and impending recovery. This setup aligns with broader market dynamics, where silver recently hit record highs above $58.85 before pulling back. Below, I'll dissect the chart in a professional TradingView idea style, incorporating technical details, fundamentals, and trader insights for comprehensive depth.
Chart Overview and Timeframe Context
The 30-minute chart provides granular insights into short-term momentum, perfect for day traders navigating silver's sensitivity to USD strength, interest rates, and commodity cycles. XAG/USD, often correlated with gold but amplified by industrial uses (e.g., solar panels, electronics), has been in a parabolic uptrend throughout 2025, breaking all-time highs amid global supply constraints.
Key visual components:
Candlesticks: A series of red bearish bodies dominate the left and center, indicating seller control, with increasing wick lengths signaling volatility. Recent candles at the bottom show smaller bodies and longer lower shadows, hinting at buyer defense.
Annotations:
Green horizontal band: "Reversal Zone - Demand Zone" around 57.00–57.20, with a green circle marking the pivot low.
Purple label: "Volume Burst" at the trough, denoting a surge in activity.
Black upward arrow and label: "Pattern Bust," suggesting a failed bearish continuation.
"Ask" in red at 57.436 and "Bid" in blue at 57.237, reflecting the current spread.
U.S. flag and lightning icons at the bottom, likely indicating U.S. data releases (e.g., ahead of key jobs data).
Price Scale: Y-axis from ~56.00 to 59.00, with the action centered around 57.00–58.00, a psychologically significant area post-recent highs.
This configuration screams "bull trap reversal": bears push aggressively lower, but high-volume absorption at support sets the stage for a squeeze higher.
Technical Analysis: Patterns and Indicators
From a pure price action lens, the chart reveals a corrective pullback within a larger uptrend, with reversal cues emerging:
Downtrend Structure: The left side features a topping pattern with lower highs from ~58.50, cascading into a steep decline of about 1.5% (over 80 pips). This forms a descending channel, with red candles exhibiting long upper wicks—evidence of rejection at resistance. The move likely triggered by profit-taking after silver's explosive rally to $58.85 earlier in the week.
Reversal Zone and Demand Dynamics: The green band (57.00–57.20) represents a high-probability demand zone, where prior support (possibly from 4H/ daily charts) intersects with Fibonacci levels (e.g., 38.2% retracement of the recent leg up). Price tagging this area with a "Volume Burst" indicates capitulation: sellers exhaust, and institutions accumulate. In ICT/SMC frameworks, this is a liquidity sweep followed by order block defense.
Volume Burst and Momentum Shift: The purple annotation highlights a spike in volume (19.61K overall, but localized burst at lows), a bullish divergence signal. High turnover at extremes often precedes reversals, as it reflects panic selling absorbed by smart money. If overlaid with RSI (implied but not shown), expect oversold readings rebounding above 30.
Pattern Bust Mechanics: The "Pattern Bust" label with an upward arrow points to a failed bearish setup—likely a flag or head-and-shoulders continuation. Instead of breaking lower, price rejects the zone and forms a potential hammer/doji, trapping shorts and fueling a short-covering rally. A close above 57.50 would confirm the bust, targeting prior highs.
Key Levels and Projections: Support holds at 57.00 (zone low), with resistance at 57.80 (mid-channel) and 58.00 (psychological). Upside extensions could reach 58.50–58.90, aligning with record highs. Downside risks if the zone fails: 56.60–56.00, as noted in recent analyses.
This technical picture favors bulls if confirmed, but silver's volatility demands caution—average true range (ATR) likely elevated post-surge.
Fundamental Context for XAG/USD
Silver's 2025 performance has been stellar, up over 83% YTD driven by industrial demand (e.g., green energy) and supply fears, but December 4 sees a 1.67% dip to 57.51 amid USD rebound and data anticipation. Key drivers include:
Supply Constraints: Growing fears of shortages have propelled prices, with analysts eyeing $60+ long-term.
Economic Data: Pullback tied to rejection at $58.90 ahead of U.S. jobs data, which could influence Fed rate cut expectations.
Market Sentiment from X: Recent posts show mixed views—bullish on record breaks (e.g., "Ons Gümüş 58.8$ seviyesiyle tüm zamanların rekorunu kırdı") but bearish targets to 53-54$ if downside accelerates. Traders signal buys on H1 timeframes if 57.52 holds, or shorts on breaks. Elliott Wave forecasts suggest more upside post-correction.
Cross-reference with economic calendars: Watch NFP or inflation prints for volatility spikes.
Trade Idea: Bullish Reversal Setup with High R:R Potential
Capitalizing on the chart's signals:
Entry: Long on confirmation above 57.40 (breaking the downtrend line), or dip-buy in the reversal zone with volume support.
Stop Loss: Below the demand low at 56.90, risking 30–50 pips.
Take Profit: TP1 at 57.80 (prior resistance), TP2 at 58.50 (recent highs), TP3 at 59.00+ if momentum builds. Trail stops using 30-min ATR.
Risk-Reward Ratio: 1:2 minimum—aim for 60–100 pips upside.
Alternative: Short on zone failure below 57.00, targeting 56.60.
Timeframe Fit: Suited for intraday (2–8 hours), aligning with London/NY sessions.
This idea leverages SMC concepts like order blocks and liquidity grabs for edge.
Risk Management and Trader Mindset
Silver's leverage amplifies risks—volatility can wipe accounts without discipline. Core principles:
Position Sizing: Risk 0.5–1% per trade; use calculators to scale based on stop distance.
Emotional Control: Don't chase—wait for pattern bust confirmation to avoid whipsaws. Journal setups for review.
Multi-Timeframe Validation: Check 1H/4H for uptrend intact; avoid trading during low-liquidity hours.
Broader Mindset: View pullbacks as opportunities in bull markets. Study historical silver zones (e.g., 2021 surge) for patterns. Continuous education via webinars or X communities enhances edge.
Cautionary Note: Fundamentals like Fed policy can override techs—trade with news filters.
In summary, this 30-minute XAG/USD chart signals a high-conviction bullish reversal amid a corrective dip, with volume and structure supporting upside. If validated, it could propel silver back toward $58–60 resistance. Monitor real-time developments on TradingView or reliable platforms. Trade responsibly.


Silver’s Next Move in an Overextended PositionAfter breaking out of what appeared to be a cup-and-handle pattern on 25 November, silver prices have surged from around $51.40 to $58.65. The metal now looks overextended, with the RSI at 75.25, and trading above its upper Bollinger Band for the fourth consecutive day. This suggests that silver may be due for a retest of the 20-day moving average or for a few days of sideways consolidation before the next move is established.
On the hourly chart, silver prices have formed what appears to be a trading range since 30 November, broadly between $56.60 and $58.90, with $58.90 acting as resistance and $56.60 as support. A break below $56.60 could set up a move back towards $53.90, which would then become an important level of support. If that were to be broken, silver could potentially fall further towards $50.75. Such a development might also indicate that a larger reversal is starting to take shape, although it is far too early to make that assumption.
Conversely, a breakout above $58.90 would be a very bullish signal and would suggest that silver’s move higher could extend for some time. While a precise price objective is difficult to determine, using a 100% extension of the breakout to the recent high at $58.90 would imply that silver could rise to around $67.10.
Written by Michael J. Kramer, founder of Mott Capital Management.
Disclaimer: CMC Markets is an execution-only service provider. The material (whether or not it states any opinions) is for general information purposes only and does not take into account your personal circumstances or objectives. Nothing in this material is (or should be considered to be) financial, investment or other advice on which reliance should be placed.
No opinion given in the material constitutes a recommendation by CMC Markets or the author that any particular investment, security, transaction, or investment strategy is suitable for any specific person. The material has not been prepared in accordance with legal requirements designed to promote the independence of investment research. Although we are not specifically prevented from dealing before providing this material, we do not seek to take advantage of the material prior to its dissemination.
SILVER BEST PLACE TO BUY FROM|LONG
SILVER SIGNAL
Trade Direction: long
Entry Level: 5,701.3
Target Level: 5,814.5
Stop Loss: 5,626.2
RISK PROFILE
Risk level: medium
Suggested risk: 1%
Timeframe: 1h
Disclosure: I am part of Trade Nation's Influencer program and receive a monthly fee for using their TradingView charts in my analysis.
✅LIKE AND COMMENT MY IDEAS✅

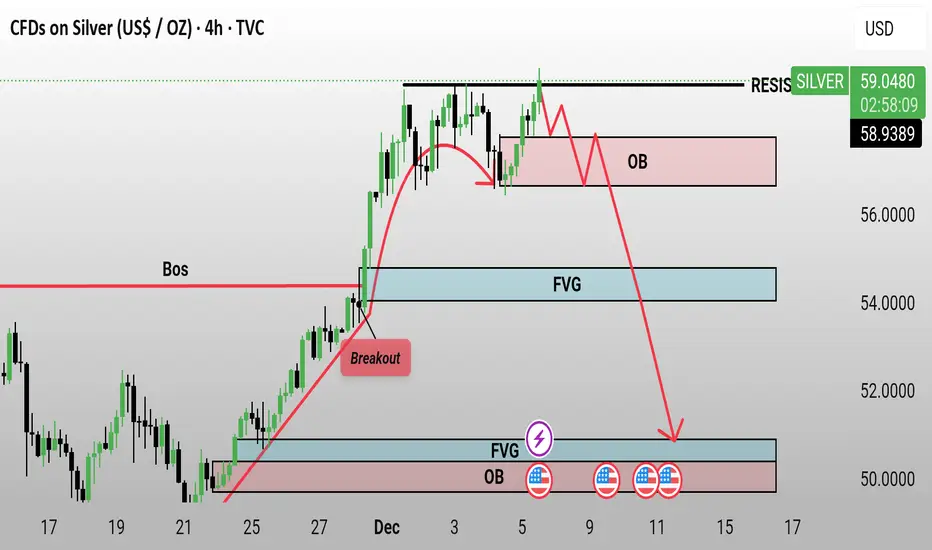
Silver: Structural High Rejection - Watch for OBSilver has completed a major upward impulse, pushing to multi-year highs near $58.90. The price is currently at the RESISTANCE level, which often precedes a significant correction after a strong rally. The Relative Strength Index (RSI) is nearing overbought territory, suggesting strong momentum but potentially running out of power.
Structural Analysis: Short Setup Rationale
Supply Zone Test: The price has stalled right at the $59.00 RESISTANCE. This is the ceiling where sellers are expected to step in after the strong rally (Breakout).
Order Block (OB) as Pivot: The immediate support is the Order Block (OB) zone just below the current price (around $56.00 - $57.00). This OB is the pivot point for the short trade.
The Trigger: The short entry is confirmed by a Breakdown—a strong 4H candle close below the immediate OB. This would signal a structural shift, with supply overcoming the current demand.
Target Liquidity: If the structural pivot fails, the market will target the deeper liquidity zones to mitigate imbalances:
Invalidation
The bearish setup is invalidated if the price successfully breaks and closes above the $59.00 RESISTANCE level, which would signal a further push higher, likely toward a new high.
Just a chart showing the price targets for silverJust a price chart tracking price targets for silver. After it's all over, it's interesting to see who was close, and what their methods were.
