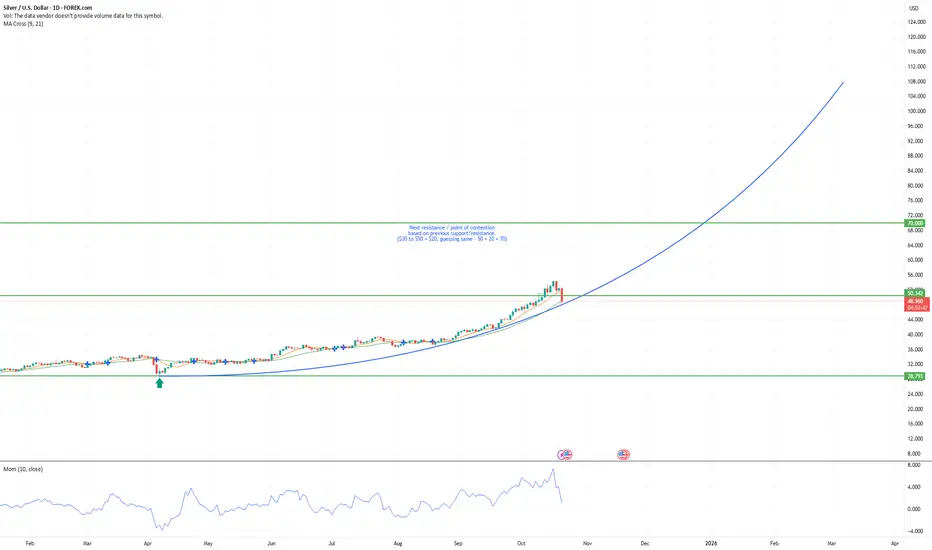
Silver BUY Region 40-42$Above chart overlays previous BULL cycle of Silver on the current time frame.
Commodities are having bull run, Silver has broken previous all time high and likely to go higher upon consolidating near all time high.
Silver might consolidate and may drop 40-42$ (in December). It will likely continue the bull cycle for couple of years.
Why?
- Expensive Gold will make Silver an attractive choice for Jewelry, Industrial use and with increasing electronics its demand is likely to go up.
- As China will continue to rise and replace USD as reserve currency, hence (in next 5-10 years) all hard assets will be safe heaven for wealthy Americans (Land, Gold, Silver, etc).
- USA is expected to print ~4TN Dollar in next 3 years (with Quantitative easing) to pay interest on debt.
Trade ideas


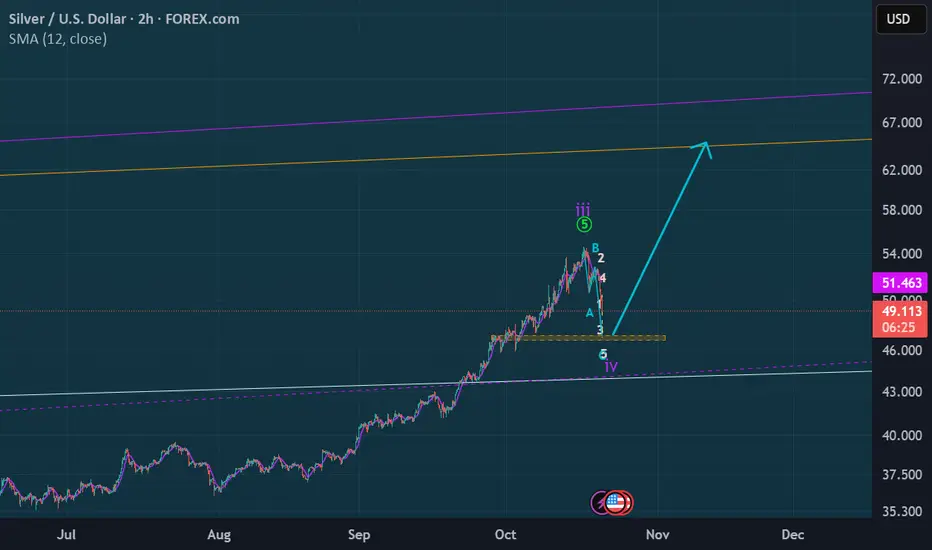
Parabolic pipedream (cont'd)This is an update to my parabolic pipedream idea. I have adjusted the parabola slightly. We now have two touch points on the parabola.
- Middle point was moved to the recent low from Tuesday Oct. 21 2025
- Upper point moved to adjust trajectory (now we have two touches on the parabola)
My thought is the more spots we can get it to touch the parabola the more accurate it should be, and the more confidence I personally have about the idea.
Invalidation: I think the way this idea is invalidated is either by trading sideways too long or a horrific crash through parabola making it impossible to draw anymore. If it no longer can be portrayed as a parabola, we have lost.
Again I am not a trader, I am not a TA expert, I am just a noob watching Silver and making predictions. My track record is pretty bad, I would advise against trading on any of my ideas.
(some TA expert is looking at this and shaking their head lol)
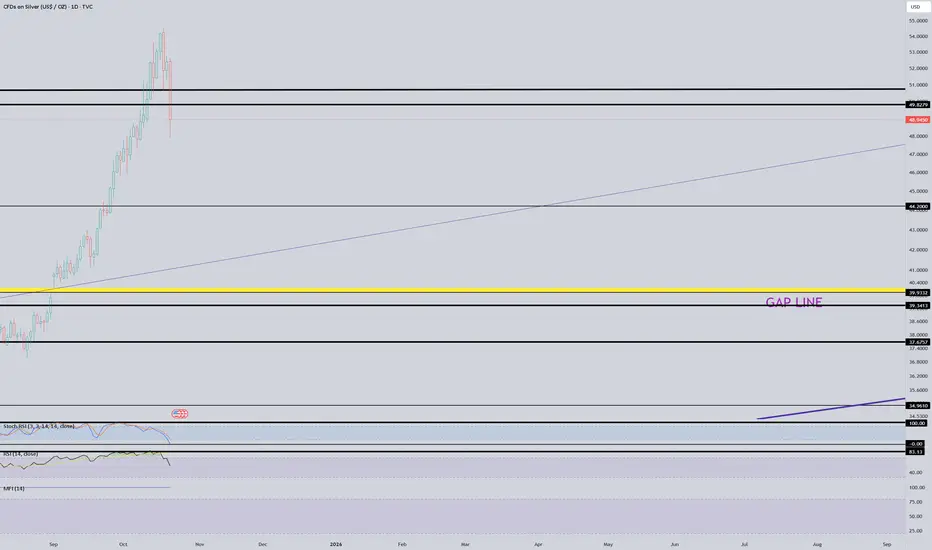
Major gap sitting there at $39 I have trouble believing this daily/weekly/monthly gap doesn't get filled at $39.
Keep an eye on this!
If it breaks below $44... I believe we're headed there.
This might become the last great opportunity to buy silver/stocks.
Silver Squeeze – Risk Reversals and Dollar Strength Sets InSilver has broken lower after recent highs, with the much-anticipated “silver squeeze” losing momentum. The market is now facing renewed pressure from a stronger U.S. dollar and broad risk-off sentiment, as investors trim exposure to commodities and metals.
The weekly close will be crucial — a bearish candlestick could confirm further downside potential, opening the door toward the USD 40.00 area, a key technical support zone.
Several factors are currently weighing on Silver:
- DXY rebound: The U.S. Dollar Index has bounced from support, attracting safe-haven demand and pressuring metals.
- Higher real yields: As inflation expectations ease, rising real yields make precious metals less attractive.
- ETF outflows: Institutional investors are trimming Silver ETF holdings, reducing speculative support.
- Weakness in industrial metals: A slowdown in China’s manufacturing sector is dragging down sentiment for Silver, which also has industrial demand.
- Technical exhaustion: After repeated tests of the USD 53.00 zone, momentum faded, and a breakdown below short-term moving averages confirmed a shift in tone.
If the current move continues, Silver could test USD 40.00 in the coming sessions. Only a decisive recovery above USD 52.00 would ease the short-term bearish outlook.

Silver at critical resistance, is a great collapse next?Silver has a long history of dramatic price spikes, each coinciding with significant global macro events:
June 1980, the Hunt Brother’s squeeze sent silver parabolic before collapsing
March 2011, post Global Financial Crisis (GFC) stimulus + QE mania led to another blow off top
Present day, amidst chaotic politics and incomprehensible levels of debt price action is once again testing the same resistance zone around $50
This area has proven to be a multi-decade resistance. Each prior approach ended in a swift and brutal correction.
Technical analysis
Monthly chart: Price action has surged aggressively. 300% since the lows of 2020 to the $45-50 resistance band, mirroring the same vertical rallies of 1980 and 2011.
RSI: A long term descending RSI resistance line connects the 1980 and 2011 tops. Current RSI is once again colliding with this barrier, hinting at exhaustion.
Momentum: While silver is undeniably strong, history suggests the upside risk may be limited at these levels compared to the downside potential.
Risk reward breakdown
Upside potential: A clean breakout above $50 could open the door to a true price discovery phase possibly $60+ if silver enters a secular commodities super cycle.
Downside risk: Failure here would mimic the historic collapses:
1980: -90% drawdown
2011: -70% drawdown
A pullback to $25-30 would not be unusual, especially if macro liquidly tightens.
Trading strategy ideas:
Aggressive traders: Consider short setups or profit taking near the $50 resistance, with stops above $52-53 to manage risk.
Conservative traders: Wait for confirmation, either a monthly breakout or close above $50 (bullish) or a strong rejection signal.
Conclusion
Silver has once again like Gold reached historic levels. The risk/reward profile favours caution here on. History shows that vertical rallies into this level tend to end poorly for late longs. Unless silver breaks and holds above $50, the probability of a deep correction remains high.
Is it possible price action continues higher? Sure.
Is it probable? No.
Ww

Pullback to 47 range then up in my opinionThis sell off is a perfect chance to add to your silver physical and miners...I think the pb will hit be to around $47 where it should find support. It could to down to the $44-$45 range but I think that would be the max for this pull back...good luck to all.
Silver (XAG/USD) Outlook: Bearish Momentum Dominates Amid CorrecSilver (XAG/USD) Outlook: Bearish Momentum Dominates Amid Correction
Silver prices have experienced a sharp decline today, dropping over 4.8% to hover around $49.88 after opening near $52.40. This pullback follows a recent surge that pushed the metal to all-time highs above $54 last week, driven by safe-haven demand and dovish Federal Reserve signals. However, profit-taking and reduced geopolitical tensions appear to be spurring the current reversal, with technical indicators pointing to further downside potential in the short term.
Key factors influencing today's movement include:
- **Technical Breakdown**: The price has broken below a short-term ascending channel and key support at $50, signaling a shift from the prior bullish trend. Resistance now sits at $50.25–$51.50, while immediate support levels are at $49.20, with deeper targets around $47.50–$48 if selling pressure persists. A close below $49.80 could accelerate declines toward $45.50–$46 in the coming sessions. Overbought conditions from the rapid rally—evident in indicators like RSI dipping below 50 and a bearish MACD crossover—support this corrective phase.
- **Market Sentiment**: Real-time trader discussions highlight expectations of a multi-week correction after the historic bull run, with some eyeing a retest of $45 before any resumption of upside. Broader risk-off flows, including softer equity markets and a strengthening USD, are adding headwinds, though upcoming US economic data like the Leading Index could provide minor relief if it surprises positively.
- **Fundamental Context**: While long-term drivers like industrial demand (e.g., in solar and electronics) and inflation hedges remain intact, near-term forecasts suggest easing from peaks. Analyst views lean bearish for the session, with overall ratings classifying the pair as a "Strong Sell" based on moving averages and oscillators.
For the remainder of October 21, 2025, the direction appears downward, with potential for continued selling unless a rebound above $50 materializes by close. Traders should monitor for volatility around support zones, as a failure to hold could extend losses, while a false breakdown might trigger a quick recovery to $51–$52.

Will XAGUSD Retrace further?The recent pullback from recent highs in silver is a potential beginning of a retracement into lower trendlines where it expanded from. I will watch from here and position for the buys that will be more parabolic than $54

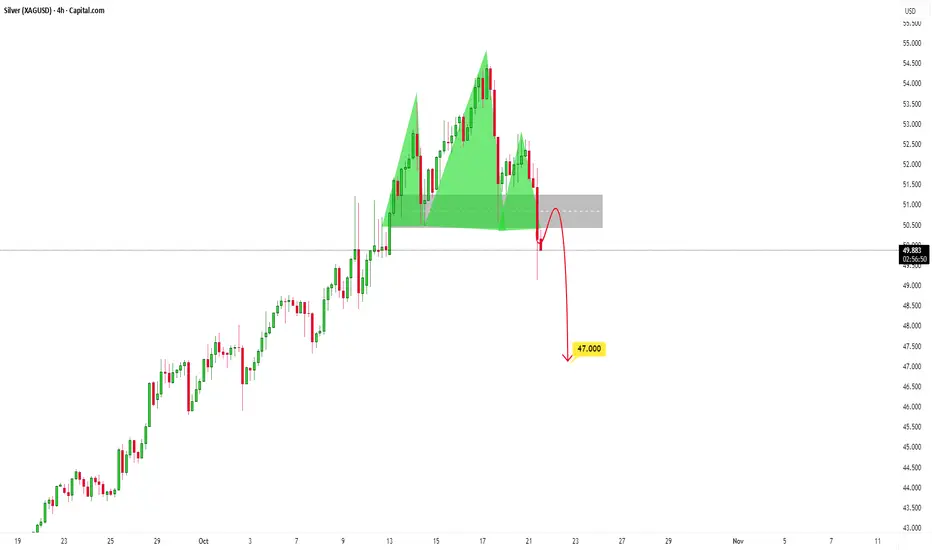
Silver Forms Classic Head & Shoulders Pattern: Wait for retestPrice was in a strong uptrend, with buyers clearly dominating. Each push higher showed strong momentum, but bullish strength started to fade.
The first pullback formed the left shoulder, showing early signs of hesitation. Buyers tried to regain control, pushing price to a new high, "the head", but that move lacked follow-through. This is a big clue.
When price pulled back again and formed a lower high, the right shoulder, sellers stepped in more aggressively. This was the first real sign that the trend might be shifting.
Once the neckline broke, it confirmed that sellers had taken control. A retest of the neckline could now serve as a perfect short entry point, anticipating a move toward around 47.000.
XAG/USD – SELL Entry (H1- Wedge Breakout Pattern)The XAG/USD Pair, Price has been trading within a Wedge Pattern on the H1 chart, forming consistent higher highs and higher lows. Price action is now testing the upper boundary of the Pattern, signalling a possible breakout. OANDA:XAGUSD
✅Market Context:
1️⃣Strong Upward Structure Inside the Pattern.
2️⃣Buyers are showing strength near Resistance.
3️⃣Breakout above the Trendline indicates Momentum continuation toward higher zones.
✅Trade Plan:
Entry: Buy after Confirmed Breakout above the Resistance (H1 candle close above trendline or retest of the breakout).
💰Take Profit (TP): At the Key Zone – a Major Resistance area identified ahead.
🛑Stop Loss (SL): Below the Pattern Structure.
✅Psychological Discipline :
1️⃣Stick to plan – No Revenge Trades.
2️⃣Accept losing trades as Part of the Strategy.
3️⃣Risk only 1–2% of your account balance per trade.
💬 Support the community: If you found this useful, drop a 👍 like and share your thoughts in the comments!
⚠️ Disclaimer: This analysis is for educational purposes only and does not constitute financial advice. Forex trading involves high risk. Trade only with capital you can afford to lose and always do your own research.

silver usdHI GUYS,
we are in London session scalp buys to retest structure, then sells continuation sells soon to take profit as illustrated.
NOTE STRUCTURE HAS NOT CHANGED WE ARE STILL IN SELLS AS WE FORM THE HS PRICE PATTERN FOR BUYS SOMETIME THIS WEEK

SILVER - Further Movement Up Idea for another surge up in silvers price to the top of this channel
I am using a bars pattern that shows similar price patterns to the current price action
Stretching this pattern out it can be used to plot a move upwards.
See if the moves are similar or not.
Weekly timeframe

SILVER BULLS WILL DOMINATE THE MARKET|LONG
SILVER SIGNAL
Trade Direction: long
Entry Level: 4,960.5
Target Level: 5,379.0
Stop Loss: 4,680.9
RISK PROFILE
Risk level: medium
Suggested risk: 1%
Timeframe: 9h
Disclosure: I am part of Trade Nation's Influencer program and receive a monthly fee for using their TradingView charts in my analysis.
✅LIKE AND COMMENT MY IDEAS✅

Silver (XAGUSD) Setup — VWAP & Volume Profile Trade PlanXAGUSD Silver is in a strong bullish trend on the higher timeframes, but we’ve seen an aggressive short-term reversal 🔁. I’m using VWAP and Volume Profile to help plan my trade and identify value/support areas 📊.
If price remains above VWAP and shows support from the volume profile, I’ll look for a long opportunity — otherwise I’ll stay flat and wait for confirmation 🚦. Everything’s explained clearly in the video.
⚠️ Disclaimer: This is for educational purposes only and not financial advice.

Bullish continuationSilver will likely retest the All-time high, with an intent to extend its growth. This growth after price action settled above the 50.6 barrier, which acted as a support. As long as price action is above this barrier 50.6 zone, potential targets would be 52.9, 53.4, and 54.5. However, if price action fails to reach those high areas and simultaneously falls towards the 50.6, a bearish insight will emerge.

SILVER USDHI GUYS,
We are around area of interest , 2nd sells will begin Tokyo session.
NOTE. THE STRUCTURE HAS NOT CHANGED , however my trend line in the parallel channel is not accurate till we grab Tokyo sells, then adjustments will be made. keep holding

DEAD RECKONING: Gold, Silver, and Bitcoin vs. the Empire of DebtWhy This Time, Silver's Surge Might Signal a Systemic Shift—Not Another 1980 or 2011 Collapse
The world built on credit is sailing blind through heavy seas. Gold leads, silver amplifies, and Bitcoin holds the digital line as the Empire of Debt drifts toward its reckoning.
The Setup: A Colossus on the Brink
Picture the scene: a sovereign-debt Goliath staggering under $38 trillion in outstanding U.S. obligations—124 percent Debt to GDP ratio—while $600 trillion in derivatives lurk like a ready-to-blitzkrieg enemy beneath the surface.
The financial establishment, floating inside an $8 trillion post-GFC and COVID bailout bubble, ignores the real economy’s warnings. Re-industrialization is a mere concept and future hope, purchasing managers’ indexes are sliding, consumer defaults are climbing, housing is staggeringly unaffordable, and wages are dramatically lagging.
Gold, piercing $4,000 per ounce after a 62 percent 2025 surge, flashes the first distress signal. Central banks are buying more than 1,000 tons a year, and BRICS nations have piled up 6,000 tons , shifting half their trade off the dollar grid.
Silver, breaking above $50 and up 79 percent in 2025, exposes the weakening grip of paper suppression: 179 million ounces short, backwardation over $ 3, and a 265-million-ounce deficit that the derivatives complex can’t conceal.
NOTE: It will be interesting to see if the emergency cargo flights of Silver from New York to the LBMA in London will resolve the supply squeeze occurring across the pond.
Bitcoin, climbing to $126,000 and a $2.65 trillion market cap , thought recently struggling, up only 16.8% in 2025, fights beside them—half rebel, half captive—its decentralized ideals tangled in ETF custody, tech-related risk, and institutional leverage.
NOTE: Many argue that BITCOIN may have reached its 4-year cycle top with the recent print high of $126,272 . So long as any primary 4th wave bear market drop can stay above the old high at $69,000 , BITCOIN will then be poised to make new all-time-highs in the next bull phase. Caution is warranted for HODLERS if the $69,000 level is breached amid the next bear market, as that might suggest that the $126k crest marked a Super-Cycle first wave advance, and that an 80-90% decline would likely follow, bringing BTC down as far as $12,600 before the next bullish super cycle ensues.
These are not rival camps but brothers-in-arms: gold as the signal, silver as the amplifier, Bitcoin as the experiment in digital sovereignty.
Gold: The Beacon of the Sovereign-Debt Era
Gold’s ascent isn’t speculative froth—it’s a barometer of political and fiscal exhaustion.
Central-bank demand has turned relentless, with over 6,000 tons amassed in emerging-market vaults. The dollar’s share of global reserves, once dominant, is slipping below 58 percent as trade settles increasingly in local currencies or metals.
In a historic shift, the value of central banks’ gold reserves, now exceeding $4.5 trillion at $4,200 per ounce, has surpassed their U.S. Treasury holdings of approximately $3.8 trillion, marking the first such crossover since 1996.
This milestone underscores a growing preference for gold as a sanctions-proof, inflation-resistant asset amid rising geopolitical and fiscal uncertainties.
Behind the curtain, Washington’s debt mountain grows steeper, and an $8 trillion Fed balance sheet props up a system whose real wages stagnate. Gold sees through the façade.
Historically, gold rallies when confidence in sovereign debt erodes. 2025’s move feels structural, not cyclical. As technology enables tokenized gold settlement, physical bullion could soon anchor cross-border trade— $15 trillion a year moving outside the dollar’s orbit.
If that transition accelerates, gold’s total market value could multiply several times, transforming from a commodity to a monetary foundation once more.
Gold knows when governments lie; it rises on truth withheld.
Silver: The Fierce Ally
Silver’s run above $50 signifies more than nostalgia for 1980 or 2011. Industrial demand is devouring supply—solar, EVs, and India’s record imports have created a five-year deficit exceeding 265 million ounces .
Only about 100 million ounces remain deliverable on COMEX, a fraction of the market. Bullion banks sit on short positions equal to 12 percen t of global above-ground stock—an exposure large enough to spark contagion if prices keep climbing.
Backwardation above $3 per ounce and lease rates near 35-100 percent reveal a tightness the paper market can’t disguise. Supply discipline, not speculative frenzy, defines this cycle.
Following their ongoing pilots in tokenized gold, though entirely speculative, BRICS nations could extend similar efforts to silver, enabling scalable trading on blockchain platforms and restoring the metal’s monetary role alongside its yellow counterpart.
Unlike the boom-and-bust manias of the past, this move is grounded in fundamentals: dwindling supply, soaring utility, and faith migrating from financial promises to tangible reality.
Silver is gold’s conscience—smaller, scrappier, and impossible to suppress indefinitely.
BITCOIN: Brother in Arms, Bound by Chains
Bitcoin remains the digital insurgent in this triad. ETFs and state holdings—about 207,000 coins —have mainstreamed it, yet also blunted its radical edge. Transaction fees, volatility, and custodial control keep it from fulfilling the dream of instant, peer-to-peer cash.
Still, Bitcoin’s resilience commands respect. Its artificial 21-million-coin limit mirrors gold’s authentic scarcity, and its censorship resistance has made it a refuge in sanctioned economies. While institutional adoption ties it to Wall Street’s boom-bust rhythm, the core idea—money without permission—endures.
A major equity or credit unwind could knock it hard, but each cycle burns away speculation and strengthens the hands of true believers. Its role may ultimately be symbolic: proving that digital trust can exist outside the fiat web, even if imperfectly.
Gold has history, silver has utility, and Bitcoin has possibility.
The Cracks in the Real Economy
Beneath obscene market valuations lies stagnation. Small businesses close faster than they open. Household debt delinquencies rise while wage gains stagnate. Wall Street’s financialized economy levitates; Main Street’s productive one flounders.
Gold and silver prices are the seismograph warnings of such disparity and injustice. Their message: the ground beneath policy orthodoxy is giving way.
The next downturn may not mimic the inflationary shocks of the 1970s, the liquidity crunch of 2008, or the devastation of the 1930s depressionary deflation, but it will feel every bit as harsh.
Following a blow-off bubble top, a deflationary contraction could emerge—credit imploding under its own weight—forcing the Fed to choose between saving markets or saving the dollar’s credibility.
After Wall Street’s bubble mania peaks, an epic crash looms—forcing the Fed to choose: prop up markets or preserve the dollar’s fading trust. Desperate reflation efforts will likely follow, unleashing brutal stagflation with no clear ending.
Zero interest rates are unlikely to return; their side effects were too corrosive. Too strong a run toward the safe-haven dollar could shatter global balance sheets. The Fed walks a narrowing ridge.
Expect a world of oscillation—temporary rallies in the dollar and bonds, followed by renewed bids for tangible assets.
In such turbulence, metals may take up some safe-haven slack and regain their ancient role as monetary anchors, not investments. Bitcoin will need to prove itself amid such chaos.
America’s Fortress—But Not Forever
The United States is not Venezuela or Argentina.
Its reserve-currency status, military reach, and deep capital markets insulate it from runaway inflation. The dollar’s 58 percent reserve share and $3.5 trillion in foreign Treasury holdings remain formidable bulwarks.
But even fortresses erode.
BRICS nations now settle roughly half their trade outside the dollar. Their 6,000-ton gold cache is both insurance and a declaration.
If tokenized trade systems gain traction, the dollar’s unique privilege—to export inflation and import goods—will weaken.
America will likely manage a softer dollar to stay competitive, avoiding extremes that could trigger global chaos. Despite this, cracks are evident. Tariffs, debts, and deficits gnaw at the foundation—each with second, third, and fourth-order effects.
The empire won’t collapse in a day, but the margin of invincibility is gone.
The Establishment’s Countermoves
The narrow class of financial elites won’t surrender quietly. Expect renewed quantitative easing , aggressive swap lines , and tariffs or sanctions to defend dollar dominance and hegemony.
As digital-asset rules and surveillance intensify, governments adopt digital IDs, CBDCs, and tokenized gold —a desperate bid and admission that the fiat system is dying.
Such measures may stabilize the surface but could deepen the underlying rift between protected financial power and genuine merit-based wealth. Each intervention buys time while eroding trust—a classic symptom of late-cycle finance.
When manipulation becomes policy, markets stop believing in miracles.
The United Front
Gold, silver, and Bitcoin tell variations of the same story: distrust in promises backed only by debt.
Each represents a different path toward autonomy—physical, industrial, or digital—but all push against the same current of engineered dependence.
Gold leads as the monetary lodestar.
Silver echoes its signal through scarcity and utility.
Bitcoin experiments at the frontier, still volatile but alive with intent.
Together they form a loose alliance of realists—investors, savers, and skeptics—who sense that something fundamental has shifted.
Following the late 2020s and early 2030s—the expected fallout of the Fourth Turning—the world may witness a new architecture: metals backing trade, blockchains verifying trust, and fiat reduced to what it was always meant to be—credit, not creed.
Watch unemployment, the housing and credit markets, silver deliveries, and BRICS’ next summit. Those are potential fuses in this quiet pre-revolution stage of seismic transition.
Closing Reflection
We navigate by dead reckoning now—plotting our course from known hazards rather than clear horizons.
The Empire of Debt still commands vast power, but every chart, every ounce, and every block on the chain suggests the same direction: away from illusion and back toward something real.
Gold leads.
Silver shines.
Bitcoin fights.
And somewhere beyond the coming revolution, a sounder form of money waits to be rediscovered.

Silver Surge: Supply Constraints and Global Demand Impact PricesMarket Trends and Price Surge
Silver prices CAPITALCOM:SILVER have experienced a remarkable upswing, climbing over 74% on the COMEX since January, surpassing gold’s gains for the year. In the past 30 days alone, the price has jumped by more than 21%. We can see heightened market activity. This rally is in line with gold's rising price, but it has gained speed due to specific supply and demand factors.
Supply Shortages and Liquidity Challenges
A critical factor behind the price surge is a pronounced shortage of silver, particularly evident in London. The scarcity has triggered a short squeeze, where investors betting on price declines face losses as prices rise, forcing them to cover positions. A short position involves selling a silver contract with a commitment to deliver at a future date; if prices climb instead, losses mount, and delivery obligations intensify without available supply. London’s benchmark prices have spiked, recently showing a $3 premium over New York futures, an unusual gap prompting some traders to ship silver across the Atlantic, a move typically reserved for gold due to silver’s bulk and transport costs.
COMEX warehouse stocks, hovering around 500 million ounces in late summer, have shown no significant buildup despite minor fluctuations, suggesting much of the metal is tagged as “eligible” but not readily available. London vault inventories, per LBMA data , continue to decline monthly, underscoring a persistent supply deficit. Liquidity crunch, amplified by elevated lease rates for borrowing silver, signals ongoing market strain.
Industrial and Indian Demand Pressures
The supply crunch is worsened by robust demand, especially from industrial sectors like electronics, batteries, and solar panels, where silver is indispensable. India, the largest consumer, has intensified this pressure. Since the country meets 80% of its silver needs through imports, it doubled its imports this year ahead of Diwali, which is the main period for purchasing silverware, jewelry, coins, and industrial materials.
Geopolitical and Economic Influences
The rally is also supported by expectations of U.S. Federal Reserve rate cuts and escalating geopolitical tensions. China’s export restrictions, introduced in April for seven rare earth elements and expanded to 13 with Announcement No. 61 , include controls on magnets and processing technologies vital for defense and advanced chips. Access-restricting measures have heightened concerns about supply disruptions, prompting the US to bolster domestic production.
Investment Considerations
Much of silver’s trading occurs via derivatives rather than physical metal, a pattern reminiscent of supply chain disruptions during the pandemic, which halted production due to part shortages. Reliance on derivatives, coupled with limited physical stocks, underpins the current price momentum, outpacing even gold. Companies in tech and manufacturing often use derivatives to mitigate silver shortage risks, though the market’s small size amplifies volatility.
Gold offers a stable long-term entry point, while silver requires timing due to its volatility. Technical indicators, such as the daily MACD, show strong upward momentum for silver, akin to gold’s bull market, but it is entering overbought territory, signaling potential for sharp intra-day swings. So, silver at this moment a high-risk, high-reward option, unsuitable for cautious investors.

SILVER (XAG/USD): Trend-Following Signal📈SILVER experienced a notable pullback on Friday, with the price subsequently retracing to a critical intraday support level.
Analyzing the hourly chart, I spotted the formation of a cup and handle pattern, followed by a confirmed breakout above its neckline.
Based on this analysis, there is a strong likelihood of further upward movement, potentially reaching a target of 53.31.

New price ceiling in silverThe new price ceiling in silver is $54 and we can expect the price to continue this upward trend.

Silver's Road Map to $100.Silver's Road Map to $100.
All bets are off if that lower rising support line fails.

Silver corrective pullback supported at 5130The Silver remains in a bullish trend, with recent price action showing signs of a corrective pullback within the broader uptrend.
Support Zone: 5130 – a key level from previous consolidation. Price is currently testing or approaching this level.
A bullish rebound from 5130 would confirm ongoing upside momentum, with potential targets at:
5360 – initial resistance
5445 – psychological and structural level
5500 – extended resistance on the longer-term chart
Bearish Scenario:
A confirmed break and daily close below 5130 would weaken the bullish outlook and suggest deeper downside risk toward:
5065 – minor support
4980 – stronger support and potential demand zone
Outlook:
Bullish bias remains intact while the silver holds above 5130. A sustained break below this level could shift momentum to the downside in the short term.
This communication is for informational purposes only and should not be viewed as any form of recommendation as to a particular course of action or as investment advice. It is not intended as an offer or solicitation for the purchase or sale of any financial instrument or as an official confirmation of any transaction. Opinions, estimates and assumptions expressed herein are made as of the date of this communication and are subject to change without notice. This communication has been prepared based upon information, including market prices, data and other information, believed to be reliable; however, Trade Nation does not warrant its completeness or accuracy. All market prices and market data contained in or attached to this communication are indicative and subject to change without notice.
