Silver Powerful BreakoutOANDA:XAGUSD : Cup with Handle pattern and now powerful breakout, As long as hold above $54.70, every chance that it will touch $59.90 & $62.70 in upcoming days, Stop Loss $52.70.
Trade ideas

Trading Setup – Silver (XAGUSD)🔍 Technical Overview:
Silver has completed a classic bull flag formation on the 4H chart, following a strong impulsive move higher (flag pole). Price has now broken out above the channel resistance, confirming continuation.
MACD has just printed a fresh bullish cross, signaling renewed upside momentum.
Price is holding above the key $60.00 breakout level, which now acts as short-term support.
The structure favors a continuation move to the upside as long as price stays above the breakout zone.
Fundamental Momentum:
Silver remains supported by strong industrial demand, especially from the solar and electronics sectors.
Expectations for softer monetary policy ahead continue to support precious metals.
Ongoing geopolitical uncertainty and USD sensitivity keep silver attractive as a hedge, reinforcing bullish sentiment.
Trade Idea – Swing Long Setup
Entry Zone: $60.10 – $60.40
Stop Loss: $57.40 (below the flag structure and invalidation level)
Take Profit Levels:
TP1: $62.37 → First resistance (measured move from flag).
TP2: $64.57 → Next key supply zone.
TP3: $67.50 → Full bullish extension target.
Risk Note:
Silver is fast-moving and volatile. Partial profits are recommended at TP1, with stop moved to breakeven to protect capital. A clean hold above $60 keeps the bullish structure valid.

Silver potential drop incoming?Silver came to within whiskers of reaching $59, before easing lower in the last couple of days, and it is now disapplying a potential H&S pattern on the hourly. If the pattern's neckline at 56.45-56.50 area breaks, then we could potentially see a quick drop to the next support which comes in between $53.90 to $54.48. Within this zone, $54.22 is an interesting H1 level to watch for a potential bounce should we get to it.
By Fawad Razaqzada, market analyst with FOREX.com


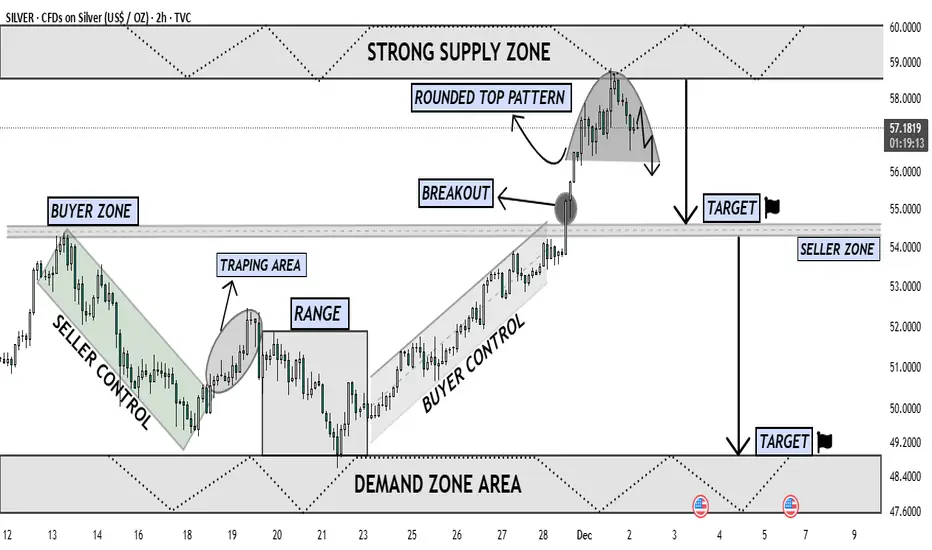
Silver Forming Major Top Near Supply Downside Retracement LikelyThe chart shows Silver reaching a major Strong Supply Zone near the 58–60 level, where price has reacted multiple times in the past. After a strong impulsive rally driven by Buyer Control, the market broke above the previous Buyer Zone, confirming bullish strength. However, once price entered the upper supply region, momentum started to fade, forming a clear Rounded Top Pattern — a classic distribution structure indicating exhaustion of buyers.
Following the breakout retest, buyers failed to continue upward, and sellers stepped in aggressively from the supply zone. The chart now shows a shift from buyer dominance to seller pressure, with price beginning to curve downward inside the rounded top. This shape reflects decreasing highs, weakening demand, and early reversal signals.
The projected move suggests that once the neckline of the rounded top breaks with strong bearish candle confirmation, price is likely to fall toward the first Target Zone around 54, which aligns with the Seller Zone and previous breakout structure. If bearish continuation remains strong, the next logical target lies in the Demand Zone Area between 48–49, where liquidity is expected to support a potential reversal or consolidation.
Overall, this chart indicates a high-probability corrective phase, with sellers preparing to reclaim control as the market rejects the supply zone and transitions into a deeper pullback phase. Buyers must show strong defense at the mid-support; otherwise, Silver could decline further toward the lower demand region.
Gold or Silver?Right now: SILVER!
I know, I know! Crazy schitt! Don't look at me!
The chart’s telling the story — Silver hasn’t even really started its move yet. Don’t blame me, I’m just reading the data.
Silver is up 87% year-over-year and outperforming gold by 11%, which is still on the low end historically.
That suggests Silver either has room to run from here, or it’s simply the safer relative play versus gold on a risk-adjusted basis.
If you’ve got space in your portfolio, it’s a reasonable addition.
If it hits nose-bleed levels, we reassess.
THANK YOU for getting me to 5,000 followers! 🙏🔥
Let’s keep climbing.
If you enjoy the work:
👉 Drop a solid comment
Let’s push it to 6,000 and keep building a community grounded in truth, not hype.

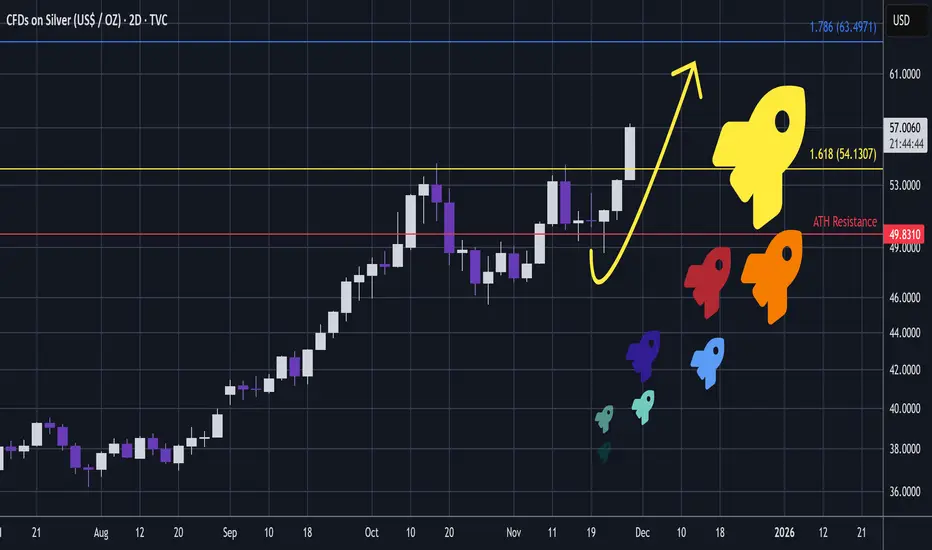
SILVER - Moon Pump Could Be UnderWaySILVER has printed very positive candles since re-testing prior ATH resistance (turning support) last week.
Now pushing up, there is no more structure and therefore no more liquidity traps.
This is the area where the "roof can come off" and if Silver pushes up much further then it will likely be heading into the rocket ship ultra impulsive phase - replicating its historical price action.
Its a positive open to the week and if this continues much further then it is odds on to hit some high notes.
FWIW, the previous wave up topped tidily in the Phi band (on chart) - and pushing on up like this already signals a potential next wave up.
This analysis is shared for educational purposes only and does not constitute financial advice. Please conduct your own research before making any trading decisions.
'Cup and Handle' playing outSetup since 1980,
we are now in the proofing ground,
classic cup and handle as we watch it play out

XAGUSD 3-Month to 1-Year PredictionThe XAG to USD exchange rate is forecasted to increase by 214.86% in the next three years, rising from the current rate of $ 57.90 to $ 182.29. Currently, the sentiment in the XAG/USD market is estimated to be bullish.
See and follow the lines in the chart.

XAGUSD H1 | Bearish Reaction Off Pullback ResistanceMomentum: Bearish
Price is currently below the ichimoku cloud.
Sell entry: 57.933
- Strong pullback resistance
- 61.8% Fib retracement
- 100% Fib projection
- Fair Value Gap
Stop Loss: 58.903
- Swing high resistance
Take Profit: 56.729
- Swing low support
High Risk Investment Warning
Stratos Markets Limited (tradu.com/uk ), Stratos Europe Ltd (tradu.com/eu ):
CFDs are complex instruments and come with a high risk of losing money rapidly due to leverage. 70% of retail investor accounts lose money when trading CFDs with this provider. You should consider whether you understand how CFDs work and whether you can afford to take the high risk of losing your money.
Stratos Global LLC (tradu.com/en ): Losses can exceed deposits.
Please be advised that the information presented on TradingView is provided to Tradu (‘Company’, ‘we’) by a third-party provider (‘TFA Global Pte Ltd’). Please be reminded that you are solely responsible for the trading decisions on your account. Any information and/or content is intended entirely for research, educational and informational purposes only and does not constitute investment or consultation advice or investment strategy. The information is not tailored to the investment needs of any specific person and therefore does not involve a consideration of any of the investment objectives, financial situation or needs of any viewer that may receive it. Past performance is not a reliable indicator of future results. Actual results may differ materially from those anticipated in forward-looking or past performance statements. We assume no liability as to the accuracy or completeness of any of the information and/or content provided herein and the Company cannot be held responsible for any omission, mistake nor for any loss or damage including without limitation to any loss of profit which may arise from reliance on any information supplied by TFA Global Pte Ltd.

XAGUSD Short Setup — Rejection at Key Supply ZoneSilver (XAGUSD) has tapped into a higher-timeframe supply zone around the $58.50 – $58.80 area and showed clear signs of exhaustion. After sweeping the highs, price failed to continue upward and shifted into short-term bearish structure on the 15-minute chart.
📌 Entry: around $57.90 – $58.00
📌 Stop-loss: above the liquidity sweep / supply zone (~$58.70)
📌 Take-profit: toward $56.40 – $56.60 (previous demand + imbalance fill)
➕ Confluences
Liquidity grab above the previous high
Multiple rejection candles at supply
Loss of bullish momentum and break of structure (M15)
High risk-reward ratio on continuation to downside
⚠️ What invalidates the setup?
A decisive move above $58.70 with strong bullish volume would invalidate the short bias and open room for continuation toward $59.50+.

SILVER Free Signal! Buy!
Hello,Traders!
SILVER shows price reacting inside a fresh demand block after a liquidity sweep, signaling potential bullish displacement as long as the demand floor holds.
--------------------
Stop Loss: 5,643$
Take Profit: 5,780$
Entry: 5,700$
Time Frame: 1H
--------------------
Buy!
Comment and subscribe to help us grow!
Check out other forecasts below too!
Disclosure: I am part of Trade Nation's Influencer program and receive a monthly fee for using their TradingView charts in my analysis.


XAGUSD 4h
Silver is in consolidation zone, we would be looking to see how its going to break the side with confirmation.
Blue line and the Purple lines are the resistance lines.
We will be seeing higher prices based on weekly and monthly candle analysis.
Stay Tuned for our next update.

Silver Outlook Turning Stronger — Bullish Setup in Play!🥈 XAG/USD SILVER SURGE | Bullish Swing Trade Setup 📈
🎯 TRADE SUMMARY
Asset: XAG/USD (Silver vs US Dollar) | Metals Market 💰
Strategy: Swing Trade | Bias: BULLISH ⬆️
Risk/Reward: Professional Grade | Timeframe: Multi-Day Setup
📍 ENTRY STRATEGY - LAYERED APPROACH 🔄
Recommended Entry Zones (Multiple Buy Limit Orders)
1st Entry: $49.000 - Initial Position 20% 📌
2nd Entry: $49.500 - Add Position 30% 📌
3rd Entry: $50.000 - Final Entry 50% 📌
Strategy: Use limit orders at each level for better execution. Scale in progressively to optimize average entry price. This approach reduces risk and increases position efficiency.
🛑 STOP LOSS
Recommended SL Level: $48.000
⚠️ RISK DISCLAIMER: This is a suggested level based on technical structure. You must adjust your stop loss according to YOUR personal risk management, account size, and trading strategy. There is NO one-size-fits-all SL - ownership of risk is yours alone.
🎪 PROFIT TARGETS 🚀
Primary Target: $54.000
Confluence Factors:
Strong Resistance Zone Identified ✓
Overbought Condition Setup ✓
Potential Trap/Correction Reversal ✓
Bullish Breakout Extension ✓
⚠️ TP DISCLAIMER: This target is based on technical analysis. You control your profit-taking strategy. Consider taking partial profits at key resistance levels. Lock in gains at YOUR discretion - this is YOUR trading decision.
🔗 CORRELATED PAIRS TO MONITOR 📊
1️⃣ DXY (US Dollar Index) - INVERSE CORRELATION
Why: Silver prices move inversely to dollar strength
Watch For: If DXY weakens 📉, XAG typically strengthens 📈
Key Level: Monitor 103.50-105.00 zone
2️⃣ EURUSD - INDIRECT CORRELATION
Why: Euro strength correlates with silver strength (risk-on sentiment)
Watch For: EURUSD above 1.1000 supports silver bullish bias
Key Level: 1.0950-1.1050 range critical
3️⃣ GOLD/USD (XAU/USD) - POSITIVE CORRELATION
Why: Precious metals move together in risk-off/on scenarios
Watch For: Gold breaks above 2,700 = Silver momentum likely follows
Key Level: XAU/USD 2,650-2,750 zone
4️⃣ SPX500 (S&P 500) - RISK SENTIMENT
Why: Equities strength supports risk-on sentiment, bullish for silver
Watch For: SPX breaks 6,000+ supports precious metals outflow
Key Level: 5,850-6,050 pivot zone
5️⃣ COPPER/USD (HG) - INDUSTRIAL DEMAND
Why: Copper demand correlates with economic growth = Silver bullish signal
Watch For: HG above 4.30 = Risk-on sentiment confirmed
Key Level: 4.20-4.35 critical range
📈 KEY TECHNICAL POINTS
✅ Bullish Structure: Lower highs/lows pattern breaking
✅ Momentum: Building strength in watch zone
✅ Risk/Reward: Favorable 1:2+ setup
✅ Entry Precision: Multiple confirmation levels
✅ Exit Clarity: Clear profit target defined
⚡ QUICK TRADE CHECKLIST
Confirm DXY weakness before entry
Check Gold (XAU/USD) above 2,650
Verify EURUSD above 1.0950
Set all 3 limit orders at entry zones
Place SL at 48.000 (adjusted to YOUR risk)
Divide position into TP tranches
Monitor correlated pairs daily
🎓 TRADER'S NOTES
This analysis reflects current technical structure as of publication. Market conditions evolve. Adjust strategy based on:
Market news/data releases
Central bank decisions
Geopolitical events
Real-time price action
Remember: Past performance ≠ Future results. Trade with discipline. Manage risk first, profits follow.
💡 LIKE if helpful | 📌 SAVE for reference | ✅ FOLLOW for updates
Technical Analysis | Swing Trading | Metals Market | XAG/USD Strategy

Silver is in the Bearish directionHello Traders
In This Chart XAGUSD HOURLY Forex Forecast By FOREX PLANET
today XAGUSD analysis 👆
🟢This Chart includes_ (XAGUSD market update)
🟢What is The Next Opportunity on XAGUSD Market
🟢how to Enter to the Valid Entry With Assurance Profit
This CHART is For Trader's that Want to Improve Their Technical Analysis Skills and Their Trading By Understanding How To Analyze The Market Using Multiple Timeframes and Understanding The Bigger Picture on the Charts

Silver Might Be Accumulating Strength for the Next Leg UpAfter the massive 24% run from the late-November dip, silver is now consolidating between 56.40 and 59. The bullish rally's 41-degree-sloped trend has now broken and is currently being retested. This is not necessarily a bearish signal given the very steep slope and the 24% surge, but if silver manages to break out of the retest and clear the 59 resistance together, there is a chance for another leg higher.
The breakout above 50 was massive because that level has acted as resistance since the 1980s, and every time silver approached it in the past, it triggered months-long selloffs. Given that this is a historically key moment combined with favorable fundamentals, silver still has potential for more upside. However, a retreat below 56.40 could alter the short- to medium-term trajectory.

The AI Boom's Unsung HeroThe rise of artificial intelligence isn’t just shaking up tech companies it’s quietly transforming the global silver market in a big way. As major players like NVIDIA, Google and others ramp up their AI infrastructure silver is becoming more critical than ever. Why? Because silver, thanks to its unmatched electrical conductivity, plays a key role in powering the hardware behind AI.
Silver is the most conductive metal on Earth. That makes it perfect for high-performance computing something AI needs a lot of. It’s especially important in data centers and advanced semiconductors, where both electrical and thermal performance are mission-critical.
What’s really interesting is that AI servers tend to use two to three times more silver than traditional data center servers. That’s because AI workloads are more power-hungry, generate more heat and require more complex cooling and electrical systems. Simply put, more AI means more silver.
If there’s one company at the heart of this trend it’s NVIDIA. Analysts at Morgan Stanley expect NVIDIA to consume a staggering 77% of all silicon wafers used for AI accelerators in 2025 up from 51% in 2024. That adds up to around 535,000 300-mm wafers a year each of which contains silver in key components.
All of this AI growth is showing up in the numbers. Industrial silver demand hit an all-time high of 680.5 million ounces in 2024. The electronics industry alone uses around 250 million ounces per year and AI is now the fastest-growing part of that.
Despite all this demand, silver supply just isn’t keeping up. The market’s been in deficit for four straight years, with a total shortfall of 678 million ounces between 2021 and 2024. That’s roughly ten months of global mine output gone missing from the balance sheet.
It’s no surprise, then, that silver prices have been climbing fast. As of July 2025 silver’s up nearly 30% for the year. Looking further ahead I see room for silver to keep climbing:
In the short term (2025): $36–$42 per ounce seems realistic
By 2026: Potential for $50+ as more AI growth stays strong
AI isn’t just changing how we work, communicate, or compute—it’s literally reshaping the commodities that make this technology possible. Silver, once thought of mainly in the context of jewelry or coins, is now a backbone material for the AI revolution.

Silver Poised for Breakout to the New High.Silver is consolidating below a descending trendline but holding above the 20 Ma. Buyers are defending higher lows with strong bullish pressure. Rising momentum signals a breakout is near. A close above the trendline could trigger a significant move to new highs.

XAGUSD: Bullish Wave 5 Setting a Path Toward 56.000?Hey Realistic Traders!
"Silver Riding Gold’s Momentum, New ATH in the horizon?"
Let’s dive into the technical analysis to answer the question and see what the chart is really telling us.
Technical Analysis
On the daily chart, OANDA:XAGUSD has once again rebounded around the EMA200, with repeated bounces reinforcing the strength of its broader bullish trend. During Wave 4, Silver consolidated within a falling wedge pattern, a corrective formation that typically appears as downside momentum weakens within a larger uptrend. A breakout from this pattern signals renewed bullish pressure and often marks the beginning of Wave 5 in Elliott Wave theory.
Following the breakout, price action supports the case for a developing impulsive Wave 5. The bullish Marubozu candlestick indicates stronger buying interest, while the MACD golden cross adds confirmation to the bullish bias. Together, these signals strengthen the view that momentum is shifting back in favor of the bulls.
Based on Fibonacci projections, Wave 5 may extend toward the 1.0 Fibonacci ratio, aligning with the second upside target near 56.000. Before reaching that level, price may encounter the historical resistance zone around the first target at 54.082, where a temporary pullback could occur.
This bullish wave count remains valid as long as price stays above 49.216. A move below this level would invalidate the potential formation of Wave 5 and shift the outlook back to neutral.
Support the channel by engaging with the content, using the rocket button, and sharing your opinions in the comments below.
Disclaimer: "Please note that this analysis is solely for educational purposes and should not be considered a recommendation to take a long or short position on Silver

While Gold Stalls, Silver Eyes The 60-Record Silver has broken above a 45-year resistance, turning the 54-barrier into a potential support level moving forward. If silver continues to hold above this multi-decade structure, a new era for the metal could unfold in alignment with triple-digit long-term forecasts supported by the expansion of technology and green-energy industries — including solar panels, electric batteries, and industrial tech use cases.
From a weekly perspective, silver’s price action is aligned with the upper bound of a duplicated up-trending channel respected between August 2022 and September 2025. The 60 zone remains a key psychological resistance level — and a potential retracement trigger. Beyond that, Fibonacci extension measurements from the July 2025 low and the October 2025 high-and-low sequence outline the next upside zones near 64 and 69.
On the downside, if a reversal emerges below the daily low of 56.20 and the previous 2025 record at 54.30, retracement risks may extend toward the mid-zone of the new channel between 51.80 and 50.80. A confirmed hold below this area could pave the way for deeper declines toward 45 and 43.90 — aligning with a historical resistance zone connecting consecutive higher highs between January 2023 and October 2024, before silver possibly resumes its bullish course.
Written by Razan Hilal, CMT

SILVER Will Go Lower From Resistance! Sell!
Please, check our technical outlook for SILVER.
Time Frame: 4h
Current Trend: Bearish
Sentiment: Overbought (based on 7-period RSI)
Forecast: Bearish
The market is testing a major horizontal structure 5,852.3.
Taking into consideration the structure & trend analysis, I believe that the market will reach 5,592.7 level soon.
P.S
Overbought describes a period of time where there has been a significant and consistent upward move in price over a period of time without much pullback.
Like and subscribe and comment my ideas if you enjoy them!

SILVER USDHI GUYS
I have stopped trading silver until it rallies all the way up to area of interest as illustrated.
NOTE . this was due to a false price pattern i posted last week.
i have to know every move before it happens once an error occurs then i make correction or wait for a few months to edit the trading future script on 6 month 12 month and 24 months
