Silver is not done yetthis one seems easy on the eye, i dont really trade silver but target seems obvious
Trade ideas

Silver Might Be Accumulating Strength for the Next Leg UpAfter the massive 24% run from the late-November dip, silver is now consolidating between 56.40 and 59. The bullish rally's 41-degree-sloped trend has now broken and is currently being retested. This is not necessarily a bearish signal given the very steep slope and the 24% surge, but if silver manages to break out of the retest and clear the 59 resistance together, there is a chance for another leg higher.
The breakout above 50 was massive because that level has acted as resistance since the 1980s, and every time silver approached it in the past, it triggered months-long selloffs. Given that this is a historically key moment combined with favorable fundamentals, silver still has potential for more upside. However, a retreat below 56.40 could alter the short- to medium-term trajectory.

Just a chart showing the price targets for silverJust a price chart tracking price targets for silver. After it's all over, it's interesting to see who was close, and what their methods were.

SilverDivergence, Double top then Triple Top, Rising wedge, Resistance played its role now, trend line is at breakup point. I guess its a retracement of silver till Fib 0.382

Silver’s 220% Rally: Still Worth Buying Now?Many have recommended investing in silver in recent years. I wasn’t a strong believer, but seeing its 220% growth — even outperforming gold — is impressive. For new investors, silver carries high risk at current levels. In my view, $50 would be a much more attractive entry price

Silver – Can the Break to Record Highs Be Maintained?Silver’s impressive upside run so far this week, which has seen it trade from a low of 56.165 on Monday to register a new record high at 58.96 yesterday, seems to be taking a pause in early trading on Thursday morning, with the price currently trading down around 1.8% at 57.44 at time of writing (0700 GMT).
With liquidity in the Silver market nowhere near as deep as in its bigger parent Gold, these types of exaggerated moves can happen more frequently, especially when trading at new extremes such as the record high that was reached a mere 24 hours ago. Where Silver moves next into the weekend may be determined by a combination of factors, such as positioning, performance of the US dollar and technical factors.
From a positioning standpoint, the debasement trade which has been underpinning much of Silver’s rally over the last 3-6 months still remains in place but can at times be subject to pullbacks as the trade can get crowded and this may be part of the reason for the drop this morning. There could be potential for further profit taking into Friday’s close, especially with the pivotal Federal Reserve interest rate decision now less 7 days away (December 10th).
From the US dollar point of view, as mentioned above, with the Fed rate decision now around the corner, traders may be more sensitive to the release of any available US labour market data. Today’s scheduled release of the Challenger Job Cuts at 1230 GMT and Weekly Jobless Claims at 1330 GMT could lead to further US dollar volatility, which may impact Silver prices. As a general rule a higher dollar makes Silver more expensive for foreign investors and vice versa.
Finally, interlinked with these two drivers are the technicals. Whether key support or resistance levels hold or a broken on a closing basis could lead to bigger directional moves into the weekend or early next week. So being apprised of these levels in advance can be prudent from a risk management approach.
Technical Update: Can New All-Time Highs Maintain The Push Higher?
Silver has enjoyed a positive late‑November to early‑December period, advancing more than 21% from the November 21st low of 48.62 to Wednesday’s 58.96 high. This move has produced new all‑time highs, with fresh upside acceleration following the closing break above the previous 54.45 October 17th record high.
While it might be argued that this type of price activity remains constructive with the potential for further gains, some traders may view the latest upside moves as becoming over‑extended, raising the risk of future price weakness.
In this environment, staying aware of relevant support and resistance levels may prove valuable in gauging Silver’s next directional themes.
Possible Resistance Levels: .
New all‑time highs place price activity into uncharted territory, making it difficult to establish valid resistance levels. In such cases, Fibonacci extensions can provide valuable guidance, highlighting potential areas where fresh selling pressure may emerge once more.
For Silver, Fibonacci extension calculations based on the last significant correction seen between October 17th and October 28th suggest that current price strength may be approaching a potential resistance at 59.79, which is the 61.8% extension level.
A closing break above 59.79 might now be required to open scope for a push to higher levels like the 100% extension level which sits at 63.15.
Possible Support Levels:
It is often difficult to determine with certainty when upside conditions have become over‑extended and of course this alone doesn’t guarantee price weakness. As such, closing breaks below support may be required to trigger a corrective phase in price. In the case of Silver, traders may view Monday’s session low of 56.16 as the first support.
Closing breaks below the 56.16 level, if seen, could reinforce the possibility of over‑extended upside conditions leading to continued price weakness. Such moves could open the way for tests of 54.95, which is the 38.2% Fibonacci retracement, and possibly even extend toward 53.75, the deeper 50% retracement level.
The material provided here has not been prepared accordance with legal requirements designed to promote the independence of investment research and as such is considered to be a marketing communication. Whilst it is not subject to any prohibition on dealing ahead of the dissemination of investment research, we will not seek to take any advantage before providing it to our clients.
Pepperstone doesn’t represent that the material provided here is accurate, current or complete, and therefore shouldn’t be relied upon as such. The information, whether from a third party or not, isn’t to be considered as a recommendation; or an offer to buy or sell; or the solicitation of an offer to buy or sell any security, financial product or instrument; or to participate in any particular trading strategy. It does not take into account readers’ financial situation or investment objectives. We advise any readers of this content to seek their own advice. Without the approval of Pepperstone, reproduction or redistribution of this information isn’t permitted.

Silver Poised for Breakout to the New High.Silver is consolidating below a descending trendline but holding above the 20 Ma. Buyers are defending higher lows with strong bullish pressure. Rising momentum signals a breakout is near. A close above the trendline could trigger a significant move to new highs.

Technical Analysis: Silver (XAG/USD) - Monthly & Weekly Outlook1. Price Action & Breakout:
Silver has successfully broken out and consolidated above the key $48 level on the weekly timeframe with a strong bullish candle.
This breakout is technically significant and confirms buyer strength.
2. Trend Analysis:
Primary Trend: 🟢 Strongly Bullish on both Monthly and Weekly timeframes.
The long-term structure remains upward, but caution is advised in the short term.
3. Market Condition & Warning:
⚠️ Overbought Alert: All timeframes are currently showing overbought conditions based on key oscillators (RSI, Stochastic).
While the trend is bullish, the risk of a corrective pullback has increased substantially.
4. Chart Pattern & Targets:
Major Pattern: A Long-Term Cup and Handle pattern has formed and is now CONFIRMED with the recent breakout.
Long-Term Projection: Based on pattern measurement, potential targets are set at:
Target 1: 65$
Target 2: 90$
5. Important Consideration:
Missing Correction: Notably, a meaningful pullback following the weekly breakout has NOT yet occurred.
High Volatility Expected: Silver's path upward is likely to be characterized by significant volatility and sharp corrections.
Key Levels:
Support: $48.00 (Previous Resistance, now support)
maybe Resistance: $65.00 (Psychological Level)
Bias: 🟢 Bullish for the long-term, but expect high volatility.
OANDA:XAGUSD #SILVER - Monthly/Weekly
✅ CONFIRMED BREAKOUT above $48 on Weekly.
✅ LONG-TERM CUP & HANDLE pattern activated.
🟢 TREND: Strongly Bullish (M & W).
🎯 LT TARGETS: $90 - $100 (Pattern Based).
⚠️ WARNING: All TFs in Overbought territory. No significant pullback yet. High volatility expected. Trade with caution!
"We view silver as a strong investment and have added it to our portfolio."🔥
Disclaimer: This is our team's analysis, not investment advice. The markets are highly volatile. Always do your own research before trading.
What are your thoughts on Silver's next move?

Silver can accelerate the momentumSilver is moving within the strong momentum expansion, having jumped for more than 4 daily volatility levels from the 20-day moving average for the last several days.
That usually represent a strong price discovery pattern, when the market searches for the new equilibrium: $60 is considered to be the next possible stop, but may extend beyond this level with ease.
ETF and options volume have been growing so far. Metal traders rotate from Gold to Silver, as it produces the next big fally.
As it's the overheated market, the idea might unfold quickly on the H1 timeframe, if the price would lock inside of a consolidation area as shown at the chart.
Timing is crucial in such situations, as volatility is quite high.
Remember - this is not a signal, it's just the idea for a trade. Consider making your own research and never forget to manage your risk!

Silver’s Cup & Handle Breakout – Road to $60+ Silver has completed a textbook cup and handle formation and is breaking above the key resistance level at $54. The pattern shows a rounded bottom (cup) formed between $46-$54, followed by a consolidation handle, with price now surging toward new highs at $56.5
Technical Setup:
• Cup depth: Approximately $8 (from $46 low to $54 resistance)
• Breakout level: $54.00
• Price target calculation: $54 + $8 = $62.00+
With momentum like this, the technical target comes in around $62
As long as silver stays above old resistance ($54–$55), bulls are in the driver’s seat.
Risk Management: Consider stops below the handle low around $50 to protect against false breakouts.
This setup aligns with broader precious metals strength and represents a continuation pattern following silver's major 2025 rally.

Gold or Silver?Right now: SILVER!
I know, I know! Crazy schitt! Don't look at me!
The chart’s telling the story — Silver hasn’t even really started its move yet. Don’t blame me, I’m just reading the data.
Silver is up 87% year-over-year and outperforming gold by 11%, which is still on the low end historically.
That suggests Silver either has room to run from here, or it’s simply the safer relative play versus gold on a risk-adjusted basis.
If you’ve got space in your portfolio, it’s a reasonable addition.
If it hits nose-bleed levels, we reassess.
THANK YOU for getting me to 5,000 followers! 🙏🔥
Let’s keep climbing.
If you enjoy the work:
👉 Drop a solid comment
Let’s push it to 6,000 and keep building a community grounded in truth, not hype.

SILVER USDHI GUYS
I have stopped trading silver until it rallies all the way up to area of interest as illustrated.
NOTE . this was due to a false price pattern i posted last week.
i have to know every move before it happens once an error occurs then i make correction or wait for a few months to edit the trading future script on 6 month 12 month and 24 months

XAGUSD Cup n handle breakoutXAGUSD Cup n handle breakout
Entry: 54.385
SL: 4104 (Below alligator jawline)
TP: 62.70 (Cup n handle TP)
RR: 1:2.78RR

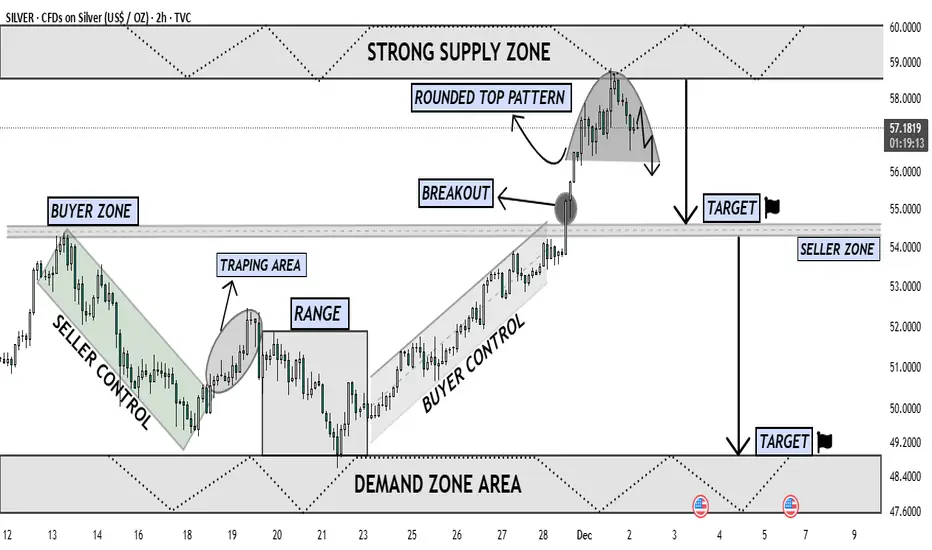
Silver Forming Major Top Near Supply Downside Retracement LikelyThe chart shows Silver reaching a major Strong Supply Zone near the 58–60 level, where price has reacted multiple times in the past. After a strong impulsive rally driven by Buyer Control, the market broke above the previous Buyer Zone, confirming bullish strength. However, once price entered the upper supply region, momentum started to fade, forming a clear Rounded Top Pattern — a classic distribution structure indicating exhaustion of buyers.
Following the breakout retest, buyers failed to continue upward, and sellers stepped in aggressively from the supply zone. The chart now shows a shift from buyer dominance to seller pressure, with price beginning to curve downward inside the rounded top. This shape reflects decreasing highs, weakening demand, and early reversal signals.
The projected move suggests that once the neckline of the rounded top breaks with strong bearish candle confirmation, price is likely to fall toward the first Target Zone around 54, which aligns with the Seller Zone and previous breakout structure. If bearish continuation remains strong, the next logical target lies in the Demand Zone Area between 48–49, where liquidity is expected to support a potential reversal or consolidation.
Overall, this chart indicates a high-probability corrective phase, with sellers preparing to reclaim control as the market rejects the supply zone and transitions into a deeper pullback phase. Buyers must show strong defense at the mid-support; otherwise, Silver could decline further toward the lower demand region.
XAG/USD Long Position OpportunityBased on the daily technical analysis of XAG/USD, the overall trend remains bullish. Price is holding above the key support zone of $56–$56.5, which indicates strength for long positions. If this support sustains, the next upside target is expected in the $58–$60 resistance zone.
A temporary pullback is possible due to overbought conditions, but the broader trend continues to favor long trades.
Please let me know if you require a detailed entry and risk management plan.

SILVER (XAGUSD) – 4H Technical AnalysisBias: Bullish after expected retest | Target: 63.25 (Triangle Projection)
Status: WAIT FOR RETEST → BUY ON CONFIRMATION. Trade Plan (Swing)
ENTRY
Wait for retest of:
$54.00 – $54.50 zone
Or deeper wedge support at $52.80–53.20
Confirmation required:
Reversal candle (4H)
Volume spike
No lower-low below $52.50
STOP LOSS
Conservative SL: $51.90
Structural SL: $50.80 (below wedge support)
TARGETS
T1: $58.50
T2: $60.80
T3: $63.25 (Triangle Projection)
Overall Verdict
SILVER is in a strong uptrend and forming a textbook bullish continuation pattern.
The current breakout is false, and the chart strongly suggests:
A pullback to $54 zone
Bounce from support
Final breakout towards 63.25
This aligns perfectly with your annotations.
Bias: Strong Bullish after Retest
Current Action: WAIT for pullback (no buying at the top)
Disclaimer
This analysis is for educational purposes only and not investment advice. Trading involves risk; please conduct your own due diligence before taking positions.

XAGUSD Short Setup — Rejection at Key Supply ZoneSilver (XAGUSD) has tapped into a higher-timeframe supply zone around the $58.50 – $58.80 area and showed clear signs of exhaustion. After sweeping the highs, price failed to continue upward and shifted into short-term bearish structure on the 15-minute chart.
📌 Entry: around $57.90 – $58.00
📌 Stop-loss: above the liquidity sweep / supply zone (~$58.70)
📌 Take-profit: toward $56.40 – $56.60 (previous demand + imbalance fill)
➕ Confluences
Liquidity grab above the previous high
Multiple rejection candles at supply
Loss of bullish momentum and break of structure (M15)
High risk-reward ratio on continuation to downside
⚠️ What invalidates the setup?
A decisive move above $58.70 with strong bullish volume would invalidate the short bias and open room for continuation toward $59.50+.

FROM RALLY TO REALITY, SILVER'S CORRECTION IS STRUCTURALPeace be unto you
Primary Chart: Silver Analysis (Weekly Timeframe)
A) Wave Analysis: Minor wave 3 peaks, sharp correction looms
Price is currently completing minor wave 3 that began printing on the 4th of October 2023. Minor wave 1 started printing on the 1st of September 2022 and terminated on the 5th of May 2023. Minor wave 2 sideways correction began when minor wave 1 terminated and terminated when minor wave 3 started printing. Minor wave 4 is expected to be a sharp correction in line with the law of Elliot Waves Guideline on Corrections (Wave 2 and 4) which states that "if wave 2 is a sharp correction, expect wave 4 to be a sideways correction, and vice versa". Thus, minor wave is forecasted to be sharp and retrace to 50% and 61.8% retracement levels of minor wave 3, i.e. minor wave is forecasted to terminated within the 38.6814 and 34.5068 levels before price begins printing minor wave 5 to complete intermediate wave (3) as indicated on the primary chart.
B) Indicator(s) Analysis: Bearish Divergence confirmed and bulls losing altitude. The EMA magnet activated, pullback before the next push. The MACD flips the script, and a seasonal shift is detected.
1) EMA 50 & 150 (Weekly) - Though strongly bullish, price will pull back to touch these moving averages before it continues to rally.
2) RSI 14 (Weekly) - The RSI has rallied above the 70 upper band in August 2025 and reached a peak in October 2025. On the 3rd of November 2025 the RSI reached a trough, and it is now printing a lower high whilst price is printing a higher high. This is known as a Strong Bearish Divergence signaling that bulls are growing weak and that price will collapse on its weight.
3) MACD H (Weekly) - Price has been printing above the MACD centerline indicating that bulls have been strong, but on the 20th of October 2025 we have seen a down close on MACD Histograms indicating a possible trend reversal and a change of season. This is the time to go short.
#SabaliCapital
#TechnicalAnalysis
#PreciousMetals
XAGUSD it's further bulishh scnerios? #SILVER.. market stagnent even gold drop but silver constant hold his bulish pattern ..
So if market holds further then upside 60 plus can be a possible next stop ..
Good luck
Trade wisely

XAG/USD Key Zone Reaction – Are Bulls Ready to Take Control?🥈 XAGUSD: SILVER VS US DOLLAR 💰
Metals Market Opportunity Blueprint | Swing Trade Analysis
📊 MARKET STRUCTURE & SETUP
✅ Current Price Action: $48.34 | 52-Week Range: $28.16 - $54.50
✅ Technical Trend: Bullish Bias Confirmed
✅ Setup Type: Double Pullback Retest of 200 SMA
🎯 THE THIEF STRATEGY: LAYERED ENTRY APPROACH
This is NOT a single entry point strategy. We employ the THIEF LAYERING METHODOLOGY — multiple limit orders positioned at strategic support zones to maximize entry efficiency and reduce average entry price.
📍 ENTRY LAYERS (Buy Limit Orders):
Layer 1: $48.000 ⭐ (Immediate Support)
Layer 2: $48.500 ⭐ (Pullback Zone)
Layer 3: $49.000 ⭐ (Resistance Break)
Layer 4: $49.500 ⭐ (Extended Support)
💡 Pro Tip: You can increase/decrease layers based on your risk tolerance and position size. Accumulate, don't dump!
🛑 STOP LOSS MANAGEMENT
📌 Thief Original SL: $47.000
⚠️ This is MY suggested level based on technical structure
🔴 IMPORTANT: Dear Ladies & Gentlemen (Thief OG's) — Set YOUR OWN stop loss based on YOUR risk profile
💪 This is YOUR money, YOUR risk, YOUR decision
Adjust SL based on your strategy, account size, and risk/reward ratio
🚀 PROFIT TARGET STRATEGY
🎪 Target Zone: $54.000
📈 Technical Basis: 200 SMA acts as strong dynamic resistance
⚡ Market Structure: Overbought territory warning
🔔 Trap Alert: Potential sell-side liquidity trap at resistance
⚠️ Target Notes:
🔴 IMPORTANT: Dear Ladies & Gentlemen (Thief OG's) — Set YOUR OWN take profit target
📊 Don't just copy my TP blindly — analyze price action yourself
💼 You earn the profits, you manage the exit — YOUR choice, YOUR reward
Consider trailing stops or partial profit-taking strategy
🔗 CORRELATED PAIRS TO MONITOR (Key Dollar Pairs)
1️⃣ TVC:DXY (US Dollar Index)
Correlation: INVERSE ↔️ As DXY strengthens, XAG/USD weakens
Why Monitor: Strong dollar headwind for silver prices
Watch Level: DXY above 105.00 = bearish for silver
Strategy: If DXY rallies, reduce silver long positions
2️⃣ $XAU/USD (Gold vs Dollar)
Correlation: POSITIVE ✅ Silver follows gold's lead
Why Monitor: Gold is the "big brother" in precious metals
Watch Level: If gold breaks $2,100, silver likely follows
Strategy: Gold weakness = caution on silver longs
3️⃣ FX:EURUSD (Euro vs Dollar)
Correlation: INVERSE ↔️ Weak dollar = strong euro
Why Monitor: Dollar weakness supports precious metals
Watch Level: EURUSD above 1.1200 = bullish for silver
Strategy: Strong euro environment = tailwind for XAG
4️⃣ FX:USDJPY (Dollar vs Japanese Yen)
Correlation: INVERSE ↔️ Dollar weakness supports risk-on sentiment
Why Monitor: Risk appetite indicator (yen often "fear" currency)
Watch Level: USDJPY below 145.00 = risk-on (silver bullish)
Strategy: Lower USDJPY = better environment for commodities
5️⃣ SP:SPX / S&P 500 Index
Correlation: POSITIVE ✅ Risk-on markets support commodities
Why Monitor: Stock market rallies often lift precious metals
Watch Level: SPX new highs = bullish momentum for silver
Strategy: Market strength = broader bullish sentiment
📋 TRADE CHECKLIST BEFORE ENTRY
✅ Price action confirms double pullback on 200 SMA
✅ DXY showing weakness or neutral bias
✅ XAU/USD supporting bullish thesis
✅ No major macro events in next 4-6 hours
✅ Volume confirmation on breakout
✅ Risk/Reward ratio minimum 1:2
✅ Position size = % of account (YOUR decision)
⚡ KEY TRADING RULES
Layering ≠ Averaging Down Losers
Build positions at PRE-PLANNED levels only
Don't add to losing positions outside your strategy
Stop Loss is Sacred
NO moving stops to breakeven without reason
Protect capital first, chase profits second
Take Profits Strategically
Partial exits: Scale out at resistance zones
Don't go all-in, don't take all-out at once
Dollar Monitoring is Mandatory
Strong DXY = reconsider position
Weak DXY = stay long with conviction
Risk Management Over Everything
Your SL & TP = your rules
No trade is worth emotional decision-making
$XAG > $BTC? The 1980 "Curse" is Finally Broken.We just witnessed history. Stop scrolling and look at the chart.
For 45 years, the $50 level was the "Graveyard of Bulls."
1980: The Hunt Brothers cornered the market, peaked at $50, and crashed.
2011: The retail mania hit $49 and collapsed.
Today, that ceiling is gone. NASDAQ:XAG hasn't just "broken out"; it has shattered the most significant resistance level in modern financial history. We are trading at $58+, well into price discovery mode.
The "No-BS" Reality: While CRYPTOCAP:BTC is fighting for its life to hold support during this liquidity crunch, Silver has done what "Digital Gold" promised to do but couldn't.
CRYPTOCAP:BTC Status: Flushing leverage, correlating with tech stocks, and failing to act as a hedge.
NASDAQ:XAG Status: Breaking a 45-year suppression cycle to become the #1 performing asset.
The Setup (The Cup & Handle of the Century): This is a 45-year technical structure. The "Cup" started in 1980. The "Handle" ended this month.
The Breakout: $50 is now the floor, not the ceiling.
The Target: The measured move from the 1980 peak targets $85.89 - $89.15.
My Outlook: The "Gold 2.0" narrative is being tested in real-time.
Long NASDAQ:XAG : I am riding this breakout to the $89 target.
The "Re-test" Buy: If we dip back to $50 (the 1980 High), that is a generational buying opportunity. Old resistance must become new support.
Verdict: The "relic" just outperformed the "future." The 1980 curse is dead.
👇 Discussion: Is CRYPTOCAP:BTC failing its "Gold 2.0" audition, or is this just a temporary rotation before Crypto catches up to AMEX:SLV & AMEX:GLD Sectors ? Let me know your targets below.

SILVER Free Signal! Buy!
Hello,Traders!
SILVER shows price reacting inside a fresh demand block after a liquidity sweep, signaling potential bullish displacement as long as the demand floor holds.
--------------------
Stop Loss: 5,643$
Take Profit: 5,780$
Entry: 5,700$
Time Frame: 1H
--------------------
Buy!
Comment and subscribe to help us grow!
Check out other forecasts below too!
Disclosure: I am part of Trade Nation's Influencer program and receive a monthly fee for using their TradingView charts in my analysis.

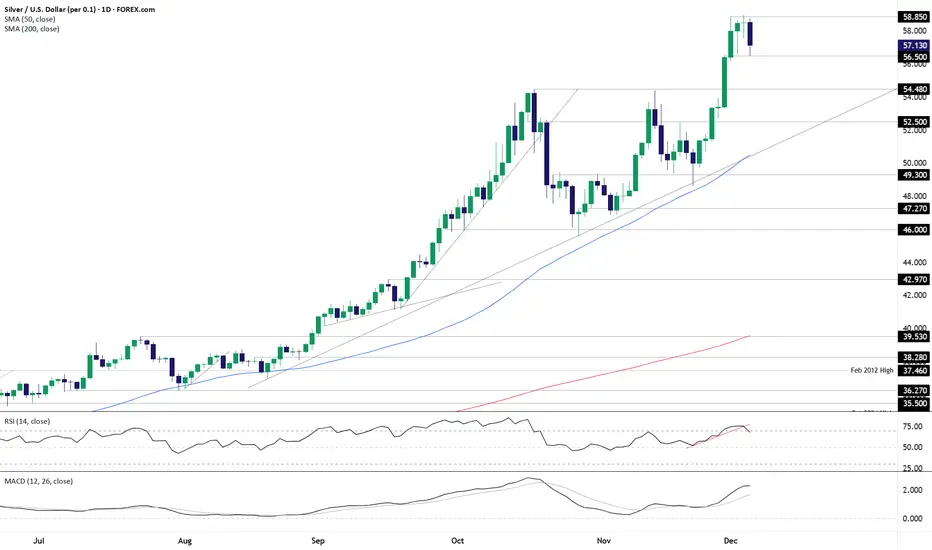
Three candles, one message: Bulls bewareSilver has completed a three-candle evening star pattern following a sharp run higher, warning of bearish reversal risk. However, before acting on the signal, it would be preferable to see the price push below $56.50 before considering short setups, providing a level where a stop could be placed above it for protection against reversal.
Downside targets to consider include $54.48, $52.50 or August uptrend support/50DMA, the latter found today at $50.48.
RSI (14) has broken its uptrend and is curling over but remains above the neutral 50 level, indicting waning upside strength. MACD provides a similar message, beginning to curl over towards the signal line while remaining firmly in positive territory. It’s not a bearish picture being provided by the oscillators, but it does provide a reason for bulls to be cautious around these levels.
While the option is there to act immediately on the bearish signal and initiate shorts at current levels, given the bullish frenzy seen in silver over recent months, risk management looms as particularly important for anyone considering bearish setups.
Good luck!
DS