STILL IN | SILVER is BEATING GOLD SO BAD RIGHT NOWStill on this beautiful wave at 9.5RR. My SL trail is at 50% from entry to maximum level attained after entry for now.
Trade ideas

Trader Tilki | XAGUSD (Silver) 1H Analysis: Strategic Buy ZonesHello Guys,
Here’s my XAGUSD-SILVER analysis. I’ve received many requests for this, and every follower matters to me — I can’t ignore your demands.
As you know, SILVER usually moves in positive correlation with GOLD and often reacts the same way to news events.
The buy levels I’ll be watching:
🔵 BUY level: 44.66118
🔵 BUY level: 44.02180
🟢 Target level: 46.64801
🔴 Set your stop level according to your own margin.
If price reaches these zones, I’ll definitely open a buy position and take my shot.
Let’s see together how this analysis plays out.
Every like is my biggest motivation to keep sharing these analyses.
Thanks to everyone supporting and following me!

SILVER: Expecting Bearish Movement! Here is Why:
Looking at the chart of SILVER right now we are seeing some interesting price action on the lower timeframes. Thus a local move down seems to be quite likely.
Disclosure: I am part of Trade Nation's Influencer program and receive a monthly fee for using their TradingView charts in my analysis.
❤️ Please, support our work with like & comment! ❤️

Sensitive range for silverSilver is currently in a very important supply range and we need to wait and see how the price reacts to the range and then make a decision.
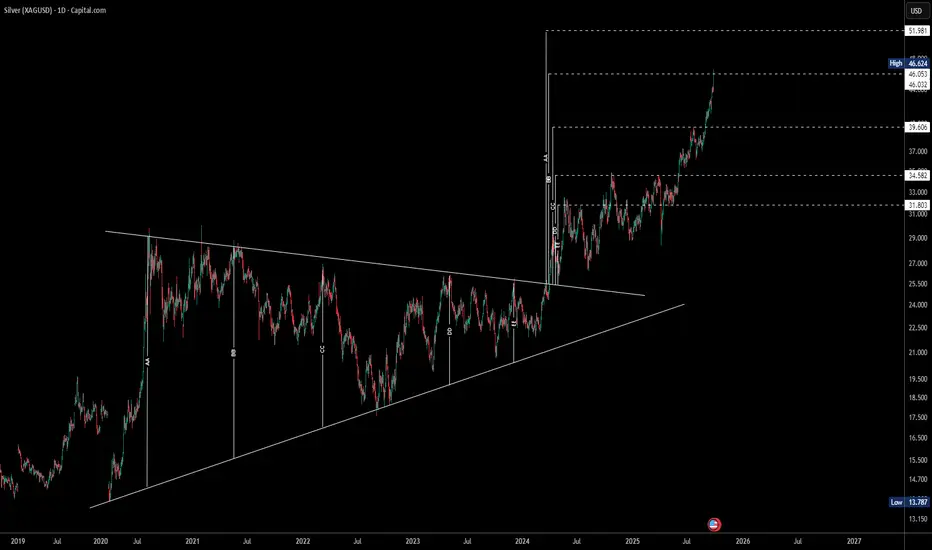
Everywhere I look ~ TrianglesCan't help but be pleased with myself for using what seems to work in determining when I should be acquiring more physical silver, while trading it's illegitimate paper cousins...
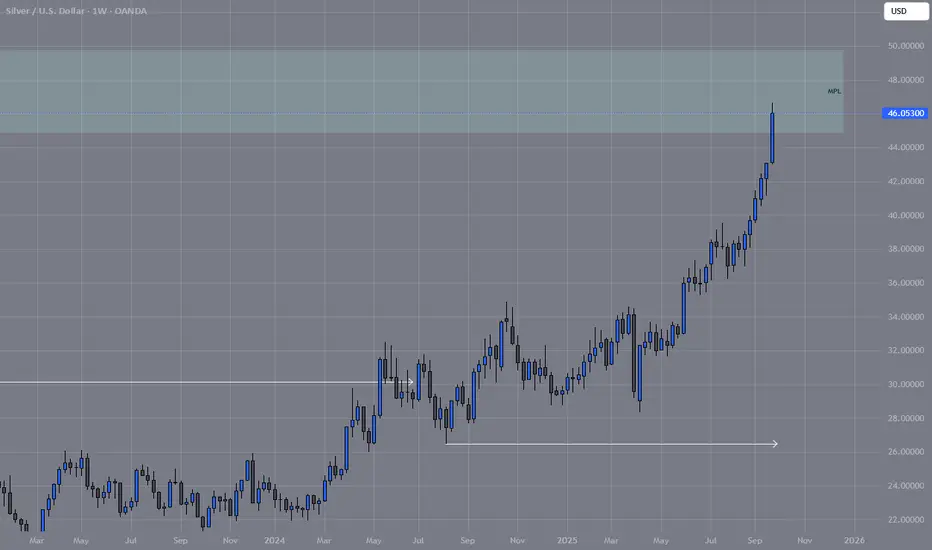
silver touch at 45 year's silver trading 1980 & 2011 high / near multi decade resistance , may face resistance after breaking 50 Dollar mark

Silver is getting REALLY close to the historical $48 mark.Silver is getting REALLY close to the historical $48 mark.

SILVER Hitting ALL-TIME-HIGH 50$! EPIC!
Guys!
While everyone was obsessed with Gold for obvious reasons, Silver quietly made 300%!!! since 2020, and more than 65% in 2025 alone. Bitcoin? How about Silver baby?! And I am not surprised. I've been telling everyone who'd listen that Silver is epically Undervalued and here we are at an all-time-high again. From where we are bound to see a good correction.
But make no mistake! Silver will keep growing, along with Gold in the coming years and the coming I will treat the coming correction as a way to buy MORE Silver!
Precious metals are out past, present and future with no real replacement, and I oh boy will I be buying the dip!

SILVER What Next? SELL!
My dear followers,
I analysed this chart on SILVER and concluded the following:
The market is trading on 4606.0 pivot level.
Bias - Bearish
Technical Indicators: Both Super Trend & Pivot HL indicate a highly probable Bearish continuation.
Target - 4537.7
Safe Stop Loss - 4644.6
About Used Indicators:
A super-trend indicator is plotted on either above or below the closing price to signal a buy or sell. The indicator changes color, based on whether or not you should be buying. If the super-trend indicator moves below the closing price, the indicator turns green, and it signals an entry point or points to buy.
Disclosure: I am part of Trade Nation's Influencer program and receive a monthly fee for using their TradingView charts in my analysis.
———————————
WISH YOU ALL LUCK

XAGUSD 4H🔹 Overall Outlook and Potential Price Movements
In the charts above, we have outlined the overall outlook and possible price movement paths.
As shown, each analysis highlights a key support or resistance zone near the current market price. The market’s reaction to these zones — whether a breakout or rejection — will likely determine the next direction of the price toward the specified levels.
⚠️ Important Note:
The purpose of these trading perspectives is to identify key upcoming price levels and assess potential market reactions. The provided analyses are not trading signals in any way.
✅ Recommendation for Use:
To make effective use of these analyses, it is advised to manually draw the marked zones on your chart. Then, on the 15-minute time frame, monitor the candlestick behavior and look for valid entry triggers before making any trading decisions.


Silver (XAGUSD) - Potential Long Opportunity on Structure RetestHello TradingView Community,
This is a technical analysis of a potential long (buy) setup on the 15-minute chart for Silver/U.S. Dollar (XAGUSD). The idea is based on a classic price action pattern of a breakout and retest.
Analysis:
As we can see on the chart, the price has recently broken through a significant resistance level at approximately $44.658. Following this strong upward move, the price is now pulling back to retest this former resistance zone, which is expected to act as new support. This "resistance-turned-support" is a common and often reliable pattern that can signal a continuation of the trend.
The current price action suggests that buyers may be stepping back in at this level, providing a potential entry for a move higher.
Trade Idea:
Position: Long (Buy)
Entry: Around the $44.658 level.
Stop Loss: A logical placement for the stop loss is below the support level and the recent swing low, at approximately $43.686. A break below this level would invalidate the immediate bullish bias.
Take Profit: The target for this trade is set at the recent highs, around $47.613. This provides a favorable risk-to-reward ratio for the setup.
Risk Management:
As with any trade, proper risk management is essential. This analysis is for informational and educational purposes only and should not be considered financial advice. Always do your own research and analysis before entering any trade.
Good luck, and trade safe

Silver lets buy the dipB:$37.862
Set up: Buy on the pullback at 0.50 or 0.618 Fib level.
SL:$37.310
TP:$40

Silver Going ParabolicRunning a little hot right here but any decent pullback I will be buying. Prediction this will blow through the all-time 2011 high of $46.7/oz before EOY and may blow off the top at around $50/oz which seems like the logic milestone next.

Get some Silver coins before breaking 50$I am expecting a weaker dollar for the next decade. Commodities especially gold, silver and oil might fly.

XAG/USD | Silver Rally Continues – Bulls Eye $44.60 & $44.80! By analyzing the Silver chart on the 2-hour timeframe, we can see that after correcting down to $43.34, the price gained demand again and rallied more than 2.5%, reaching $44.47.
Currently, silver is trading around $44.16. If the price breaks above $44.49, we could see another push higher, first retesting $44.47, and then aiming for $44.60 and $44.80 as the next targets.
Please support me with your likes and comments to motivate me to share more analysis with you and share your opinion about the possible trend of this chart with me !
Best Regards , Arman Shaban

SILVER: Will Go Up! Long!
My dear friends,
Today we will analyse SILVER together☺️
The price is near a wide key level
and the pair is approaching a significant decision level of 45.405 Therefore, a strong bullish reaction here could determine the next move up.We will watch for a confirmation candle, and then target the next key level of 45.807.Recommend Stop-loss is beyond the current level.
❤️Sending you lots of Love and Hugs❤️

SilverXAGUSD
- Completed " 12345 " Impulsive Waves
- Rising Wedge as an corrective pattern in Short Time Frame
- Order Block
- Demand Zone
- RSI - Divergence

Fibonacci Time Zone Overlap with Fibonacci RetracementAfter breaking out of its valid Andrews fork, the price has stalled at the overlap of the Fibonacci Time Zone with the Fibonacci Retracement, and the likely scenario is a temporary price drop into the fork.
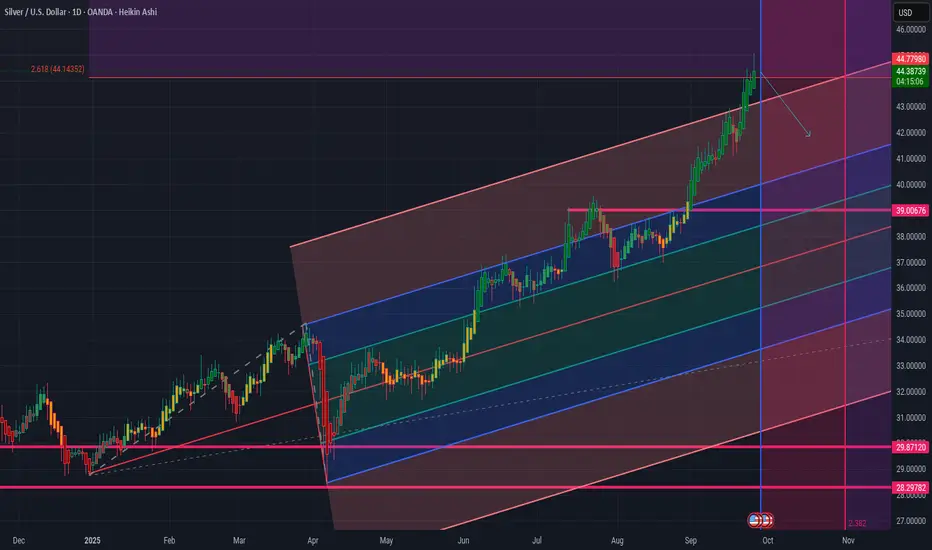
Hitting Fibonacci resistance on the XAGUSD chartAs can be seen in the chart; Fibonacci and Andrews fork are plotted in the same area. After many reactions to the fork ranges, the price has broken out of the fork and hit the Fibonacci resistance. It is likely that the price will return to the fork with this hit and will reject the next price resistances with the help of the fork channels.

XAGUSD reaction to Andrews' forkGiven the high price reactions to the drawn Andrews fork, there is a possibility that the price will return to the fork upon hitting the indicated resistance and follow the path indicated by the arrow.

Bullish Setup, Swing Trade Opportunity in XAGUSDJust wait for a Price to Enter in our Discount Zone and then we are Ready to go Long with Proper Risk Management

Clear run to $46?Re-tested previous high on pullback this morning, top of channel $46, breakdown in OANDA:XAUXAG
