SILVER - LTF Buy PressureSILVER
Metals bounce printing and this is where we get to see if SILVER has gas in the tank or gassing out.
Its interesting that the monthly candle looked very bearish but now as the month draws to a close, a lower wick candle is printing - showing buy pressure.
This could well be a dead cat bounce but it could also be the dip low for the area.
Also a slightly higher high then slump could be a Wyckoff Distribution UpThrust (topping pattern).
But the high time frame area does form a bowl shape which could be bullish - so there is a case for both sides:
I think its somewhat more likely that a top is forming and SILVER completing a 3 wave upside correction.
If it is, then its a very bearish look and I think $21 is the most likely ratio area for downside target:
If that scenario will play out then this bounce is a great opportunity to see the danger and take profit in prime position.
But it may not and SILVER does have a shot at the heavens with the next fib @ $120:
It might just happen but its very dangerous with GOLD hitting highest month RSI since 1980:
and Palladium printing a very bearish Shooting Star 🧐:
www.tradingview.com
This analysis is shared for educational purposes only and does not constitute financial advice. Please conduct your own research before making any trading decisions.
Trade ideas

Siver may reach ATH again but not gold. 26/Oct/25 XAGUSD based on wave substructure silver may reach ATH again next week with price touching the upper trendline ( red) 3rd time at 55 +/-

The opportunity to buy long silver has arrived.
Silver has fallen sharply, breaking below support at 47.5 and then continuing its downward trend. It's now almost certain that 46 represents the mid-term bottom. Today, you can continue to buy silver above 46. Meanwhile, if you're bullish, pay attention to the upward resistance points. Only after it holds above 48 can you see a continued rally to 50 or the previous high.
As you all know, the recent market conditions are quite significant. Our recommendations are subject to change and are time-sensitive. Short-term trading, in particular, requires precise technical analysis and decisive action to make profits easier. If you need to recover significant losses or obtain accurate trading signals, please contact me.

Stop!Loss|Market View: SILVER🙌 Stop!Loss team welcomes you❗️
In this post, we're going to talk about the near-term outlook for SILVER ☝️
Potential trade setup:
🔔Entry level: 45.69877
💰TP: 41.19089
⛔️SL: 48.77557
"Market View" - a brief analysis of trading instruments, covering the most important aspects of the FOREX market.
👇 In the comments 👇 you can type the trading instrument you'd like to analyze, and we'll talk about it in our next posts.
💬 Description: Metals remain a mid-term sell priority. For silver, the most likely scenario is the formation of a small accumulation near 47.48680 (main scenario), where the price expectedly paused its decline. Given the Fed's interest rate decision today, we can't rule out volatility, which could lead to a retest of the point of control (POC) area around 48.80 (alternative scenario). The downside target remains in the 41-42 range.
Thanks for your support 🚀
Profits for all ✅
❗️ Updates on this idea can be found below 👇

Silver. XAGUSD Beautiful Elliott wave structureSilver has a textbook elliott wave structure. Wave 3 has hit extension 2,00 — standard region to end wave 3— Now it seems to be working on wave 4. Ideal region to complete this pullback resides between extensions 1,00 and 1,236. Once this 4th wave is completed, Silver will develop wave 5 towards at least extension 2,618

Bullish idea for silverIt's been very exciting to watch to watch gold and silver tearing up the charts. We've seen a beautiful retracement on silver (and gold as well).
Silver cleared that OB and now I'm waiting for any meaningfull reaction to this area of interest.
Ideally I would like to see it touch the edge of the low volume node (blue) and start making bullish structure. That would be my cue to step into a long position. TP would be near the last ATH, but with the given market conditions I would rather trail my SL further into profit.
If price fails to bounce of the low volume node, we might see a further drop to the 43,500 area.
For now we just set alerts and monitor PA

SILVER - BEARISH MOVE!Hello traders,
The Silver price failed to create a new higher high!
Currently, The higher low is broken (change of character).
So, I expect a bearish move📉
__________
TARGET: 46.99000🎯

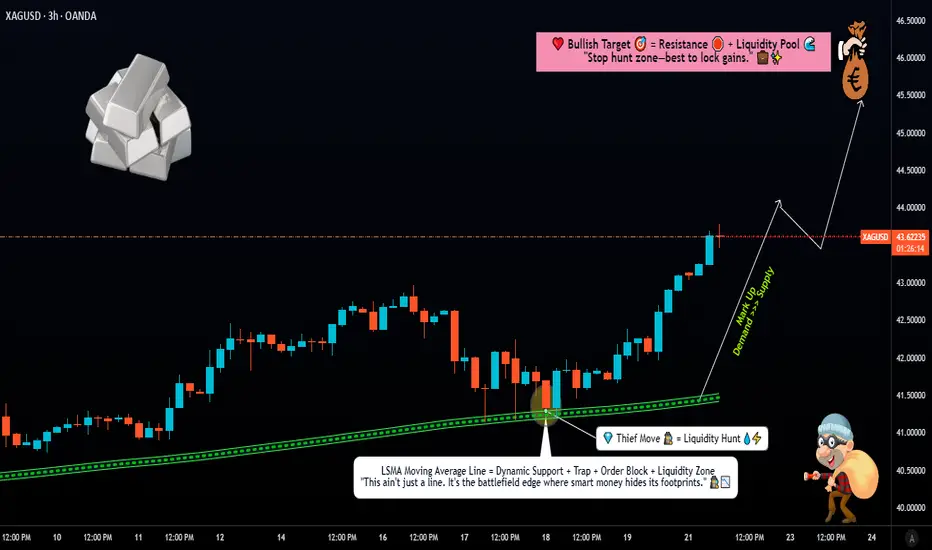
Silver Rally in Play – Prepare Layered Entries!🔥 Silver Heist: XAG/USD Day Trade Wealth Map 🤑💰
🎉 Ladies & Gentlemen, Welcome to the Thief’s Vault! 🚨 Get ready to swipe some shiny profits with this XAG/USD (Silver vs. US Dollar) bullish breakout plan! Our Metal Market Wealth Strategy Map is locked and loaded for a day trade adventure. Let’s dive into the heist with a polished, professional, yet sneaky fun vibe! 😎
📈 The Setup: Bullish Bandits on the Move! 🐂
🔍 Market Context: Silver (XAG/USD) is flashing bullish vibes 📡 with a confirmed Least Squares Moving Average (LSMA) pullback. The price has swept liquidity at the dynamic moving average support, giving bull traders the upper hand. 💪
🚀 Why It’s Hot: The bulls are charging as the price respects the dynamic support, signaling strength and a potential breakout. The market’s screaming, “Time to stack those silver bars!” 🪙
🏦 The Heist Plan: Thief-Style Layered Entries 🎯
🛡️ Entry Strategy: We’re using the infamous Thief Layering Strategy! 🕵️♂️ Place multiple buy limit orders to catch the price at key levels. Suggested entry layers:
$42.50
$43.00
$43.50
💡 Pro Tip: Feel free to add more layers based on your risk appetite! Stack those orders like a master thief. 😏
📝 Entry Note: You can enter at any price level within the bullish zone, but layering gives you the edge to scale in like a pro. 📊
🛑 Stop Loss: Protect the Loot! 🔒
🛑 Thief SL: Set your stop loss at $41.50 to keep your capital safe from market traps. 🕳️
📣 Note: Dear Thief OG’s (Ladies & Gentlemen), this SL is my suggestion, but it’s your heist, your rules! Adjust based on your risk tolerance and make those profits yours. 💸
🎯 Take Profit: Cash Out Like a Boss! 💼
🎯 Target: We’re aiming for $46.00, where strong resistance, overbought conditions, and potential traps await. 🪤 Lock in profits before the market pulls a fast one!
📣 Note: Dear Thief OG’s, this TP is my call, but you’re the master of your vault! Take profits at your discretion and secure the bag. 🤑
🔗 Related Pairs to Watch 👀
🔎 #XAUUSD (Gold vs. US Dollar): Gold and silver often move in tandem due to their precious metal correlation. A bullish XAU/USD could reinforce our XAG/USD setup. 🪙
🔎 USD Index (#DXY): A weaker US dollar typically boosts precious metals. Watch for DXY weakness to confirm bullish momentum in XAG/USD. 📉
🔎 #AUDUSD: The Aussie dollar has a positive correlation with silver due to Australia’s commodity-driven economy. A rising AUD/USD could signal strength in XAG/USD. 🇦🇺
🔑 Key Points & Correlations
🔔 Liquidity Sweep: The recent pullback to the LSMA support cleared out weak hands, setting the stage for a bullish surge. 🚀
🔗 Correlation Insight: Silver’s price action often mirrors gold (XAU/USD) due to their shared safe-haven status. A declining DXY or rising AUD/USD can amplify this setup’s potential. 📊
⚖️ Risk Management: Use the layered entry strategy to spread risk and maximize reward. Always respect your stop loss to avoid getting caught in a market trap! 🕵️♂️
⚠️ Disclaimer
This is a Thief-Style Trading Strategy crafted for fun and educational purposes. Trading involves risks, and I’m not a financial advisor. Always do your own research and trade at your own risk. 😎
✨ If you find value in my analysis, a 👍 and 🚀 boost is much appreciated — it helps me share more setups with the community!
#️⃣ #XAGUSD #Silver #DayTrading #ThiefStrategy #Bullish #TradingView #SilverTrading #DayTrade #ThiefTrader #LSMA #ForexStrategy #MetalMarket #TradingIdeas #LayeredEntries #BullishSetup #TradingView
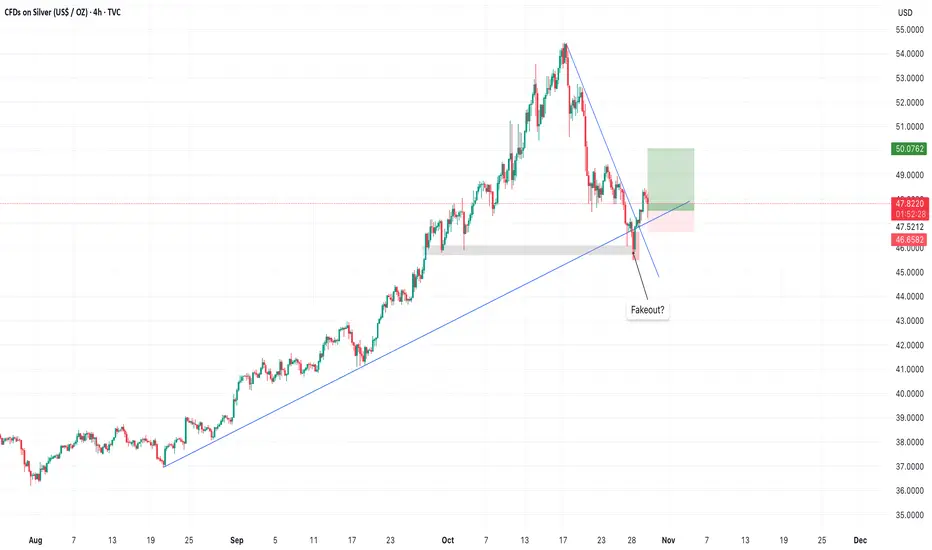
SILVER LongHello traders,
I am sharing my biases for Silver (XAG). My opinion is that we will have a touch to price 50$ at least. The reason why I'm getting long here is because we have a fakeout , and the trendline is holding properly. Also the bullish engulfing on 4H formed yesterday, gives another indication for long.
Retracement needed to enter long silverHi, price reacted perfect to the low volume node as it is bouncing back up. Now I would want to see price continuing to produce bullish structure. The green support area would be a good oppportunity to enter a long position. Alerts are set!

SILVER UpdateNext move on the way, focus on proper risk management & stay disciplined. Wishing you successful trades..!
Key Reason:
1. 1H Bullish OB formation.
2. BISI still in pending.
3. From this zone possible bullish move expected.
Let's see how it will work.
SILVER LIKELY TO GO HIGHER|LONG|
✅SILVER is currently trading within a bullish dealing range between the demand and supply areas. After engineering liquidity beneath internal equal lows, strong displacement confirms bullish order flow. Expect continuation toward external liquidity above 50.50$. Time Frame 4H.
LONG🚀
✅Like and subscribe to never miss a new idea!✅

Short in silverAs you can see there is shorting opportunity in silver as well as gold so what is your view on this??????

XAGUSD, Silver , Parabolic move aheadSilver-XAGUAD after breaking past previous ATH, retested and formed a bullish candle on weekly timeframe. Expecting new high and target or 68-70 by end of year or before.
If you like this idea, do share and boost. :)

Silver Eyes 45.00 as Traders Digest Fed Cut and Trade TruceSilver prices steadied as volatility and safe-haven demand supported prices. The Fed's recent 0.25% rate cut and the Trump-Xi trade truce provided limited fresh impetus, while easing lease rates in London suggested improved liquidity.
After hitting all-time highs earlier this month amid a short squeeze, silver's prices rebound reflect profit-taking and cautious positioning ahead of further macro cues.
XAGUSD retreated from recent highs and retested the breakout zone of the channel. The price is hovering near the 45.00 support, which aligns with the 50% Fibonacci retracement. If XAGUSD rebounds above 45.00 and breaks the 50.00 psychological resistance, the price may approach the swing high and 161.8% Fibonacci Extension at 54.20. Conversely, closing below 45.00 may prompt a deeper retracement toward the support at 43.00.
By Li Xing Gan, Financial Markets Strategist Consultant to Exness

Break + Bearish FlagA 4H bullish trend line break set the bias to Short
Then 1H Bearish flag break signals the entry for short
With SL at the 4H resistance
TP at the 4H trend line
Once price break the 4H LL then move SL to LH

Silver Analysis – 26 October 2025
- Silver broke support zone
- Likely to fall to support level 45.00
Silver recently broke the support zone between the support trendline from August, support level 48.00 and the 38.2% Fibonacci correction of the upward impulse from August.
The breakout of this support zone accelerated the active minor correction 2 of the extended impulse wave (3) from August.
Silver can be expected to fall further toward the next support level 45.00, the breakout of which can lead to further losses toward the round support level 40.00.

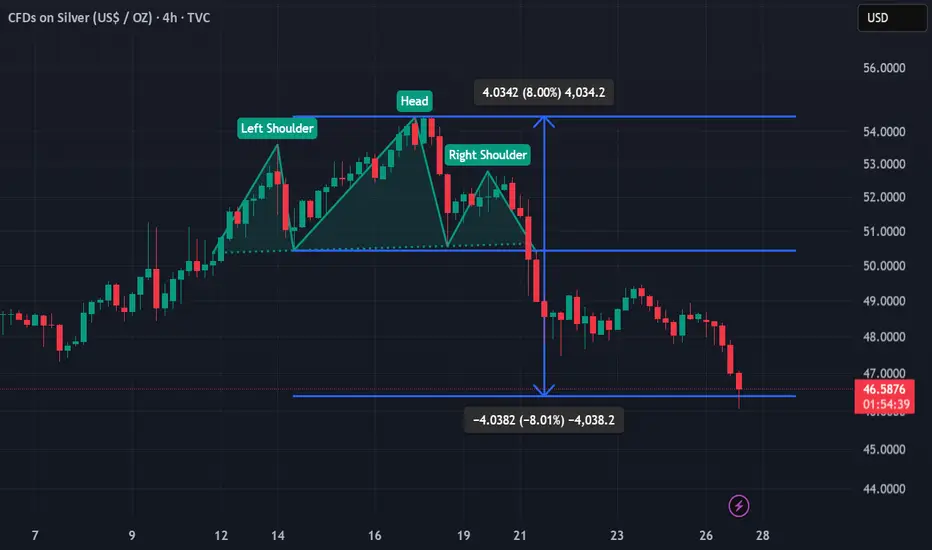
Silver/$XAUUSD Head and shoulders patternSilver bouncing off of the head and shoulder's pattern target zone around 46.5ish. will the price reverse from this point on?
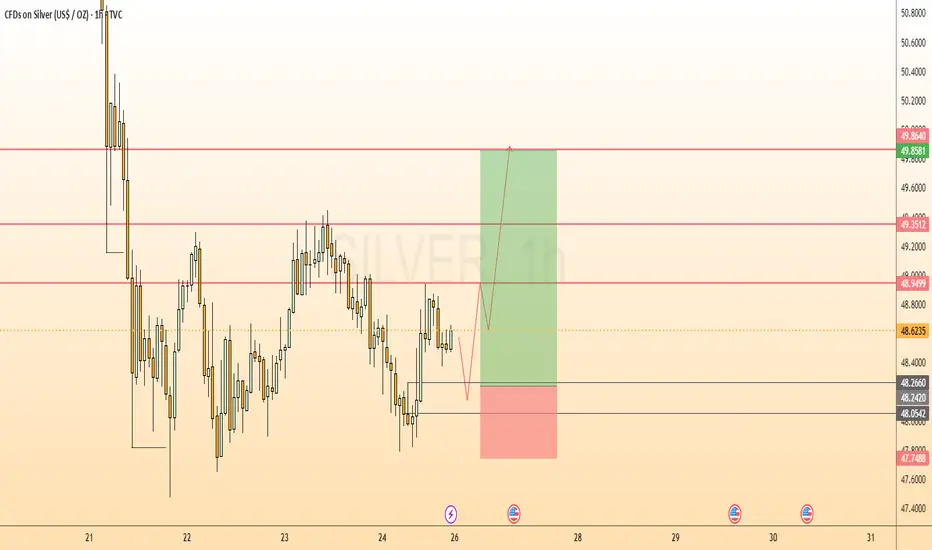
Silver Strategy Map — Thief Layers, Smart Targets, and Risk Zone📊 XAG/USD “Silver vs U.S Dollar” — Metals Market Wealth Strategy Map (Swing/Day Trade)
🔑 Plan: Bullish Setup
This setup follows the “Thief Strategy”, which means using layered limit entries to scale into the trade. Instead of going all-in at one level, we “steal the entries” across multiple layers.
💰 Layered Buy Limit Entries (Example Setup):
46.200
46.400
46.600
46.800
47.000
👉 You can increase layers as per your own plan and risk style.
🛑 Stop Loss (Protective Exit): 45.600
(This is my thief SL — but you’re free to adjust as per your own risk appetite.)
🎯 Target Zone: 49.000
⚠️ Around 49.300, we see a “Police Barricade” (heavy resistance + overbought conditions + potential trap).
That’s where profits should be taken — escape with gains before the trap closes!
Why This Setup?
Support Zones: Strong accumulation zones forming near 45.600–46.000.
Trend Bias: Silver remains bullish in the medium-term metals market outlook.
Layering Strategy Advantage: Reduces entry risk and allows better average fill.
Profit Zone: 49.000 aligns with strong supply area + RSI extension risk.
🔗 Correlation & Related Pairs to Watch
OANDA:XAUUSD (Gold vs USD): Gold often leads Silver’s moves — watch Gold for early signals.
TVC:DXY (US Dollar Index): A weaker USD usually boosts metals.
TVC:PLATINUM & CAPITALCOM:PALLADIUM : Industrial metals correlation — strong moves here can influence Silver sentiment.
TVC:SILVER Futures: Always track COMEX Silver contracts for volume confirmation.
✨ “If you find value in my analysis, a 👍 and 🚀 boost is much appreciated — it helps me share more setups with the community!”
📌 Disclaimer: This is a Thief-style trading strategy, created just for fun and educational sharing. Not financial advice — trade at your own risk.
#XAGUSD #Silver #Metals #TradingStrategy #SwingTrade #DayTrade #ThiefStrategy #Gold #DXY #Forex #Commodities
Very Risky!!2nd entry setup on Silver. Am not taking this trade on my accounts.
Just watching to see the setup plays out

Silver (XAGUSD): Possible buy setupSilver (XAGUSD): Possible buy setup. Plan is clear. I think this is SMT and there will be a huge amount of liquidity here. Let's see if I am right.
Cheers

SilverXAGUSD
- Completed " 12345 " Impulsive Waves
- Demand Zone
- Fibonacci Level - 50.00% / 61.80%
- RSI - Divergence
- Bullish Channel as an corrective pattern in Short Time Frame

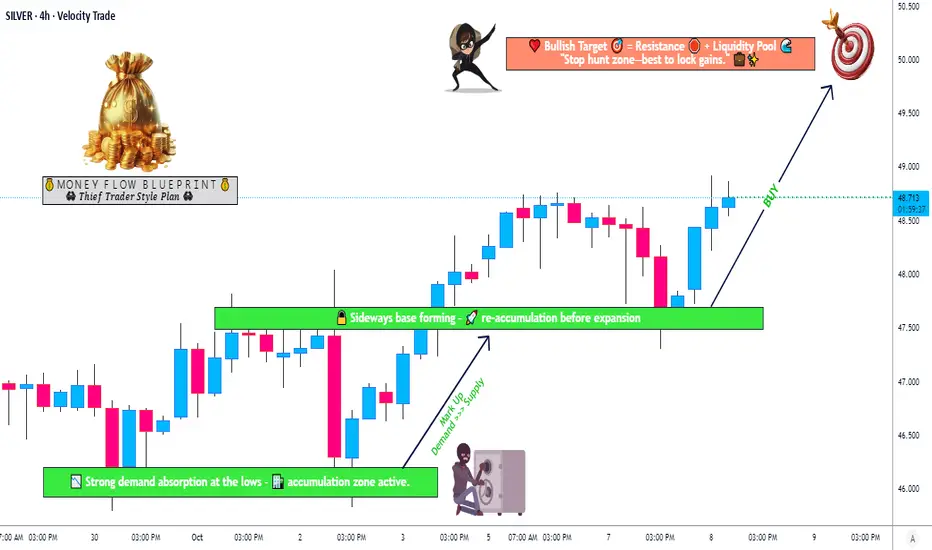
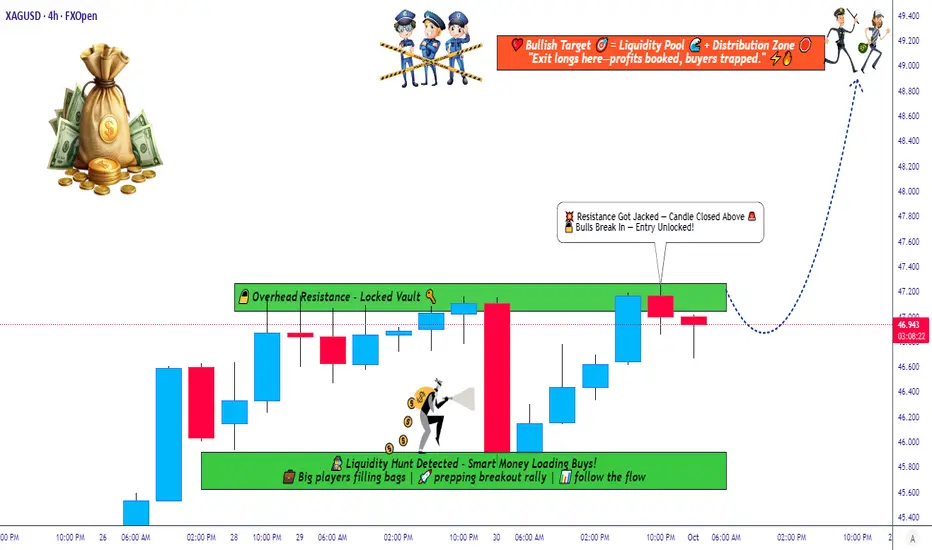
Silver Price Action Update – Smart Money Reaccumulation PhaseXAG/USD "SILVER vs U.S. DOLLAR" — Metal Market Cash Flow Management Strategy 💰
Thief Strategy | Layered Entry | Swing / Day Trade Plan
🧭 Plan Overview
The Bullish momentum in Silver (XAG/USD) has been confirmed through accumulation and re-accumulation phases, signaling a potential continuation move upward.
Smart money appears to be building positions below major resistance — time for us to follow the metal flow. ⚙️
💎 Entry Plan — Thief Layer Style
Thief Strategy = Layered Limit Entries 🧠
We use multiple limit orders to build a smarter position gradually — instead of chasing the price.
Entry Layers:
47.500
48.000
48.500
(You can add more layers based on your own plan and risk appetite.)
🛑 Stop Loss (SL)
This is the Thief SL @47.000.
However, dear Ladies & Gentlemen (Thief OGs) — please manage your own risk.
It’s your money, your strategy, and your exit. 💼
“Make money → Take money → Protect money.”
🎯 Target Zone
A strong resistance zone + overbought conditions may create a trap at the highs.
So, when Silver reaches around $50.000, be smart and secure your profits before the metal traps the late buyers.
Remember: we steal profits, not dreams. 🕶️
💬 Note from the Thief OG
This is a Thief-style strategy — meant for educational fun and insight sharing.
Not a signal service or financial advice.
Use your own judgment and always plan your risk ahead of your entries.
Let’s manage our cash flow, not our emotions. ⚖️
🌍 Related Pairs to Watch (Correlation Check)
OANDA:XAUUSD (Gold) → Often moves in sync with Silver; watch for Gold strength confirmation.
💵 TVC:DXY (U.S. Dollar Index) → Inverse correlation; a weaker USD supports Silver upside.
💰 OANDA:AUDUSD & OANDA:NZDUSD → Commodity-linked currencies; bullish moves support Silver’s strength.
OANDA:XCUUSD → Industrial metals correlation; when Copper rallies, Silver often follows.
Keep your eyes on these pairs — they reveal how liquidity shifts across the metals and forex markets.
✨ “If you find value in my analysis, a 👍 and 🚀 boost is much appreciated — it helps me share more setups with the community!”
⚠️ Disclaimer:
This is a Thief-style trading strategy — shared just for fun and educational purposes.
Always do your own research and trade responsibly. 🧩
#XAGUSD #SilverAnalysis #MetalsMarket #SwingTrade #DayTrading #TechnicalAnalysis #ThiefStrategy #LayeredEntry #CommodityTrading #SmartMoney #BullishSetup #TradingViewCommunity #MarketFlow #TradeResponsibly