Solana – Saucer Pattern & Key Resistance in FocusSolana is starting to stand out with notable relative strength versus both Bitcoin and Ethereum, and it's catching my attention this week.
✅ Key Support Holding:
Price recently held firm at the $185–$190 support zone, bouncing with strength and attempting to establish a higher low. If this level holds, it would further confirm the uptrend in place since April.
📉 Corrective Phase Since September:
Despite the pullback, the larger trend structure remains bullish. A break above the September high is still needed to confirm trend continuation.
🔵 Multi-Month Saucer Formation:
A rounded base is developing on the daily chart—a classic saucer bottom. If confirmed, this pattern points to major upside potential, with a projected move possibly targeting $500 over time.
⚠️ Watch This Zone Closely:
The $250–$260 resistance area is the key overhead level to clear. A decisive breakout here could trigger a strong rally and confirm the saucer breakout.
📌 Summary:
Solana is showing resilience, building a bullish structure, and forming a significant base. If momentum builds above $260, bulls may take control in a big way.
Trade ideas

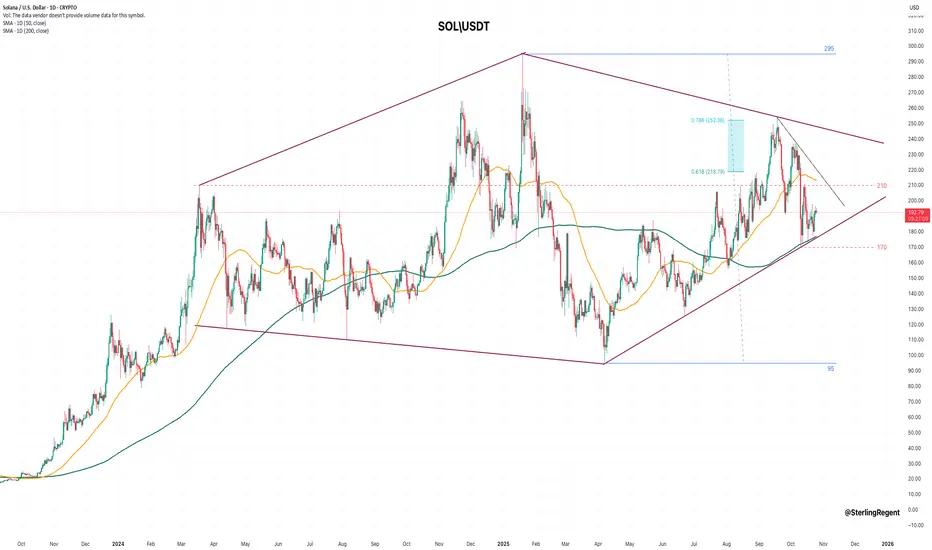
$SOL Solana is sandwiched between the nearly 4-year resistance level of 2021's ATH and the approaching 3-year uptrend.
A squeeze lasting this long typically ends not with a minor breakout but with a major blowout.

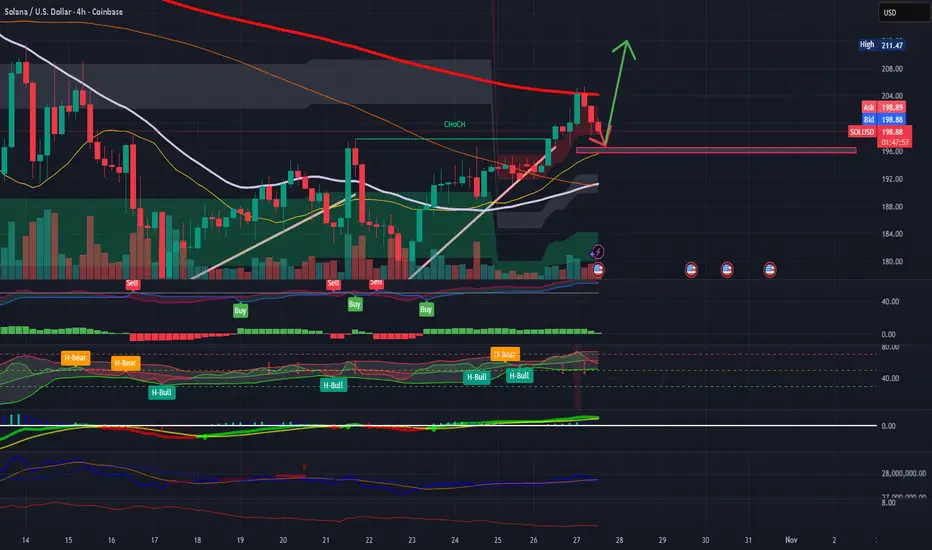
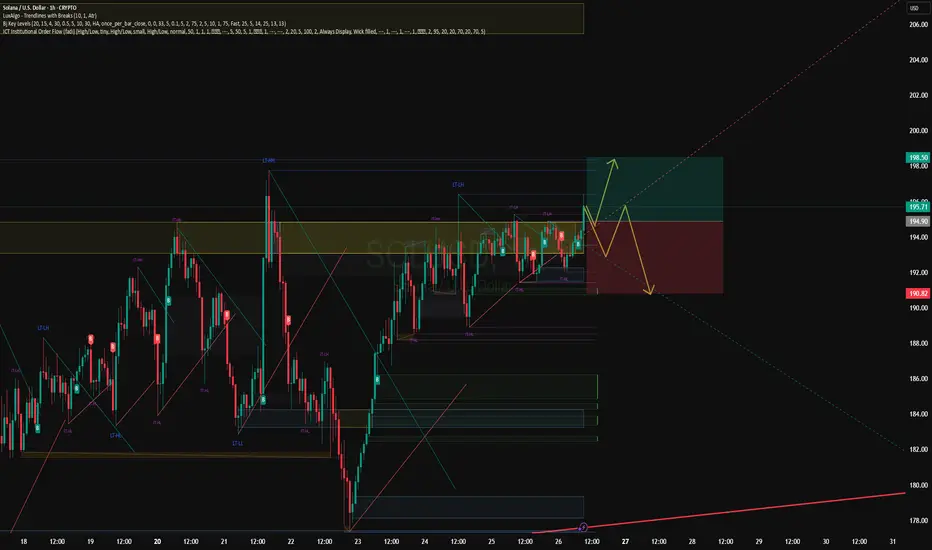
SOL/USD Short Term Wave (4) Dip Before Wave (5) Rally (1h-4h OutSolana is currently consolidating near $200–$205 after a strong impulsive move from the $177 base. On the 1H–4H timeframes, price action suggests that Wave (3) has completed, and the market is preparing for a short-term Wave (4) correction toward $195–$196.
This zone aligns with key confluences — 0.382 Fibonacci retracement, VWMA support, and a 1H demand/OB cluster. As long as SOL stays above $192, the bullish structure remains intact.
Once momentum indicators (RSI > 55 + QQE green) confirm support in that zone, a new Wave (5) expansion is expected, targeting $211–$219 within the next few days.
Scenarios:
Base Case: Controlled dip to $195–$196 → continuation to $211–$219 (Wave 5).
Invalidation: Daily close below $191.8 would neutralize the bullish count.
Bias: Bullish continuation after pullback
Timeframe: 1H–4H (Short- to mid-term outlook)
Next key levels: Support $195–$196 → Targets $211–$219
Bearish Pressure Builds Below $208FenzoFx—Solana's uptick momentum has been capped by the descending trendline, even though the price flipped above the $185.00 mark.
The daily chart shows long-wick bearish candles, indicating the selling pressure persists below the $208.00 resistance. From a technical perspective, the downtrend will likely resume if the price closes below the inverted fair value gap. In this scenario, SOLANA could decline toward the primary support at $172.00.
Please note that the bearish outlook should be invalidated if the price exceeds the $208.00 mark.

Cup and Handle pattern about to playout?A very possible scenario that could playout. All we need is some good news in this world: end of FED QT, more rate cuts and of course the tariff deal with China we have all been waiting for.
Important levels to look for for a breakout in this case are highlighted with green and of course the fib retracement drawn next to it.
If both breakouts are confirmed, then I think that $328 could become our new ATH in Q4 this year!
SOL: Unlocking 35% Upside in High-Performance BlockchainSOL: Unlocking 35% Upside in High-Performance Blockchain Amid ETF Momentum – SWOT and Intrinsic Value Insights
📊 Introduction
As of October 28, 2025, Solana (SOL) is navigating a post-ETF launch environment with oversold rebound characteristics. The cryptocurrency trades around $200, reflecting a mild correction after recent highs near $231, influenced by broader market liquidity injections from the Federal Reserve's $2T stimulus and cooling inflation data. Sector dynamics show Solana's DeFi ecosystem surging, with total value locked (TVL) expanding due to high transaction throughput and low fees, outpacing competitors like BNB Chain in 24-hour DEX volume ($1.47B vs. $1.3B). Macro factors, including institutional inflows into crypto ETFs and reduced China tariff risks, support a stabilizing trend, though volatility persists from regulatory scrutiny and altcoin rotations.
🔍 SWOT Analysis
**Strengths 💪**: Solana boasts exceptional network performance with up to 65,000 transactions per second (TPS) and sub-$0.01 fees, enabling scalable DeFi and NFT applications. Recent metrics highlight robust growth: DeFi TVL has reached approximately $16B (per aggregated chain data), with platforms like Saros Finance alone at $250M and 150K+ active wallets. Institutional adoption is evident through the Bitwise Solana Staking ETF (BSOL) launch, offering ~7% annual yield, and partnerships like Visa's USDC support. Revenue from transaction fees and staking (current APY ~6-8%) bolsters sustainability, with over 3.5M SOL held by corporate treasuries valued at $591M+.
**Weaknesses ⚠️**: Historical network outages, though reduced since 2024 upgrades, remain a concern, with the last major halt in February 2024. Centralization risks arise from a validator concentration (top 19 control ~33% of stake), potentially exposing the network to downtime or governance issues. Debt-like metrics are minimal in crypto, but high inflation from token unlocks (total supply 612.84M vs. circulating 549.7M) could dilute value if adoption lags.
**Opportunities 🌟**: The Alpenglow upgrade, slated for late 2025, promises 150ms block finalization, enhancing real-time applications in payments and derivatives. ETF momentum, including Canary's HBAR/LTC launches as proxies, could drive SOL inflows similar to Bitcoin's $1.5B ETF projections. Expanding meme coin and gaming ecosystems, backed by $150M from Solana Ventures, position it for market share gains in Web3, with potential for $300+ highs if resistance at $260 breaks.
**Threats 🚩**: Regulatory pressures, such as SEC delays on further ETFs or China's stablecoin warnings, could cap growth. Competition from Ethereum L2s (e.g., Arbitrum's 2.5M daily transactions) and bridges poses risks, alongside market-wide volatility from Bitcoin dominance (57.6%). Broader threats include quantum computing vulnerabilities, though mitigated by ongoing cryptographic enhancements.
💰 Intrinsic Value Calculation
Adopting a value investing lens for cryptocurrencies, we estimate Solana's intrinsic value using an adapted discounted cash flow (DCF) model based on network fundamentals, incorporating a margin of safety (20% discount). Key inputs from public data: TVL ~$16B, circulating supply 549.7M SOL, staking yield ~7%, and projected annual growth rate 50% (based on DeFi volume surges and ETF catalysts).
Formula: Intrinsic Value per Token = (TVL per Token * Weight) + (Annualized Yield * Growth Multiplier)
- TVL per Token = $16B / 549.7M ≈ $29.10 (weighted at 0.7 for core network value)
- Annualized Yield = 7% (weighted at 0.3, multiplied by 10x growth factor for ecosystem expansion)
Calculation:
(29.10 * 0.7) + (0.07 * 10) = 20.37 + 0.70 = 21.07
Scaled to market comparables (e.g., ETH's P/TVL ratio ~9.3 vs. SOL's current 6.8): Adjusted Intrinsic = 21.07 * 13 (blended multiplier for TPS advantage and adoption) ≈ $273.91
Apply 20% margin of safety: $273.91 * 0.8 ≈ $219.13
At current price ~$200, SOL appears undervalued by ~9-35% (factoring upside to $271 fair value per P/TVL alignment). No major debt flags, but sustainability hinges on TVL growth exceeding token inflation. 📈 Undervalued.
📈 Entry Strategy Insights
Institutional approaches favor identifying support zones around $180-190 (near 200-day SMA) for unleveraged, long-term entries via dollar-cost averaging (DCA). Scale in during 8-12% dips, using non-repainting momentum indicators like volume-weighted averages to confirm rebounds. Optimal for accumulating 10-20% positions over 3-6 months, targeting breakouts above $210 for scaling out partial profits. 🚀 Spot zones.
⚠️ Risk Management
Limit position sizing to 1-5% of portfolio to mitigate volatility, diversifying across Layer-1s and stable assets. Set trailing stops at 10-15% below entry (e.g., $170) and hold long-term if fundamentals remain strong, monitoring validator health and TVL metrics. Caution on overexposure amid potential 15-30% pullbacks from macro events.
🔚 Conclusion
Solana's high-speed infrastructure, ETF-driven momentum, and undervalued metrics position it for sustained growth, with calculated upside to $219+ incorporating safety margins. Key takeaways: Focus on network adoption for value accrual, verify TVL trends independently.
This is educational content only; not financial advice. Always conduct your own due diligence.
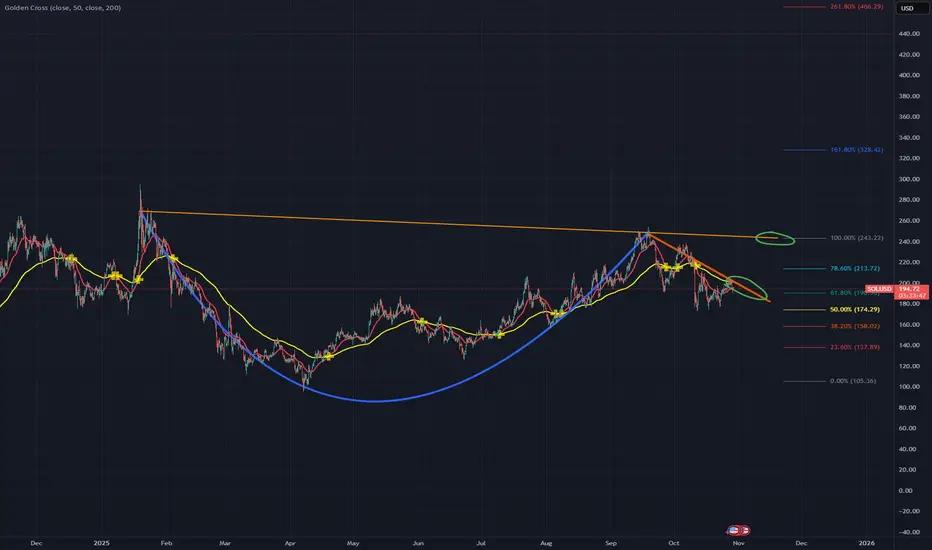
(b) Wave Retracement Almost CompleteEarlier, I had some concern that this (b) wave might be concluding too quickly relative to the preceding (a) wave.
While time symmetry isn’t a strict requirement in Elliott Wave analysis, there are moments when a pattern’s timing simply doesn’t pass the “smell test.”
Now, however, we’re seeing price retrace higher in a manner that better aligns with the duration of wave (a). With price currently sitting just below the (b) wave target box, I’m expecting it to enter that zone imminently to complete this (b) wave retracement.
A subsequent move to a new local low will serve to confirm my analysis.

SOLANA (SOLUSD): High Chance for a Rise
There is a high probability that Solana will continue rising
after a confirmed breakout of a key daily resistance.
The next key structure is 208.8 level.
I think it will be reached soon.
❤️Please, support my work with like, thank you!❤️

Where the rally starts - SOL weekly update Oct 28 - 03rdAfter a pretty enduring phase of complex corrective movement, Solana presents itself with impulsive bullish structure today.
As I said in my Ethereum analysis, the macro environment seems to be very bullish with rate cuts and a tariff deal between the United States and China may be incoming. So with that said, I think the upside opportunity in mid- to long-term could be large.
But for short-term, the current market structure looks similar to Ethereum as we are unfolding a rather complex intermediate wave 2. For now therefore, I expect Solana to drop to around $182.10. This scenario is supported by the liquidation heatmap as it shows liquidity built up throughout the latest move up. Indicators like the RSI already showed overbought prices by the end of the move up, which is untypical early for a starting third wave. Not to forget the overall structure being rather slow whilst moving up, which also doesn't fit in the impulsive characteristics of the third wave. So the alternative would be, that this is the third wave, but as I said I think this is very unlikely for me.
Overall Solana provides us a short setup. If you want to take that trade I recommend putting the stop loss at the latest local high or one percent above if you want to be sure and the take profit at the 0.764 retracement level.

Bullish or Bearish for Solana? give me your opinions here these are the levels I have considered for solana future price. what is your opinions.
and also, share your targets frens 👇

SOL at resistance, has work to doCRYPTOCAP:SOL is at major resistance High Volume Node just below the daily pivot.
The local trend has flipped bullish but a strong move may not be on the cards until we climb the wall of worry through resistance. Price is riding the daily 200EMA.
Daily RSI did not print bullish divergence or reach oversold.
Safe trading

$SOL Bullish Engulfing Weekly CloseSolana is looking good here 👍🏽
Reclaimed the 50WMA and closed above the 50% Gann Level.
Note the Bullish Engulfing candle for the Weekly Close.
However CRYPTOCAP:SOL Still trading within the DANGER ZONE ⚠️
Need these next couple weeks to close outside of this POI.
You can see the Liberation Day lower trendline still remains intact for support and we had the Bullish Cross a few weeks ago on the 20 / 50 WMA 🤓

SOLUSD | Approaching Major Resistance LevelSOL/USD is rising towards the sell entry, which is an overlap resistance and could reverse from this level to the downside.
Sell entry is at 198.22, which is an overlap resistance.
Stop loss is at 206.24, which is a swing high resistance that aligns with the 138.2% Fibonacci extension.
Take profit is at 187.02, which is an overlap support.
Stratos Markets Limited (tradu.com ):
CFDs are complex instruments and come with a high risk of losing money rapidly due to leverage. 68% of retail investor accounts lose money when trading CFDs with this provider. You should consider whether you understand how CFDs work and whether you can afford to take the high risk of losing your money.
Stratos Europe Ltd (thttps://tradu.com/eu ):
CFDs are complex instruments and come with a high risk of losing money rapidly due to leverage. 70% of retail investor accounts lose money when trading CFDs with this provider. You should consider whether you understand how CFDs work and whether you can afford to take the high risk of losing your money.

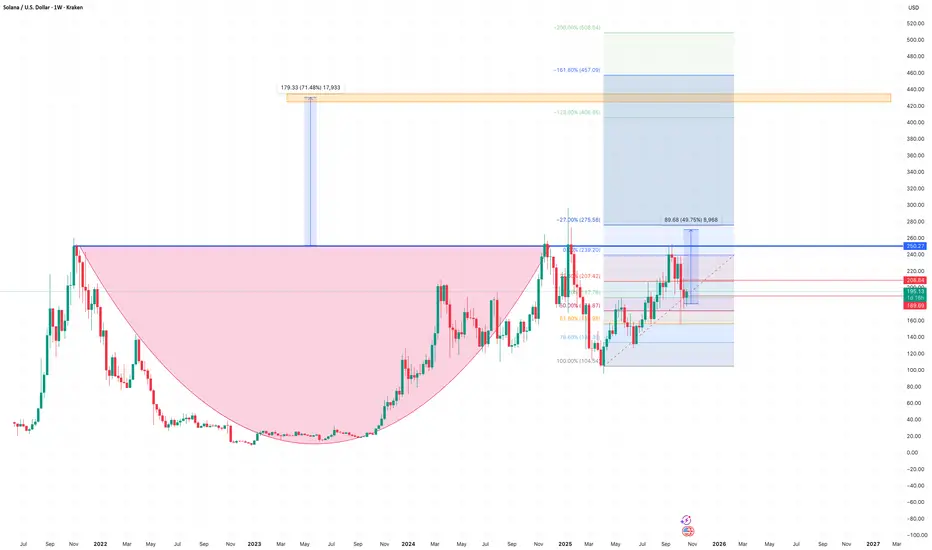
Sol Ready For One More Rip or Bear Market?After a little over 1000days of upward trend and LONG consolidation SOl seems to be reaching a decsion point.
Looking at the weekly if the market continues to rise the cup and handle tends to produce a 1.5-2x the handle. With continued upward action a 1.5 expansion of the range should be expected to end the $500 area.
Considering the average range size forming repeatedly on the macro and if the trend holds with continued market rise one more rip may be in order
Trade Well....
Your Friend,
Degen

SOLUSDT ForecastSOL is maintaining a strong bullish structure, trading above the ascending trendline after breaking out from the previous descending channel. Price is currently retesting the 198–200 resistance zone, showing signs of consolidation before a potential continuation move. A successful retest of the trendline and demand zone could trigger an upside push toward the next target around 205.43, confirming bullish momentum continuation.
"Thank you for your support! If you found this idea valuable or learned something new, please consider liking and leaving a comment. I’d really appreciate hearing your feedback and thoughts."

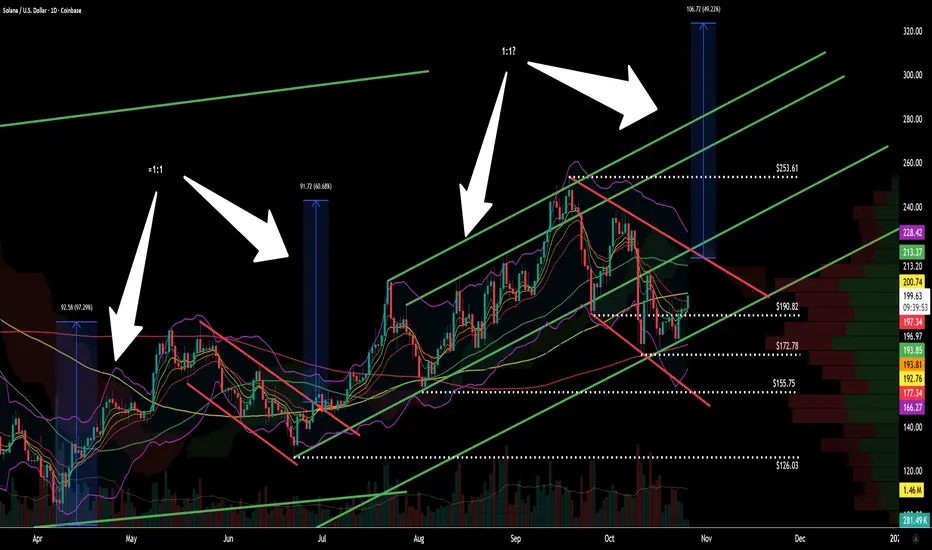
$SOL – Dual Bull Flags & Parallel Channel StructureSince the April lows across both equities and crypto markets, CRYPTOCAP:SOL has been one of the standout performers, printing a powerful bullish trend structure defined by two major bull flags — each followed by significant measured-move extensions.
Phase 1 – The First Bull Flag
The first rally delivered a 97% gain, followed by a 30% retracement, forming a textbook flag structure.
After a clean breakout and retest of the upper trendline in late June, Solana launched into a 60% measured move, aligning closely with a ≈1:1 projection of the initial flagpole.
This breakout confirmed strong underlying momentum, accompanied by increasing volume and trend confirmation across the broader crypto space.
Phase 2 – The Second Flag Formation
The breakout from the first flag initiated a second 100% run, moving from $126-$253, before undergoing another 30% retracement down to $172.
This pullback mirrors the previous structure almost perfectly, consolidating within another bull flag as the market digests gains.
Currently, price is holding above $190, sitting just beneath the upper flag boundary. The consolidation remains healthy, and if momentum continues to build within this pattern, a volume-backed breakout could lead to a retest of the upper trendline and continuation toward higher levels.
Trend Channel & Structure
The broader move from early June forms a dual-trendline bull channel, where both sets of parallel trendlines are aligned near a 45° slope. This structure reinforces the bullish bias, showing consistent rhythm between impulses and corrections — a strong sign of a well-organized uptrend rather than random volatility.
The pattern also shows proportional price swings, with both measured moves (~1:1) maintaining the same amplitude, suggesting institutional order flow and algorithmic consistency.
Key Levels to Watch
Level Significance
$253.61 Flag target & prior swing high
$213–$214 Local resistance cluster
$190.82 Current support zone (holding above)
$172.78 30% retrace support
$155.75 / $126.03 Structural supports / prior flag bases
A confirmed close above $213–$214 on rising volume would be the first signal that the breakout is underway. Failure to hold $190 would risk extending the flag lower toward the $172 zone.
Measured Move & Projection
If the breakout mirrors the first flag’s performance, a measured move equal to the previous flagpole projects a potential target near $323 — aligning with the upper bound of the extended bull channel.
That projection maintains symmetry with previous rally amplitudes (97%, 60%, ~100%), further validating the trend continuation scenario.
Technical Summary
✅ Trend: Bullish (higher highs & higher lows)
✅ Pattern: Dual bull flags within rising parallel channel
📊 Momentum: Strong; price holding above 8/13 EMA cluster
⚙️ Support: $190 → $172 → $155
🎯 Target: $323 (1:1 projection from current flagpole)
🔍 Trigger: Breakout above top trendline on increased volume
Final Notes
CRYPTOCAP:SOL remains technically one of the strongest large-cap crypto charts — clean structure, repeatable patterns, and consistent retracement depth between impulsive legs.
While short-term volatility is expected inside the flag, the 45° upward channel and consistent measured-move behavior keep the medium-term bias bullish through Q4.
As always, volume confirmation will be key, a breakout supported by expanding participation could mark the start of the next leg toward $323.
For educational and technical analysis purposes only.
Solana (SOL): Wave 5 Starting or Set to Crash?Solana (SOL): Wave 5 Starting or Set to Crash?
Weekly Scenarios
Bullish scenario: SOL holds support at ~$197, then breaks through ~$260.83 → possible rise to ~$300+.
Consolidation: The price trades in the ~$197–$260 range without a clear direction, preparing for momentum.
Bearish scenario: A breakout below ~$183 with volume → possible correction to ~$174 and below.
✅ Conclusion
Weekly analysis shows: SOL is at a crossroads.
A hold of support near ~$197 and a break of resistance at ~$260.83 could trigger a new uptrend.
However, a breakout below ~$183 significantly increases the risk of a correction.
Monitor the wave structure, volatility levels, and volume confirmation before choosing a strategy.
SOLANA stable, but only for now.SOL - major move is loading. I know, ppl hate it, as well as I, but imo the break will be down of 170 below, not to the upside. It's pretty calm for the time being - enough to prepare.
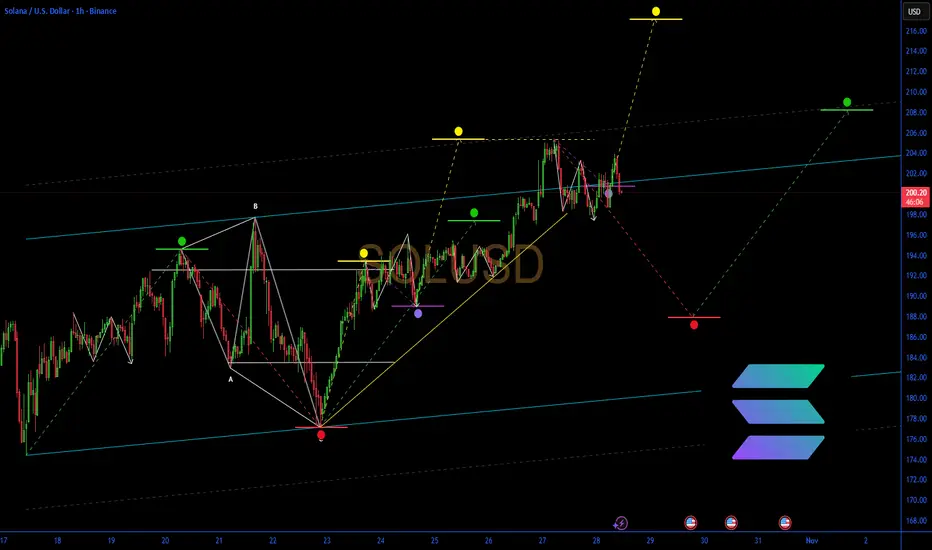
SOL/USD – Possible Bullish Reversal Loading!Solana looks ready for a potential breakout after consolidating within a key demand zone! 👀
🟩 Key Support Zone: $176 – $185
This green area has acted as a strong accumulation zone multiple times — buyers continue to defend it aggressively.
🔵 Mid-Level Support: $181.25
Price recently retested this level and is showing signs of bullish strength above it.
🟥 Major Resistance Zone: $215 – $225
This red supply zone is the next key target. If bulls maintain momentum, a breakout here could confirm a full bullish reversal.
📊 Current View (1H timeframe – Coinbase)
After several rejections and liquidity sweeps below the $180 level, SOL seems to be forming a higher low — a classic bullish structure.
If the price holds above $190, I expect a push toward the $220 area in the coming days.
🧠 Trade Idea (Not Financial Advice):
✅ Long entry: above $190–$192 confirmation
🎯 Targets: $205 → $220
❌ Stop Loss: below $181
🔥 Sentiment: Bullish bias — as long as SOL holds above $181
⚡ Watch out: High-impact news events could trigger short-term volatility.

Solana - We have to see new all time highs!🚀Solana ( CRYPTO:SOLUSD ) has to break out:
🔎Analysis summary:
Over the course of the past couple of months, Solana has been rallying another +100%. This rally ultimately resulted in another, third retested of the previous all time high. And if Solana now creates bullish confirmation, we can all expect new all time highs very soon.
📝Levels to watch:
$250
SwingTraderPhil
SwingTrading.Simplified. | Investing.Simplified. | #LONGTERMVISION

SOLUSD: Key 175 Support in Focus After 198.5 Rejection
SOLUSD is currently consolidating in a range, facing a pullback after being rejected by the 198.5 current resistance level.
For the bulls to regain control, the price needs to break and hold above the 198.5 resistance, which would set the stage for a move towards the 200 to 205 key resistance zone.
The current bearish pressure suggests that a retest of the 175 current support level is likely in the short term.
A breakdown and close below the 175 support would be a significant bearish development, potentially sending the price down to the 160 to 165 key support zone.
Disclaimer:
The information provided in this chart is for educational and informational purposes only and should not be considered as investment advice. Trading and investing involve substantial risk and are not suitable for every investor. You should carefully consider your financial situation and consult with a financial advisor before making any investment decisions. The creator of this chart does not guarantee any specific outcome or profit and is not responsible for any losses incurred as a result of using this information. Past performance is not indicative of future results. Use this information at your own risk. This chart has been created for my own improvement in Trading and Investment Analysis. Please do your own analysis before any investments.

SOLANA LONG TERM WOLFE WAVEThe Wolfe Wave is a trading pattern used to predict price reversals and emerging trends. It consists of five waves that form a specific structure, indicating potential breakout or breakdown points.
Waves 1-3-5 these points highlight the main trend, with wave 5 being the potential reversal point.
Waves 2-4 these act as counter-trend corrective waves, setting the boundaries for the pattern.
Projected Line a line drawn from point 1 through point 4 predicts the breakout level after wave 5, known as the "sweet zone"
Trading Strategy traders look for entry around wave 5 with an exit strategy aligned with the projected line, expecting price movement in the direction indicated by the pattern.
