SOL/USD – Weak Below SMA200🔴 SHORT under $212 – target $205
Solana trades at $210, capped far below SMA200 ($217.6). Resistance at $217–221, support at $205. RSI at 47, neutral but unable to recover momentum. Trend remains bearish while under $217.
📖 Keywords: #SOLUSD #Solana #Altcoins #CryptoBearish
SOLRLUSD trade ideas

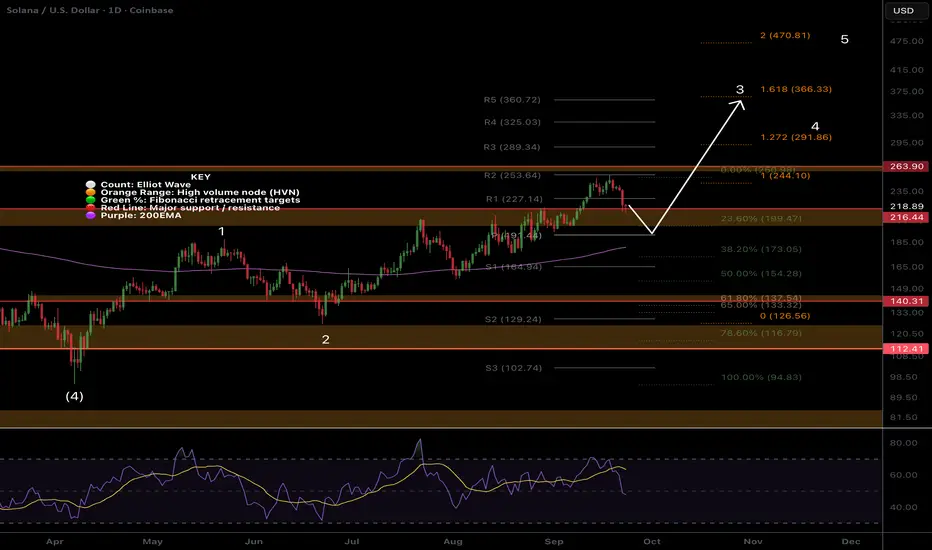
SOL Rejected at all time high! Whats next?Local Analysis / Targets / Elliot Wave
Solana attempted to break into price discovery but was rejected harshly back to the High Volume Node support trapping new traders and investors with the all time high excitement. Wave 3 appears to be underway with a minimum target of $365 the 1.618 Fibonacci extension and R5 daily pivot. Wave 3 pull backs should be shallow.
Continued downside bring up the ascending daily 200EMA and 0.382 target of $173. RSI is at the EQ and crossed bearishly.
Standard Deviation Band Analysis
Solana continues in the expected range just above fair value. Its attempts to break through the SD+2 threshold continue to thwarted but the next attempt will be number 4, the higher probability breakout!
Safe trading
SOLUSD H4 | Bearish dropSOL/USD is rising towards the sell entry which is a pullback resistance and could reverse from this level to the downside.
Sell entry is at 230.926, which is a pullback resistance.
Stop loss is at 250.04, which is a swing high resistance.
Take profit is at 201, which is a pullback support that is slightly below the 61.8% Fibonacci retracement.
High Risk Investment Warning
Trading Forex/CFDs on margin carries a high level of risk and may not be suitable for all investors. Leverage can work against you.
Stratos Markets Limited (tradu.com ):
CFDs are complex instruments and come with a high risk of losing money rapidly due to leverage. 65% of retail investor accounts lose money when trading CFDs with this provider. You should consider whether you understand how CFDs work and whether you can afford to take the high risk of losing your money.
Stratos Europe Ltd (tradu.com ):
CFDs are complex instruments and come with a high risk of losing money rapidly due to leverage. 66% of retail investor accounts lose money when trading CFDs with this provider. You should consider whether you understand how CFDs work and whether you can afford to take the high risk of losing your money.
Stratos Global LLC (tradu.com ):
Losses can exceed deposits.
Please be advised that the information presented on TradingView is provided to Tradu (‘Company’, ‘we’) by a third-party provider (‘TFA Global Pte Ltd’). Please be reminded that you are solely responsible for the trading decisions on your account. There is a very high degree of risk involved in trading. Any information and/or content is intended entirely for research, educational and informational purposes only and does not constitute investment or consultation advice or investment strategy. The information is not tailored to the investment needs of any specific person and therefore does not involve a consideration of any of the investment objectives, financial situation or needs of any viewer that may receive it. Kindly also note that past performance is not a reliable indicator of future results. Actual results may differ materially from those anticipated in forward-looking or past performance statements. We assume no liability as to the accuracy or completeness of any of the information and/or content provided herein and the Company cannot be held responsible for any omission, mistake nor for any loss or damage including without limitation to any loss of profit which may arise from reliance on any information supplied by TFA Global Pte Ltd.
The speaker(s) is neither an employee, agent nor representative of Tradu and is therefore acting independently. The opinions given are their own, constitute general market commentary, and do not constitute the opinion or advice of Tradu or any form of personal or investment advice. Tradu neither endorses nor guarantees offerings of third-party speakers, nor is Tradu responsible for the content, veracity or opinions of third-party speakers, presenters or participants.

Solana will be king again. Solana's fate will be decided this summer. The only coin rising in a giant triangle will either go to $ 400 or leave us like ETH. 274 and then $ 400 is very likely.

SOLUSDT ShortedWe saw a free fall for SOLUSDT, which can touch around 210-20,5, taking a short position with a risk of 10$ and RR of 1:4. Risk Management is more important than trading RM first trading next

Sol analysis Hi traders as you can see we are in uptrend I've been moving with it n counter the pull backs,my target remain 300,look for entry from 198 to 210 with a liquidation of 180 for possible 300 n new ATH as always you know we dont control the market by that we risk responsibly n use proper money management i wish you all the best Q4 is around the corner buy each n every dips.
Solana Double Top Pattern, is the bottom in?Solana performed a pretty solid Double Top Pattern, even if it was within a relatively small timeframe.
Is the bottom in?
Solid Longs can be made from here, tight SL at 210 if you are shaky, 200 if you are solid.
Not FA. DYOR. This is for educational purposes only.

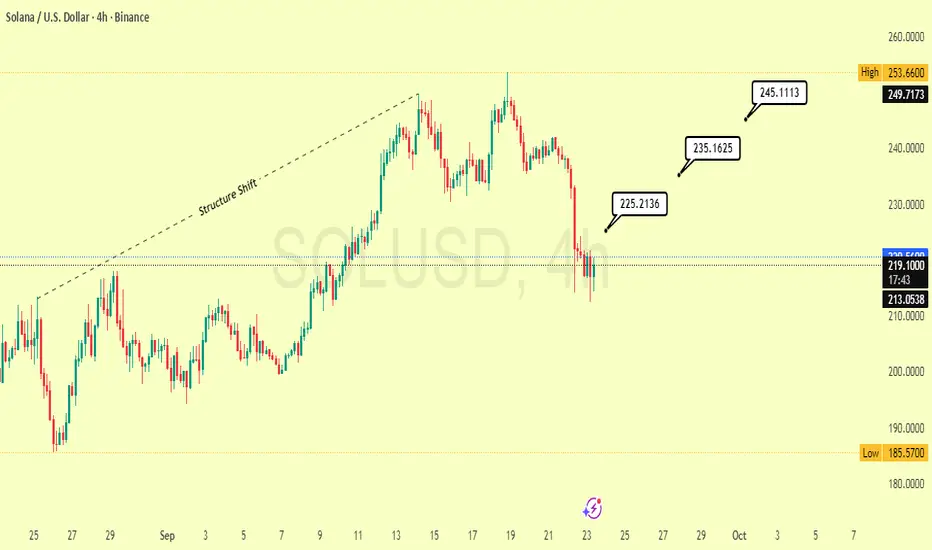
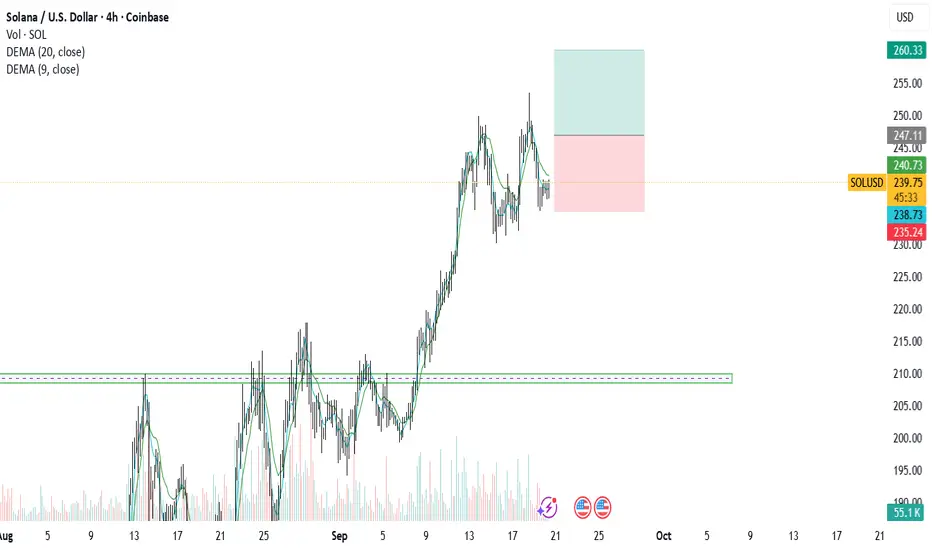
Solana Dips Into Key Demand Zone,Is the Next Explosion Brewing?Upon dissecting Solana’s (SOL) structure on the 4-hour timeframe, it’s evident that — right on cue — the asset initiated a healthy pullback , retracing into the *critical \$220 demand region*. As anticipated, *buy-side interest was promptly reignited*, and SOL is now hovering near the **\$219 mark*, signaling early signs of a potential reversal.
💡 Should this *support floor* hold firm, we may very well be witnessing the *calm before the bullish storm*. The groundwork is being laid for a potential *impulsive leg upward*, with near-term resistance levels — or shall we say *bullish milestones* — lining up at:
Levels to See :
📍 $225* – Initial resistance / minor liquidity pocket
📍 $235** – Mid-range breakout confirmation
📍 $245** – Macro continuation zone
📈 The current setup screams *accumulation* — and if momentum aligns, SOL could be gearing up for a fresh rally leg that catches many off guard.
🙏 If you value this insight, smash that *like* button and drop a *comment* to let me know your thoughts! Let’s spark a discussion — is SOL preparing for liftoff, or is more downside lurking?
With respect,
SmartEdgeTrading
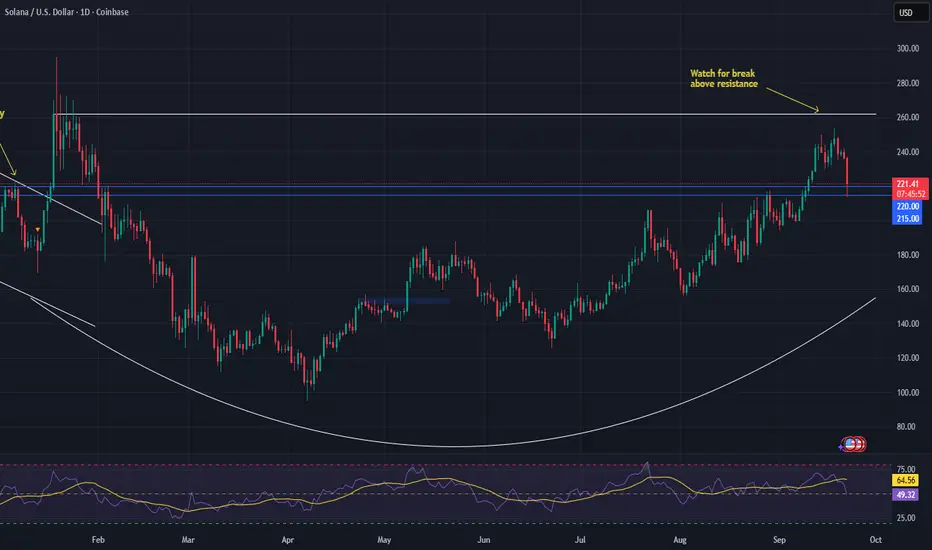
SOLANA (SOL) – Major Breakout Setup BrewingSolana is showing one of the cleanest technical setups in the DeFi space right now. The daily chart reveals a textbook saucer formation, a pattern that often precedes strong upside moves.
🔍 Key Levels to Watch:
• Support: $215–$220 – This zone must hold to keep the bullish structure intact.
• Breakout Zone: $250–$260 – A close above this range confirms the saucer breakout.
• Target: $480–$500 – Based on the pattern’s depth and duration.
The path of least resistance is up, and with altcoin sentiment turning bullish again, this could be a precursor to alt season.
📈 Monitoring closely for a confirmed breakout.
#Solana #SOL #Altcoins #CryptoTrading #DeFi #ChartPatterns #TechnicalAnalysis #CryptoSetup #Altseason
CRYPTO FORECAST SEPT 2025The crypto market looks like it could be approaching a short-term top, and a roll over to the downside may be close. In this video I share my forecast for total market cap, Bitcoin (BTC), Ethereum (ETH), XRP, and Solana (SOL).
I also talk through a potential XRP entry I’m watching closely, and why this could be one of the last good opportunities to position into altcoins before the next move down.
Here’s what I cover:
- Total market cap structure and liquidity levels
- BTC and ETH outlook for the week ahead
- SOL technicals and what I’m watching
- XRP entry levels and trade plan
👉 Do you think crypto is topping out here, or will we push higher first? Let me know in the comments.
#Crypto #Bitcoin #Ethereum #XRP #Solana #ICTTrading #CryptoAnalysis
Stay tuned — this is NOT financial advice, just my analysis. Always do your own research before trading.

Monthly Crypto Analysis: Solana (SOLUSD) – Issue 92 The analyst believes that the price of Solana will increase within the time specified on the countdown timer. This prediction is based on a quantitative analysis of the price trend.
___Please note that the specified take-profit level does not imply a prediction that the price will reach that point. In this framework of analysis and trading, unlike the stop-loss, which is mandatory, setting a take-profit level is optional. Whether the price reaches the take-profit level or not is of no significance, as the results are calculated based on the start and end times. The take-profit level merely indicates the potential maximum price fluctuation within that time frame.
Analyzed by: Ehsan Pedram (Moonrise)

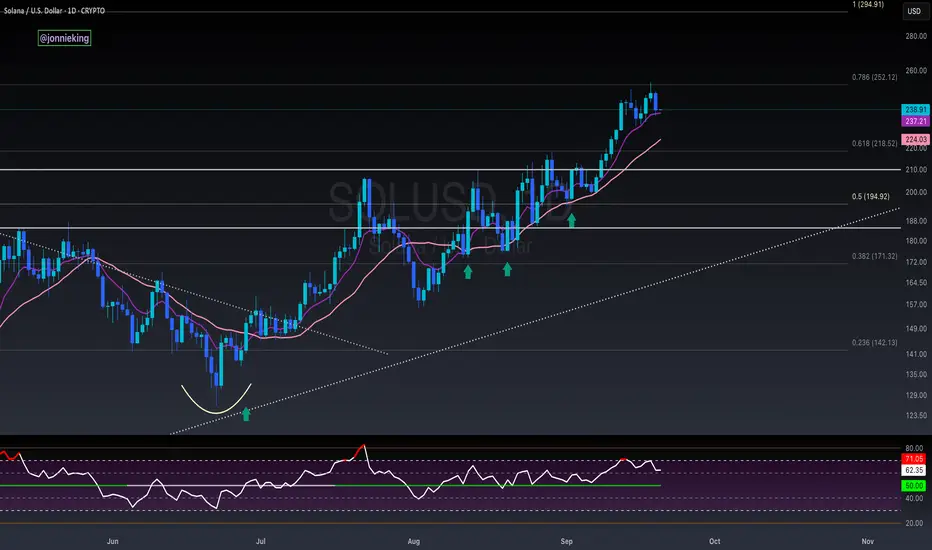
Solana's short-term pullback resets Overbought RSISolana's 1st attempt to break out from the $252 Multi-year resistance failed and triggered a short-term bearish reaction, causing the price to fall all the way to $213.87. A long wick was created due to a quick bounce from $213.87; it is also showing good support on the Fib .618 ($220.49) level.
The pullback also resets the overbought RSI of Solana, which is a healthy move, seeing it as an opportunity to gather strength for another leg up. The over-extended MA20 has also crossed the daily candle, showing another sign of good retracement gearing for another bounce.
The weekly cup-and-handle pattern was still intact, targeting a measured move of $520.
From a fundamental perspective, given that Solana has institutional adoption and pending ETF approvals in October 2025, Solana is still considered highly undervalued.

solana x binance coin Solana follow it Binance Coin on its journey to $1k
CRYPTOCAP:SOL vs. CRYPTOCAP:BNB

$SOL Maintains Uptrend With Daily CloseIgnore the noise.
CRYPTOCAP:SOL is still very much in an uptrend and has closed the day above the 9EMA.
Bulls need to maintain this, otherwise a retest of the 20MA ~$224 will be retested.
Signal Breakout as SOL Targets ATH and $300+Solmate’s $300M Launch in the UAE Sparks Solana Treasury Wave: Institutions Signal Breakout as SOL Targets ATH and $300+
The Solana ecosystem is entering a critical new phase of institutional adoption and capital formation, with multiple catalysts converging to form one of the strongest bullish narratives in crypto today. The headline development: Solmate has launched with a $300 million mandate to establish a Solana-focused treasury in the United Arab Emirates. This move, paired with growing institutional interest, potential ETF approvals, and increasingly favorable technicals, has set the stage for a potential breakout rally. Some market participants now see a credible pathway to $300+ for SOL, while others point to new all-time highs as fundamentals and momentum align.
This piece explores the strategic implications of Solmate’s treasury launch, the growing momentum behind Solana among institutions like Forward Industries, the macro tailwinds surrounding ETF approvals, and the technical structure that supports a bullish continuation. We’ll also assess the potential risks, the role of on-chain growth, and how the UAE’s regulatory and capital environment could accelerate Solana’s trajectory.
Solmate’s $300M UAE Treasury: Why It Matters
Solmate’s $300 million capital pool dedicated to establishing a Solana treasury in the UAE is more than a headline number—it’s a signal that institutional-grade asset management for crypto-native assets is globalizing beyond traditional finance hubs. The UAE, and particularly Abu Dhabi and Dubai, have positioned themselves as crypto-forward jurisdictions with clear regulatory sandboxes and proactive frameworks. Establishing a Solana treasury there creates:
• A regional liquidity hub: Concentrating capital in a friendly regulatory environment can improve market depth for SOL and Solana-native assets during aggressive expansion phases.
• Institutional standardization: A treasury framework can adopt disciplined risk controls, custody standards, and transparent rebalancing strategies, making it a template for other funds and corporates to emulate.
• On-ramp for Middle Eastern capital: Sovereign wealth funds, family offices, and regional asset managers have shown interest in digital assets. A Solana-focused treasury in the UAE lowers friction for capital allocation.
•
Mechanics of a Solana Treasury
Treasury operations are more than passive holdings. They typically involve:
• Core SOL accumulation: A base allocation that reflects long-term conviction in network value capture, staking yields, and governance.
• Liquidity provisioning: Deploying assets in DeFi protocols, AMMs, and order books to enhance liquidity and earn fees, subject to risk controls.
• Staking strategies: Validator diversification, slashing protection, and yield optimization through auto-compounding and programmatic rebalancing.
• Venture and ecosystem exposure: Strategic allocations to Solana-native projects, tokens, real-world asset (RWA) initiatives, and infrastructure plays (or via index-like baskets).
• Hedging overlays: Options and perp hedges to manage drawdowns while maintaining directional exposure.
By anchoring these flows in the UAE, Solmate not only signals conviction; it operationalizes a repeatable structure that can absorb larger institutional checks as compliance frameworks and counterparties mature.
Forward Industries Bets Big on Solana
Forward Industries’ publicized pivot toward SOL underscores a broader shift: institutions are no longer simply “diversifying” into Solana—they are actively rotating into it as a core position. The drivers include:
• Performance-to-throughput ratio: Solana’s execution environment continues to deliver high throughput and sub-second finality with low fees, supporting consumer-grade applications such as payments, on-chain order books, and gaming without UX compromise.
• DePIN, payments, and consumer apps: From real-time order execution to growth in tokenized assets and payments rails, Solana’s app layer is demonstrating product-market fit in areas where latency and cost matter.
• Developer momentum: Tooling, runtimes, and TypeScript-centric development are attracting teams that want to ship quickly with rich UX. Growth in Saga and mobile-focused experiments adds tailwind.
• Liquidity concentration: As more capital pools into SOL pairs and Solana’s native DEXs, slippage decreases and the market becomes more attractive for block-sized orders.
The “buying frenzy” moniker stems from combined flows across centralized exchanges, on-chain wallets, staking platforms, and prime brokers. Institutional trade sizes are up, and block liquidity providers report rising interest for SOL borrow and cross-margin facilities—both signposts that levered directional exposure and basis trades are heating up.
The ETF Wave: SEC Approvals Could Reshape Flows
A critical macro catalyst is the likelihood of multiple ETF approvals in the coming months. While much of the focus has been on Bitcoin and Ethereum, the structural changes triggered by ETF adoption—standardized custody, audited NAV calculations, and regulated market-making—create spillover effects across large-cap crypto assets.
Here’s why ETF approvals matter to Solana:
• Legitimacy funnel: When institutions obtain board approvals for crypto exposure via ETFs, internal compliance friction declines. From there, investment committees often explore other large-cap crypto assets with similar liquidity and adoption—enter SOL.
• Portfolio construction: Multi-asset crypto strategies reweight based on momentum, liquidity, and correlations. If BTC and ETH ETF flows stabilize, allocators often diversify into high-beta assets with compelling adoption narratives—again, SOL is a prime candidate.
• Derivatives market deepening: ETF market-making expands basis, options, and hedging activity. Robust hedging tools lower the barrier to building large SOL positions.
Even if a Solana ETF is not immediately approved, the institutional infrastructure and behavioral changes catalyzed by BTC/ETH ETFs provide a clear path for capital to migrate into SOL through other compliant vehicles.
Technical Structure: SOL Aligns for a Breakout
From a technical perspective, SOL’s setup reflects several bullish elements frequently observed in assets that break into new cyclical highs:
• Higher lows and a strong weekly structure: Persistent higher lows on the weekly timeframe suggest bid support from larger accounts. Breakouts from multi-month accumulation ranges often lead to trend extensions.
• Volume confirmation: Rising volume on up weeks and muted sell volume on retracements indicate absorption by patient buyers. This is often a hallmark of institutional accumulation.
• Moving average alignment: When the 50-day and 200-day moving averages turn up in tandem and compress beneath price, they function as dynamic support. Golden cross conditions on high timeframes historically reinforce trend persistence.
• Momentum oscillators: Constructive RSI behavior (staying in bullish regimes, respecting 50-55 on pullbacks) supports the case for sustained upside. MACD crossovers above the zero line add confirmation.
• Market structure breaks: If SOL clears prior supply zones with strong breadth in Solana ecosystem tokens, it often precedes a sharp expansion leg.
From a pure charting lens, the path to retest the all-time high (ATH) becomes plausible once prior resistance shelves are flipped to support with convincing retests. The next leg can extend if funding stays balanced and derivatives don’t overheat.
Why $300+ Is on the Table
Calling specific price targets in crypto is always probabilistic, but the $300+ scenario reflects a confluence of factors:
• Elastic demand: As SOL regains narrative dominance, every incremental institutional participant must source supply in a relatively illiquid float, especially with high staking participation. This creates reflexivity: higher prices attract more attention and flows.
• Ecosystem beta: When Solana majors rally, Solana ecosystem tokens and NFTs often follow, generating wealth effects that feedback into SOL via fees, staking, and treasury rebalancing.
• On-chain revenues and usage: Fees and MEV-like revenue capture, combined with consistent L1 usage, differentiate SOL as more than a speculative token. If fee markets remain healthy without compromising UX, valuations can adjust quickly.
• Capital markets maturity: Prime brokerage services, credit lines, and custodial lending for SOL increase leverage capacity for funds. Managed responsibly, this deepens liquidity and smooths volatility while supporting upside.
•
Institutional Signaling and Order Flow Dynamics
Institutions leave footprints:
• Options skew: A shift toward call dominance and tightening call spreads near key strikes suggests demand for upside exposure. Calendar spreads can hint at timing expectations around catalysts like ETF decisions or protocol upgrades.
• Basis behavior: Persistent positive basis with manageable funding indicates steady demand for levered long exposure without frothy excess. Sharp basis expansions often precede blow-off tops, but controlled elevations are constructive.
• Block trade prints: Larger fills on the offer with minimal price impact imply sophisticated execution algorithms are absorbing liquidity. VWAP-style participation in uptrends is a hallmark of fund flows.
•
Solana Fundamentals: Not Just Hype
The bullish case is reinforced by fundamentals:
• Throughput and reliability improvements: Ongoing client and scheduler upgrades have meaningfully reduced congestion and improved consistency, aligning the chain for mainstream-scale apps.
• Developer ecosystem: Grants, hackathons, and venture inflows are driving an uptick in deployment across DeFi, DePIN, payments, and consumer social. More apps mean more transactions, fees, and network effects.
• Staking and validator health: A broad validator set with improving decentralization metrics, plus liquid staking growth, provides both security and capital efficiency. Mature slashing protections and monitoring infrastructure reduce operational risk.
• Cross-ecosystem bridges and RWAs: Safer bridging architectures and the growth of tokenized real-world assets on Solana expand the total addressable market and institutional relevance.
The UAE Vector: Why Location Matters
The decision to anchor a Solana treasury in the UAE amplifies several advantages:
• Regulatory clarity: Entities can obtain approvals and operate with predictable oversight, facilitating custody, staking, and DeFi participation at institutional scale.
• Geographic diversification: Reduces dependence on US and EU regulatory cycles, creating a global liquidity map that supports 24/7 markets.
• Access to sovereign and family office capital: The region’s investor base is comfortable with alternative assets, infrastructure, and frontier technologies, making Solana’s high-throughput narrative particularly compelling.
• Talent and infrastructure: The UAE’s growing fintech and crypto workforce supports operational resilience for treasury and market activities.
Risk Factors and What Could Go Wrong
No thesis is complete without acknowledging risk:
• Regulatory shifts: Unexpected adverse rulings in key jurisdictions, or delays/denials around ETFs, could dampen flows and sentiment.
• Network incidents: Performance degradation or security issues would hurt adoption narratives and compress multiples.
• Liquidity shocks: If derivatives positioning becomes crowded, a deleveraging event could trigger cascading liquidations. Watch funding, OI, and CVI-like measures.
• Macro correlation: A sharp risk-off in global markets—driven by rates, growth scares, or geopolitical events—can compress crypto valuations, including SOL, even amid strong fundamentals.
• Competitive pressure: Advances from competing L1s or L2s, especially around modular architectures and data availability, could siphon developer and liquidity attention.
Signals to Track in the Coming Months
For investors and observers, keep an eye on:
• ETF decision timelines: Not just for SOL, but for broader crypto products. Watch S-1 updates, surveillance-sharing agreements, and authorized participant rosters.
• On-chain metrics: Daily active addresses, fee revenue, transaction success rates, and validator participation. Sustained growth here supports the fundamental re-rating.
• Derivatives health: Funding rates, options IV, skew, and term structure. Healthy markets allow trends to persist without disorderly squeezes.
• Treasury disclosures: Any public filings, attestations, or wallet monitoring from Solmate and similar entities. Evidence of steady accumulation bolsters the thesis.
• Ecosystem catalysts: Major app launches, RWA integrations, payments partnerships, and mobile distribution wins (e.g., Saga ecosystem) that translate to real usage.
Strategy Considerations for Different Participants
• Long-only funds: Dollar-cost averaging with disciplined rebalancing can mitigate timing risk. Consider partial hedges around known catalysts to manage drawdowns.
• Crypto-native funds: Use options to express directional views while capping tail risk. Calendar call spreads around ETF windows or ecosystem launches can be capital-efficient.
• Corporates and treasuries: For those inspired by Solmate’s model, start with staking policies, custody/vendor selection, and risk dashboards. Establish governance before deploying into DeFi strategies.
• Retail participants: Avoid over-leverage. Respect invalidation levels and maintain a cash buffer. Focus on time in market rather than perfect entries.
•
Why This Cycle Is Different for Solana
Cycles rhyme, but specific drivers evolve. For SOL, three differentiators stand out:
• Real usage at scale: Consumer-grade apps processing real volumes, with fee revenues that matter.
• Institutional-grade infrastructure: Custody, staking-as-a-service, credit lines, and compliance tooling that make large allocations feasible.
• Global capital alignment: The UAE initiative symbolizes a broader dispersion of crypto capital formation—less dependent on any single regulator or geography.
The Road to ATH and Beyond
Reclaiming all-time highs requires both narrative strength and structural support. Solana’s current setup has:
• Narrative: High-throughput chain powering next-gen consumer and financial apps, now validated by serious capital allocators.
• Structure: Disciplined treasury formation, institutional flows, deepening derivatives, and growing on-chain revenues.
A move to fresh ATHs could unfold in stages:
1. Clearance of major resistance with rising spot volume
2. Healthy consolidation with elevated but not extreme funding
3. Fresh leg higher fueled by ecosystem beta and positive macro catalysts (ETF approvals, corporate adoption)
4. Volatility expansion near psychological round numbers, followed by a volatility contraction if treasuries and market makers absorb flows
If these stages play out with controlled leverage and robust spot participation, the path toward $300+ becomes more than aspirational—it becomes a function of order flow and narrative reflexivity.
Bottom Line
• Solmate’s $300 million launch to build a Solana treasury in the UAE is a landmark institutional milestone that could catalyze regional and global capital into SOL and its ecosystem.
• Institutional players like Forward Industries are signaling a pronounced shift toward Solana, reinforcing a buying frenzy dynamic supported by liquidity and execution improvements.
• The likely approval of multiple crypto ETFs later this year is a macro tailwind that indirectly benefits SOL, even before any Solana-specific ETF comes to market.
• Technicals align with fundamentals: higher lows, constructive volume, favorable moving averages, and bullish momentum patterns support the case for an ATH retest and potential breakout toward $300+.
• Risks remain—regulatory, network, liquidity—but the balance of probabilities currently favors continued upside as on-chain usage, institutional infrastructure, and global capital alignment strengthen.
As always, this is not financial advice. Markets are volatile, and conditions can change quickly. But with treasury formation ramping, institutional flows accelerating, and technicals confirming, Solana’s next chapter is setting up to be its most consequential yet. If the current trajectory holds—anchored by the UAE treasury initiative and sustained by institutional adoption—SOL’s bid for new all-time highs and beyond looks not just plausible, but increasingly likely.

SOLANA 1W BREAKOUT EYES 550$ Solana’s 1W breakout eyes $550 mid-term target
Solana (SOLUSD) has rebounded strongly from the $180–$200 support zone inside its rising channel, confirming the 0.5–0.618 Fibonacci cluster. With three straight green 1W candles, price is now pushing toward the Higher Highs of the Wedge at $321–$350.
A breakout above this level would unlock the 1.618 Fib target at $379, with the 2.618 extension at $553–$560 as the mid-term objective. The 1W RSI crossing above its MA confirms renewed buying pressure, suggesting Solana may already be entering its next bull cycle leg.

Why Gen X Struggles with Crypto?Why does Gen X struggle with crypto?
Because they’re used to the stock market system, where ownership is recorded by a central registry and trades that are tied to a specific exchange.
In their world, you typically should buy through Nasdaq in this example and expect to sell through Nasdaq. But with Bitcoin or other cryptocurrencies, the blockchain itself is the registry, which means you can buy on one platform and sell on another freely. That shift—from centralized exchanges to decentralized settlement—is what makes crypto hard to grasp.
Mirco Bitcoin Futures and Options
Ticker: MBT
Minimum fluctuation:
$5.00 per bitcoin = $0.50 per contract
Disclaimer:
• What presented here is not a recommendation, please consult your licensed broker.
• Our mission is to create lateral thinking skills for every investor and trader, knowing when to take a calculated risk with market uncertainty and a bolder risk when opportunity arises.
CME Real-time Market Data help identify trading set-ups in real-time and express my market views. If you have futures in your trading portfolio, you can check out on CME Group data plans available that suit your trading needs www.tradingview.com

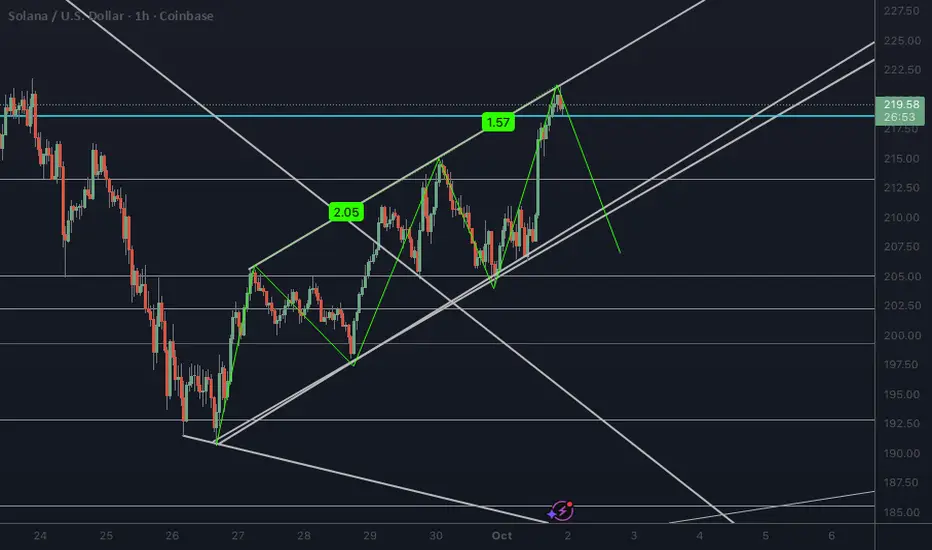
SOLUSD Three Drives PatternNot sure if those ratios fit. Someone should check that.
I also wonder where the target is supposed to be on the Three Drives pattern.
Either way. Here it is.
Solana's Comeback: Can it Break $222 and Eye $230?Solana's Comeback: Can it Break $222 and Eye $230?
Solana (SOL) is currently in a critical phase of recovery on the 4-hour timeframe after undergoing a significant correction from its peak around the 250 "Key Resistance (Sell Order Block)." Following a breakdown from a previous ascending channel and the 235-240 "flip zone," SOL found significant support near the 190 level.
From that low, we've observed the formation of a new, albeit tighter, ascending trendline, suggesting renewed buying interest and a series of higher lows. SOL is now encountering immediate resistance in the 215-222 range.
A decisive break above this 215-222 key resistance would be a bullish indicator, potentially targeting the 230 level and then the more substantial 235-240 "flip zone." Conversely, maintaining the integrity of the current ascending trendline and holding above the 200 to 205 "Immediate Sup-port" is crucial for this recovery to continue. A breakdown from these levels could see SOL retesting the "Next Support near 190." The overall structure indicates a battle between buyers attempting to regain momentum and sellers looking to defend higher price levels.
Disclaimer:
The information provided in this chart is for educational and informational purposes only and should not be considered as investment advice. Trading and investing involve substantial risk and are not suitable for every investor. You should carefully consider your financial situation and consult with a financial advisor before making any investment decisions. The creator of this chart does not guarantee any specific outcome or profit and is not responsible for any losses incurred as a result of using this information. Past performance is not indicative of future results. Use this information at your own risk. This chart has been created for my own improvement in Trading and Investment Analysis. Please do your own analysis before any investments.

Time to leave the tiny ascending channel!We’re leaving the tiny ascending channel here. Continueing our journey inside the .. much bigger ascending channel. Very very very bullish!

SOLUSD Based on the H4 chart analysis, we could see the price rising towards the sell entry which lines up with the 38.2% Fibonacci retracement and could reverse from this level to the take profit.
Sell entry is at 216.43, which is an overlap resistance that lines up with the 38.2% Fibonacci retracement.
Stop loss is at 230.50, which is a pullback resistance that lines up with the 61.8% Fibonacci retracement.
Take profit is at 194.30, which is a pullback support.
High Risk Investment Warning
Trading Forex/CFDs on margin carries a high level of risk and may not be suitable for all investors. Leverage can work against you.
Stratos Markets Limited (tradu.com ):
CFDs are complex instruments and come with a high risk of losing money rapidly due to leverage. 65% of retail investor accounts lose money when trading CFDs with this provider. You should consider whether you understand how CFDs work and whether you can afford to take the high risk of losing your money.
Stratos Europe Ltd (tradu.com ):
CFDs are complex instruments and come with a high risk of losing money rapidly due to leverage. 66% of retail investor accounts lose money when trading CFDs with this provider. You should consider whether you understand how CFDs work and whether you can afford to take the high risk of losing your money.
Stratos Global LLC (tradu.com ):
Losses can exceed deposits.
Please be advised that the information presented on TradingView is provided to Tradu (‘Company’, ‘we’) by a third-party provider (‘TFA Global Pte Ltd’). Please be reminded that you are solely responsible for the trading decisions on your account. There is a very high degree of risk involved in trading. Any information and/or content is intended entirely for research, educational and informational purposes only and does not constitute investment or consultation advice or investment strategy. The information is not tailored to the investment needs of any specific person and therefore does not involve a consideration of any of the investment objectives, financial situation or needs of any viewer that may receive it. Kindly also note that past performance is not a reliable indicator of future results. Actual results may differ materially from those anticipated in forward-looking or past performance statements. We assume no liability as to the accuracy or completeness of any of the information and/or content provided herein and the Company cannot be held responsible for any omission, mistake nor for any loss or damage including without limitation to any loss of profit which may arise from reliance on any information supplied by TFA Global Pte Ltd.
The speaker(s) is neither an employee, agent nor representative of Tradu and is therefore acting independently. The opinions given are their own, constitute general market commentary, and do not constitute the opinion or advice of Tradu or any form of personal or investment advice. Tradu neither endorses nor guarantees offerings of third-party speakers, nor is Tradu responsible for the content, veracity or opinions of third-party speakers, presenters or participants.

Solana Chart Fibonacci Analysis 092725Trading Idea
1) Find a FIBO slingshot
2) Check FIBO 61.80% level
3) Entry Point > 200/61.80%
Chart time frame:B
A) 15 min(1W-3M)
B) 1 hr(3M-6M)
C) 4 hr(6M-1year)
D) 1 day(1-3years)
Stock progress:A
A) Keep rising over 61.80% resistance
B) 61.80% resistance
C) 61.80% support
D) Hit the bottom
E) Hit the top
Stocks rise as they rise from support and fall from resistance. Our goal is to find a low support point and enter. It can be referred to as buying at the pullback point. The pullback point can be found with a Fibonacci extension of 61.80%. This is a step to find an entry-level position. 1) Find a triangle (Fibonacci Speed Fan Line) that connects the high (resistance) and low (support) points of the stock in progress, where it is continuously expressed as a Slingshot, 2) and create a Fibonacci extension level for the first rising wave from the start point of the slingshot pattern.
When the current price goes over the 61.80% level, that can be a good entry point, especially if the SMA 100 and 200 curves are gathered together at 61.80%, it is a very good entry point.
As a great help, TradingView provides these Fibonacci speed fan lines and extension levels with ease. So if you use the Fibonacci fan line, the extension level, and the SMA 100/200 curve well, you can find an entry point for the stock market. At least you have to enter at this low point to avoid trading failure, and if you are skilled at entering this low point, with the fibonacci6180 technique, your reading skill of to chart will be greatly improved.
If you want to do day trading, please set the time frame to 5 minutes or 15 minutes, and you will see many of the low points of rising stocks.
If you prefer long-term range trading, you can set the time frame to 1 hr or 1 day
