$SOLANA 250+ or bearish trend to 225/200With the recent solana pump, major profits have been taking place.
However, SOL stopped out at 249. Just under the Psychological level of 250.
On this chart we can see the following:
- Supply & Demand
- Anchored Volume
- Pattern: BF / BC /SR
- Two 4 hour FVG's below price, with HTF GP on the second FVG.
- One swing high & swing low
- OBV tool in place forming a bearish channel
- Psychological levels of 250, 225, 200
With these in place, we can see solana is looking pretty bearish now.
What comes up, must come down.
Solana is making a retest on the demand zone, which is also the resistance and golden pocket.
If price wicks and successfully rejects. We will definitely see 225.
A long with the Volume Anchor acting as a magnet for price to come back down as there has not yet been a retest.
But if it closes above the resistance, there is a greater chance of it breaking above the demand zone.
We will begin looking for shorting opportunities once solana fails to break above.
We will begin looking for long opportunities if solana succeeds in it's break above.
Right now, keep your eyes peeled.
We have movement incoming.
SOLUSDT.P trade ideas

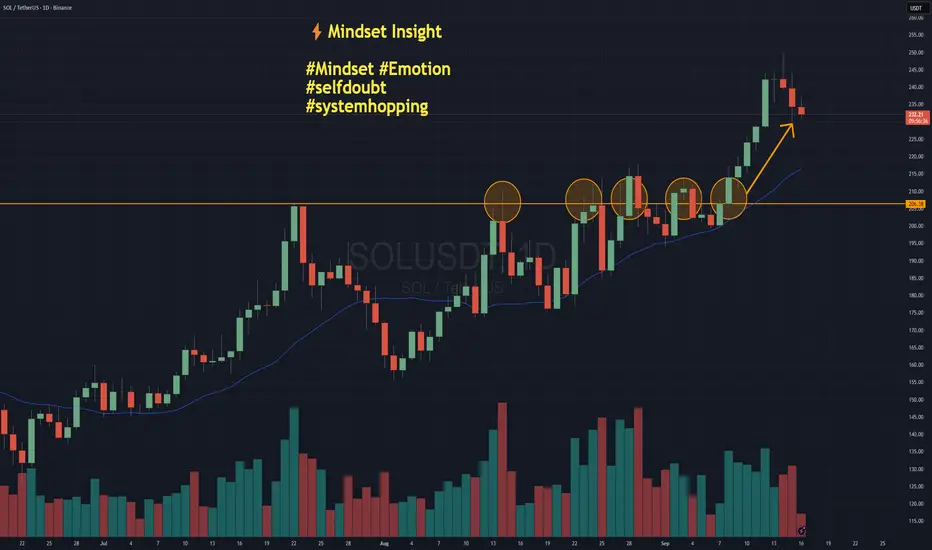
System Hopping - The Hidden Cost of Self-DoubtNOTE – This is a post on Mindset and emotion. It is NOT a Trade idea or strategy designed to make you money. If anything, I’m taking the time here to post as an effort to help you preserve your capital, energy and will so that you are able to execute your own trading system as best you can from a place of calm, patience and confidence.
Here’s a scenario:
You take a loss.
Then another.
Suddenly, the system you trusted yesterday feels broken today.
On this chart of Solana, imagine you were trading a breakout system. You may have had four false breaks that didn’t really follow through before the market finally broke higher. When do you give up on the idea or the system altogether?
How self-doubt shows up:
You start thinking: “Maybe another system would have worked better…”
You switch, tweak, reinvent mid-cycle.
You lose patience with the method you worked so hard to design.
You are in danger of system hopping.
Emotional side:
Self-doubt often disguises itself as “rational analysis,” but underneath it’s uncertainty, frustration, even a tightening in the chest. You hesitate to pull the trigger, second-guess your plan, or overcorrect with a brand-new approach.
It’s rarely your system that’s broken.
It’s the lack of trust in yourself to see it through.
Shift your mindset
Every system has drawdowns. If you abandon yours too soon, you never let it prove itself. So the task really is to find a way to collect the data without blowing out / over extending yourself.
Practical tips … the How:
Write down your system rules and keep them visible, so you trade what’s planned, not what you feel.
Track results over a proper sample size (50–100 trades) before judging performance.
Make sure you are position sizing sensibly. This is an art in and of itself. The key being - do not risk what you can not afford on any one trade / series of trades. Paper trade if you need to to start with just to collect the data on the system.
Journal emotions separately from trade outcomes — so you see when doubt is about you, not the system.
Set a “no system changes” rule during drawdowns. Only review at scheduled intervals.
Closing thought:
Your edge doesn’t come from finding the perfect system.
It comes from trusting a good one long enough to let it work.
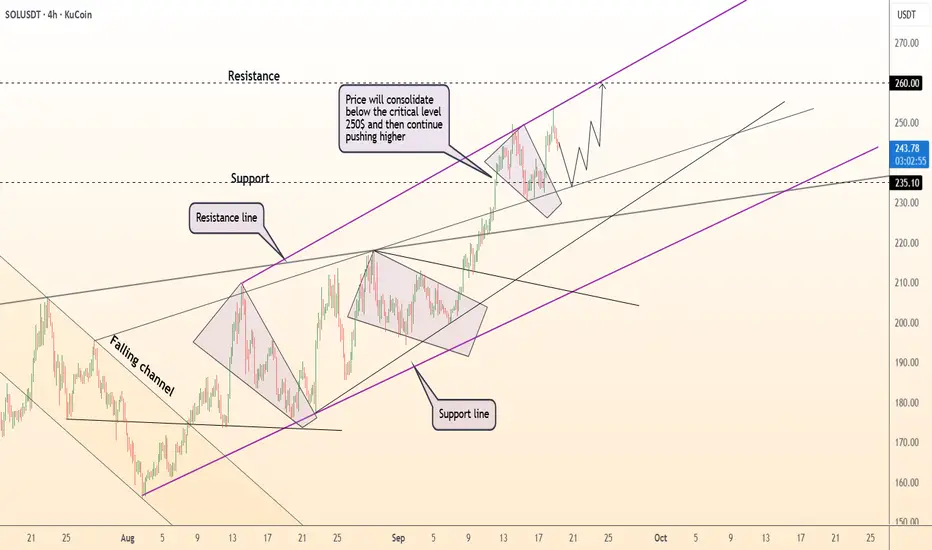
DeGRAM | SOLUSD seeks to the $260 level📊 Technical Analysis
● SOL/USD maintains a rising channel, consolidating just below the $250 resistance after strong rallies from $200 support.
● Structure suggests a bullish continuation, with a breakout targeting $260 if buyers defend $235–$240 as short-term support.
💡 Fundamental Analysis
● Solana gains momentum as institutional flows and DeFi growth increase, while broader crypto sentiment improves with easing risk aversion.
✨ Summary
SOL/USD is consolidating below $250, with $235–$240 as support and upside potential toward $260 if momentum holds.
-------------------
Share your opinion in the comments and support the idea with a like. Thanks for your support!
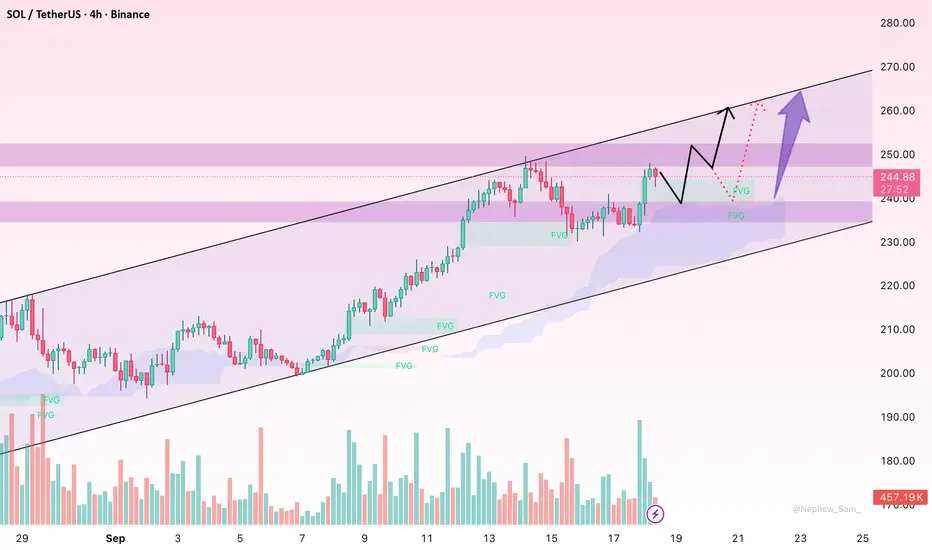
SOL/USDT: Keep Rising or Time for a Correction?Hello everyone, recently SOL/USDT has seen a strong upward movement, and now it’s at a quite sensitive price zone. The big question now is: will the uptrend continue, or is the market due for a correction before pushing further?
On the chart, SOL is still holding above the Ichimoku cloud, a sign that the bullish trend is intact. The Fair Value Gaps (FVG) formed during the rise could act as "stepping stones" of support, providing opportunities for price to bounce when it comes down to retest. The volume spike on September 17th also shows real market participation, indicating that this is not just a “fake breakout.” The 240 USD zone is currently an important support level— as long as the price stays above here, the chances of reaching 250 USD, or even 260 USD, are quite high.
Recent news also supports SOL. The crypto market, in general, is benefiting from new funds pouring in from large institutions, and Solana is no exception. The Solana development team also released updates that improve speed and reduce transaction fees, which certainly strengthens confidence in the project. Additionally, the Fed maintaining stable monetary policy creates a favorable environment for risk assets, including altcoins.
I still lean towards a continuation of the uptrend, as long as SOL doesn’t break below 240 USD. If it holds, the next target is 250 USD, and potentially even 260 USD. However, traders should also prepare for a potential correction to avoid being caught off guard.
What about you? Do you think SOL will hit 260 USD soon, or does the market need a breather before going higher? Share your views!
Solana Eyes 14% Upside, Approaching $275 Breakout Target SoonHello✌️
Let’s analyze Solana’s price action both technically and fundamentally 📈.
🔍Fundamental analysis:
The SIMD-0326 upgrade could cut Solana’s block finality to just 150ms, possibly bringing big traders and fresh capital. But new validator fees might be tough on smaller player
📊Technical analysis:
SOL is trading within a strong ascending channel, nearing a breakout above the upper boundary, which could propel price toward $275 with at least 14% upside. 📈🚀
✨We put love into every post!
Your support inspires us 💛 Drop a comment we’d love to hear from you! Thanks , Mad Whale

SOL/USDT | SOL Breaks 7-Month High – Still Bullish Above $218!By analyzing the Solana chart on the daily timeframe, we can see that the price is still pushing toward higher targets based on the main analysis. It has reached its highest level in the past 7 months and is currently trading around $225.
If the price holds above the key $218 level, we can expect further growth toward levels above $245. This analysis will be updated again. So far, the return from this setup has been more than 52% — I hope you’ve made the most of it!
Please support me with your likes and comments to motivate me to share more analysis with you and share your opinion about the possible trend of this chart with me !
Best Regards , Arman Shaban

SOL Long SOL setup is massive and unfolding fast.
Previous breakout delivered +600%
Now forming same double-bottom and channel.
$1,000+ isn’t crazy — it’s calculated.

SOLUSDT → Correction amid a strong bullish trend BINANCE:SOLUSDT , after updating its next high, formed a false breakout of local resistance and returned to the trading range as part of a correction. What to expect from altcoin?
The main driver of the crypto market, Bitcoin, is consolidating above 115K and facing fairly strong resistance at 117400. Earlier, the price completed a downward correction. The market is dominated by a positive technical and fundamental background.
SOL looks stronger than Bitcoin and is testing new highs...
The price of SOLANA is forming a false breakout of resistance and is entering a correction phase amid a bullish trend. As part of the correction, the price may test the local imbalance zone and the key liquidity level of 242.5.
Resistance levels: 244, 249.2, 253.5
Support levels: 242.5, 239, 231.5
Technically, the price may form a false breakdown of the nearest zone of interest at 242.5, and if the bulls manage to keep the price above the resistance zone of 242.5-244.0 after this maneuver, the coin may return to an upward movement. However, if this does not happen, I would wait for a retest of the 239.0 zone, where the trend support line is located. The medium- and long-term outlook for SOL is positive, and the price is highly likely to test the ATH 295.0.
Best regards, R. Linda!

SOL/USDT | Solana Correction Over? Big Rally Loading Soon!By analyzing the Solana chart on the daily timeframe, we can see that after a correction, the price is now trading around $234. In the short term, I expect a small pullback, followed by another strong bullish move from this coin.
The key demand zone is between $210–$220, while the possible upside targets are $250, $260, and $296.
Please support me with your likes and comments to motivate me to share more analysis with you and share your opinion about the possible trend of this chart with me !
Best Regards , Arman Shaban
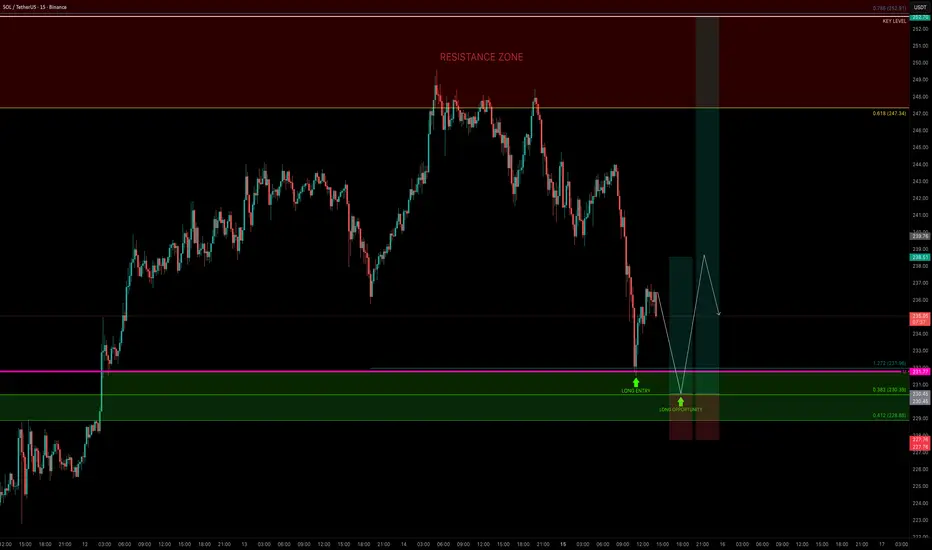
SOLUSDT under Bearish Pressure.SOL remains under bearish pressure after showing divergence on both MACD and RSI, signaling potential weakness despite holding near recent highs.
Key Levels:
Immediate support at 232.6 (Fib 0.618).
If broken, deeper downside targets lie at 218–215, with extension toward 210–206 zone.
Resistance remains at 239–245 zone.
📉 Idea: Short below 232–229 breakdown, targeting 218 → 210, with stops above 240–245 resistance zone.

SOL – Bulls Holding the Channel!SOL has been overall bullish, trading inside a clean ascending channel. Price broke above the $215 – $220 structure zone and pushed higher, but is now pulling back for a retest.
This zone is key 🔑 . It aligns with channel support, making it a strong confluence for buyers to step in. If bulls defend it, momentum could continue, and SOL may push toward higher levels inside the channel 🚀.
If the zone fails, a deeper correction could follow before another attempt from the bulls. Until then, the bias remains bullish as long as structure holds.
What do you think — will the bulls 🐂 step in and send SOL flying again, or will bears take over for a deeper pullback? 🤔
⚠️ Disclaimer: This is not financial advice. Always do your own research and manage risk properly.
📚 Stick to your trading plan regarding entries, risk, and management.
Good luck! 🍀
All Strategies Are Good; If Managed Properly!
~Richard Nasr

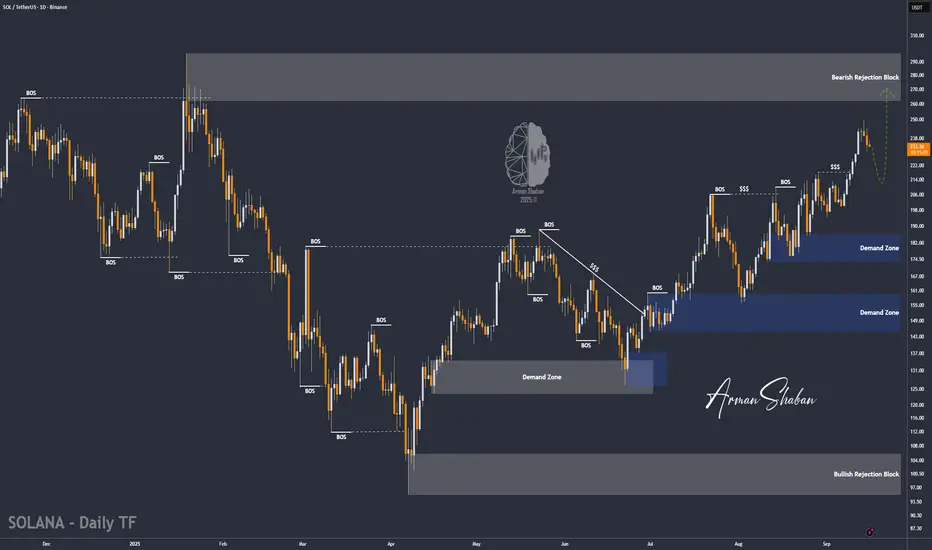
SOL — Bulls Need to Defend $230 for ContinuationSOL had a strong bullish week, almost tapping the $250 psychological level before rejecting down into the monthly level at $231.77, where price found support and bounced. This level also aligned with the 1.272 Fib extension ($231.96), making it a valid long opportunity.
🟢 Next Long Opportunity
The 0.382 Fib retracement ($230.39) of the move from the $199.32 low is the next key level to watch.
A retest here would:
Sweep liquidity from the current low
Offer a low-risk entry
Help fill some imbalances
📌 Overall, $230 is the level that must hold for bullish continuation.
Targets
TP1: $238 → R:R ~1:3
TP2: $252.91 (0.786 Fib retracement) → R:R ~1:8+ if momentum continues
Risk Management
Stop-Loss: Below $229 (clear invalidation)
Risk: Only 1% on this trade setup
Quick Take
If $230 holds, SOL could set up for another leg higher. This zone offers a clean, low-risk, high-reward long setup with clearly defined invalidation and attractive targets.
SOLUSDT _ SELL SETUPHey guys 🖐🏻
This is very nice QM setup ,🔻🔻
You can set sell position between 255 _265$

SOLUSDT Rallies: Heading Towards New HighsSOL is in a strong uptrend, with the support level at 225.00 USD having been tested and held. The price is currently aiming for 250.00 USD, with technical indicators signaling the continuation of this trend. The clear upward trendline and institutional inflows are strengthening SOL's bullish momentum.
Forecast:
If SOL maintains above the 225.00 USD support, there is a high probability it will continue to rise towards 250.00 USD.
Buy SOL when the price retraces to the 225.00 USD support zone.
Set a stop loss below 220.00 USD to protect your capital.
US Unemployment Claims data came in higher than expected, weakening the USD, which provides favorable conditions for SOL to increase in value. Additionally, Forward Industries completed a 1.65 billion USD fundraising deal to build the Solana Treasury, with participation from Galaxy Digital, Jump Crypto, and Multicoin Capital, providing a strong boost for the Solana ecosystem.

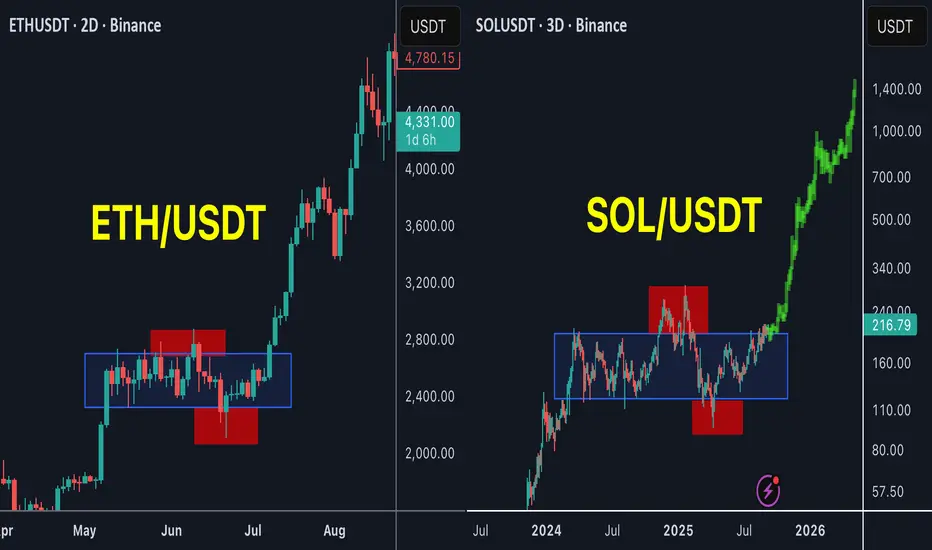
SOL is the next ETH !SOL / USDT
SOL is forming the same pattern as ETH before the huge breakout in past few weeks
Accumulation with 2 major stoploss hunt for bulls and bears and now is trying to breakout the accumulation zone
History show high success rate of this pattern
Will SOL be the next ETH ?
Best of wishes
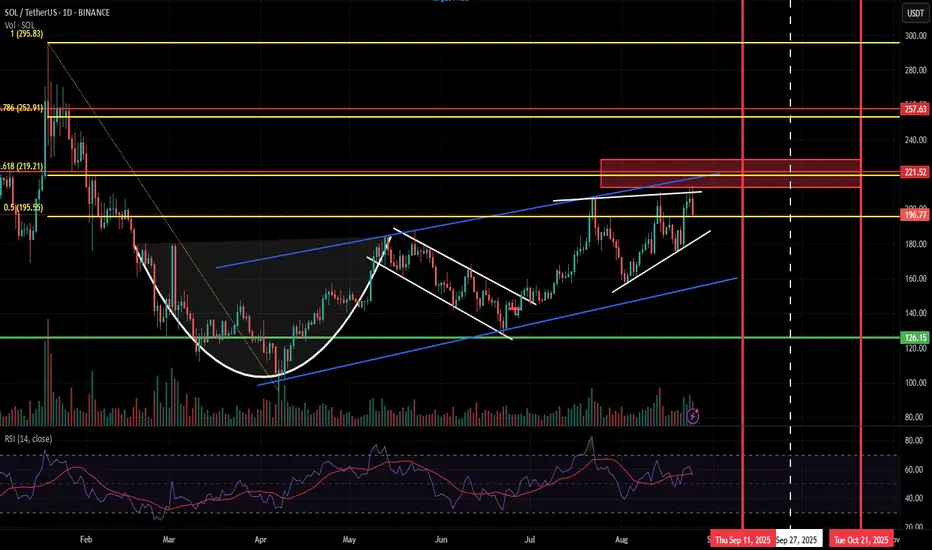
SOL big picture: All Time High again in this cycle?
Solana has being showing strength in its price action recently compared to top 10 altcoins (in MarketCap) within the past few days, yet failing to break the strong resistance within 200 and 220. Bears have consistently defended this region while maintaining the price below the 0.618 Fibonacci level of the mid January - April price drawback.
Since then, the price has maintained an uptrend where the cup-and-handle pattern strongly playing out. But the the uptrend was restricted within a parallel channel (blue) and yet to be broken, which is a breakout to be played for SOL to break the 210 barrier. Price has been moving within a bearish wedge (white) during the months July and August, and still failed to confirm a positive breakout even after the price surge due to Jerome Powell's hint on rate cuts at annual economic policy symposium in Jackson Hole, Wyoming.
The current Bull Cycle is shortly coming to an end. Based on historical behavior, BTC reaches its ATH within 510 to 550 days from its recent halving which falls between mid-September to October end. BTC is supposed to go for an ATH within this region and September rate cuts can be a good fuel to reach this target. Mostly we will be having a short altcoin season for this cycle with a probability of an extension until year end (November or early December).
Statutory 240-day deadline for VanEck and Franklin SOL ETF applications will conclude by October 2025. As reported by Coinpaper, the final deadline has been set to October 16, 2025 for five Solana ETF applications. (source: coinpaper). These positive news can align with the last phase of the Crypto Cycleand trigger new ATH for SOL. Price will take a downturn if Bulls progressively struggle to break the parallel channel resistance by this time, marking the end of the current cycle.
So, a high probability exist for SOL to reach new ATHs with caution on the overall market sentiment within the coming 2 to 4 months. As the time of writing, SOL is at 198.14 , plunged from a local high of 213.6.
SOL The Whales are Selling at This Strong Resistance Level 230$SOL Current Market Update
The coin is now facing a very strong resistance around $230 .
This presents a great short opportunity .
After carefully monitoring buy and sell orders on-chain, I noticed a strong confirmation for the short setup:
Whales and Market Makers sell orders are clustered heavily around the $228 – $230 resistance zone.
✅ My Personal Strategy:
Short Entry: Resistance zone between $228 – $230
🎯 Target 1: $220
🎯 Target 2: $216
Please note:
This is not financial advice – I’m only sharing my personal trades.
Always do your own research before taking action.
👍 Don’t forget to like if you found this useful, and feel free to follow me for more analysis of this kind.
Best of luck 🌹

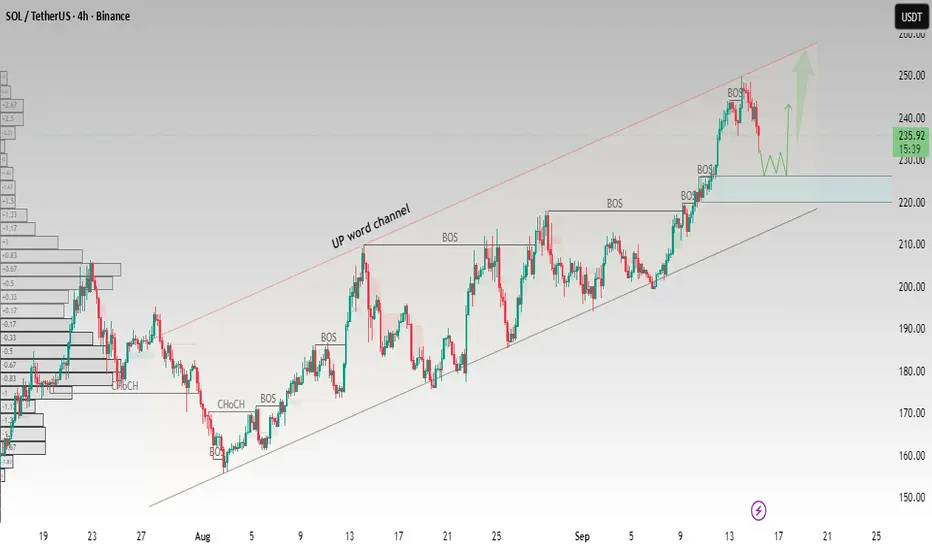
SOL/USDT – Testing Support Within Upward ChannelSOL is moving inside a clear upward channel on the 4H timeframe. After multiple Breaks of Structure (BOS), the price is now pulling back from the upper channel resistance.
Key zone to watch: $225 – $230 support area. If buyers defend this level, SOL could bounce and retest the $245 – $250 zone at the channel top.
Price holding below $225 may signal deeper retracement toward the lower boundary of the channel.
This setup highlights how structure, BOS levels, and channel dynamics can guide potential trade decisions.
Educational purpose only. Not financial advice
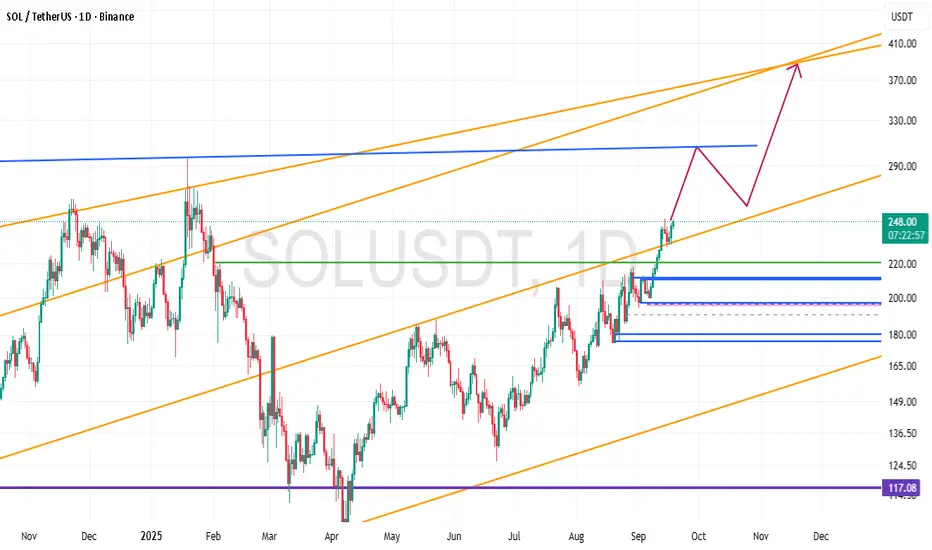
Technical Analysis Report: Solana (SOL/USDT)Current Price: ~$248
Solana is currently trading within a bullish ascending channel on the daily timeframe. The overall mid-term trend remains positive, supported by higher highs and higher lows.
🔑 Key Levels
Support Zones:
$220 → psychological support and trendline retest
$200 → major structural support (critical level)
$180 → strong support in case of a deeper correction
Resistance Zones:
$290 → short-term resistance and potential rejection area
$370 → upper boundary of the channel and main bullish target
📈 Possible Scenario
Price may extend its rally toward $290.
A corrective pullback to the $250–260 range could follow.
If momentum holds, the next bullish target lies around $370 at the channel top.
⚠️ Risk Notes
As long as SOL holds above $200, the bullish trend remains intact.
Losing the $200 support could trigger a decline toward $180.
Risk management and stop-loss placement are essential due to possible short-term volatility.
📌 Summary
Solana maintains a bullish outlook while trading inside its ascending channel. The medium-term upside targets stand at $290 and $370, with key supports at $220–200. Short-term corrections are possible, but the overall structure favors further upside as long as $200 holds.
SOLANA LONGFed rate cut finally came in as expected with more on the way going forward.
All the 401k money is about to flood in to the market and most people are betting on Solana.
Ascending triangle breakout fully complete. Going long from here
Minimum price target from here is 480-500 zone .
SL below 185

$SOL Skyrockets to 240: Catch the Bull Run! BINANCE:SOLUSDT
CRYPTOCAP:SOL Skyrockets to 240: Catch the Bull Run!
Entry Level: Marked at 1 (240.00 USDT), suggesting a potential buy point near the current price.
Take Profit (TP) Levels:TP1: 0.786 (228.33 USDT)
TP2: 0.618 (219.17 USDT)
TP3: 0.5 (212.73 USDT)
TP4: 0.185 (185.46 USDT)
Stop Loss (SL): Set at -1.272 (254.84 USDT), indicating a level to exit if the price moves against the trade.
Dead Cat Bounce (DCB): Marked at -1.135 (247.36 USDT), possibly indicating a minor reversal point.
RSI (Relative Strength Index)Current RSI: Around 80.93, which is in the overbought territory (above 70), suggesting the asset may be overvalued and could be due for a pullback or consolidation.
Trend: The RSI has risen sharply in recent days, aligning with the price surge, indicating strong momentum but also potential overextension.
Key ObservationsThe chart indicates a bullish breakout with significant upward momentum, but the overbought RSI suggests caution. Traders might consider taking profits at the marked TP levels or waiting for a pullback to the entry or lower TP levels.
The SL is set above the recent high, providing a buffer against a potential reversal.
The analysis appears to use a Fibonacci-based strategy, with levels derived from a recent swing high and low.

Solana Price Forecast | SOLUSDT Market OutlookSOLUSDT has completed a strong upward cycle and is now unwinding through a structured retracement. This phase is not showing disorderly selling but rather a controlled reset, where liquidity is being cleared to prepare for the next expansion.
The chart reflects a market that is cycling through accumulation, breakout, and pullback phases with consistency. Current downside movement is shaping a foundation zone that could serve as the springboard for renewed upward momentum.
Overall, the asset is displaying a constructive trajectory: corrections are functioning as fuel rather than weakness, pointing toward continuation of its broader growth path once this reset stabilizes.

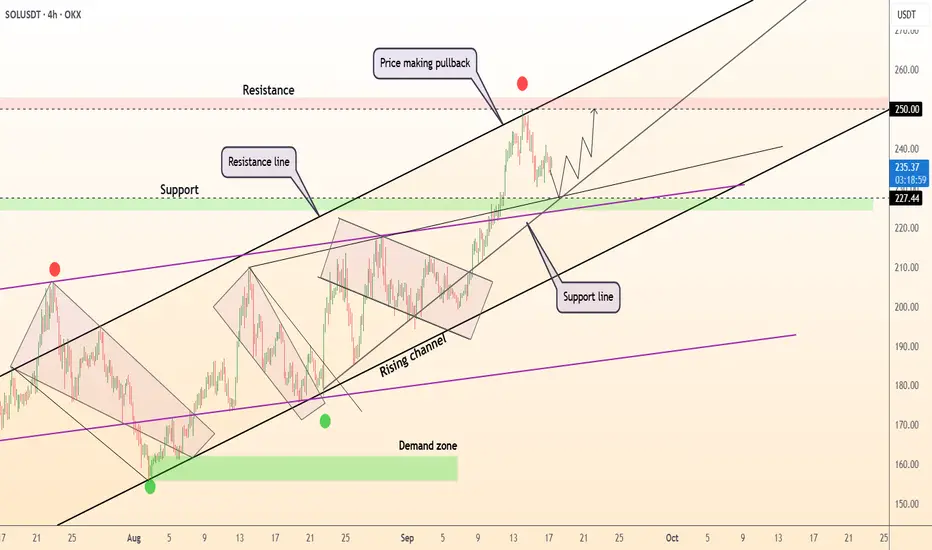
DeGRAM |SOLUSD will test the support level📊 Technical Analysis
● SOL/USD is trading inside a rising channel, with price pulling back toward 227 support after rejecting 250 resistance.
● Structure shows continuation potential, with higher lows along the support line keeping momentum intact and targeting a retest of 250 if buyers hold.
💡 Fundamental Analysis
● Solana’s ecosystem strength is supported by growing NFT volumes and DeFi activity, while recent whale inflows highlight institutional interest in altcoins.
✨ Summary
Bullish above 227; targets 240 → 250. Invalidation on a close below 227.
-------------------
Share your opinion in the comments and support the idea with like. Thanks for your support!