SOL/USDT Holds 185 USD – Waiting for Next Breakout Momentum?Hello everyone,
BINANCE:SOLUSDT is pausing around 185 USD after a corrective pullback from the 200 USD area. This is not a negative signal but a market rebalancing phase following the prior uptrend. The bullish structure remains intact with a sequence of higher highs and higher lows, showing no
Related pairs

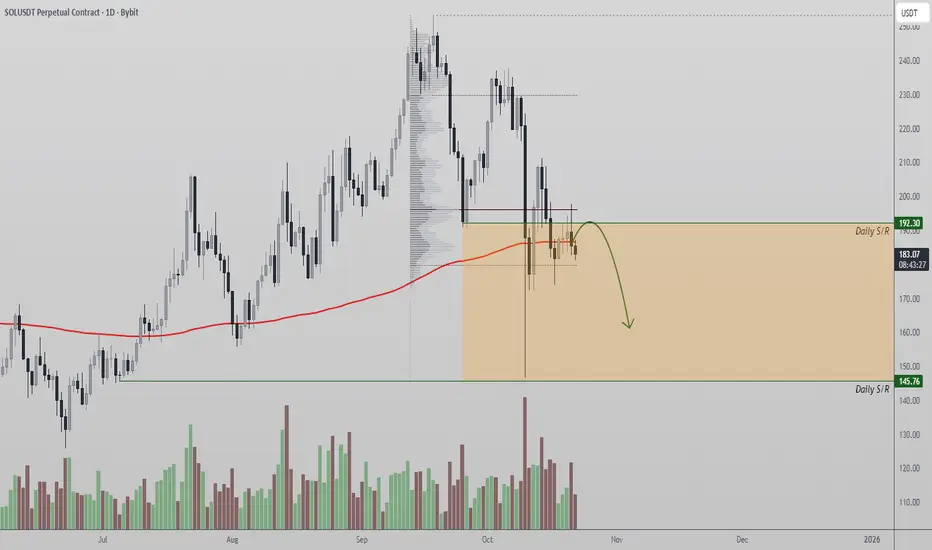
Solana Faces Strong Rejection at $192 ResistanceSolana price action is struggling to gain momentum above the $192 level, a critical zone packed with strong technical confluences. This region houses both the 200 Exponential Moving Average (EMA) and the Point of Control (POC), making it a decisive battleground for market participants.
The inabilit
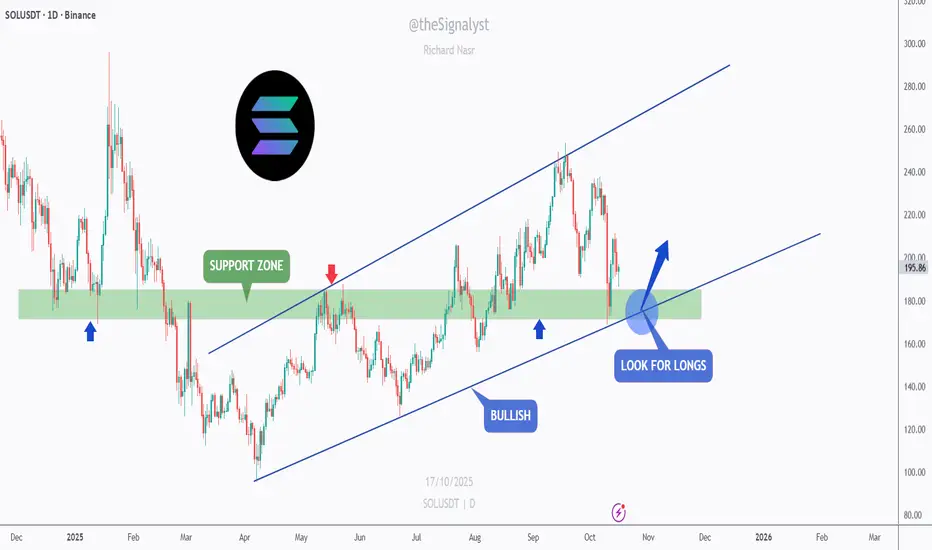
SOL - Buying the Retest Like a Sniper!SOL remains overall bullish , trading within a clean ascending channel and currently retesting the support zone that has acted as both resistance and support in the past.
This zone also aligns perfectly with the lower blue trendline, creating a strong area of confluence.
As long as this intersecti
SOLUSDT: Technical Factors Remain Bearish👋Hello everyone, let’s take a look at BINANCE:SOLUSDT !
SOLUSDT is currently trading around $181, continuing its multi-day correction. This pullback comes as the overall crypto market weakens following Bitcoin’s sharp decline and broad profit-taking among major altcoins. Market sentiment remains

SOL — From Panic to PrecisionLast week, we witnessed a sharp, market-wide crash, a chain reaction of liquidations that flushed out overleveraged long positions. While many altcoins saw 60–90% drawdowns, the majors held relatively firm.
Among them, SOL stood out as one of the most technically precise. Price perfectly tapped the

Be careful with SOLANA !!!It can be said that the price has broken out of this triangle and may experience a solid upward move. However, before the rally, it will likely liquidate long positions once.

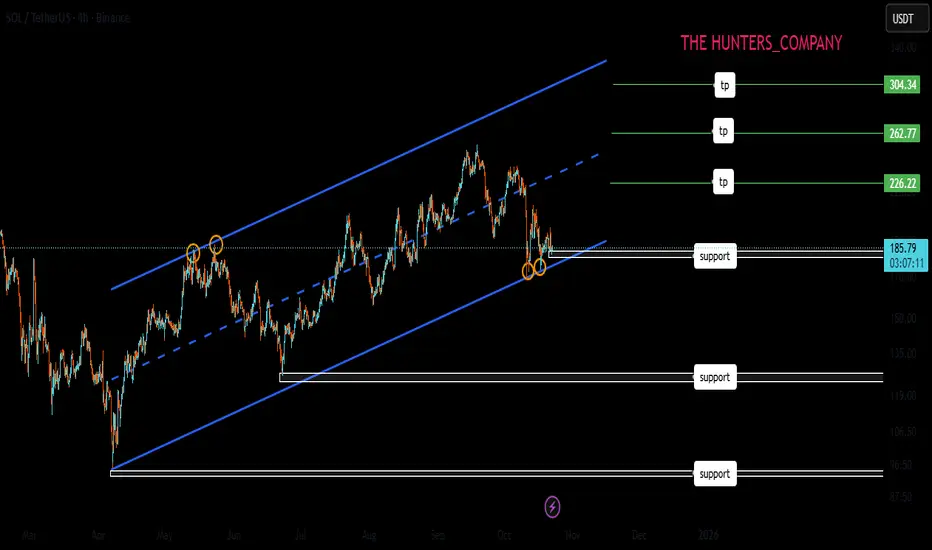
SOL ; What can be done?Hello friends
Given the decline we had, the price has been moving in an ascending channel for some time now, and now that the price is at the bottom of the channel and is on an important move, we can buy one step with risk and capital management, and in case of further correction, we can buy anothe
SOLANA BUSSING n SETTING UP sol play : Get IN wif me : we going higher after this lil shake out : THANKS CZ N TRUMP:

$SOL - LONG - ABOUT TO POP?Analysis:
Following up on my Oct 14th BTC note — “Wait for arbitrage to balance spot markets” — we’re now nearing that blue box. As BTC approaches equilibrium, I’m eyeing CRYPTOCAP:SOL for a clean long setup.
Here’s why 👇
AVWAP Confluence Zone:
We’ve got the lower band of a HTF auction co

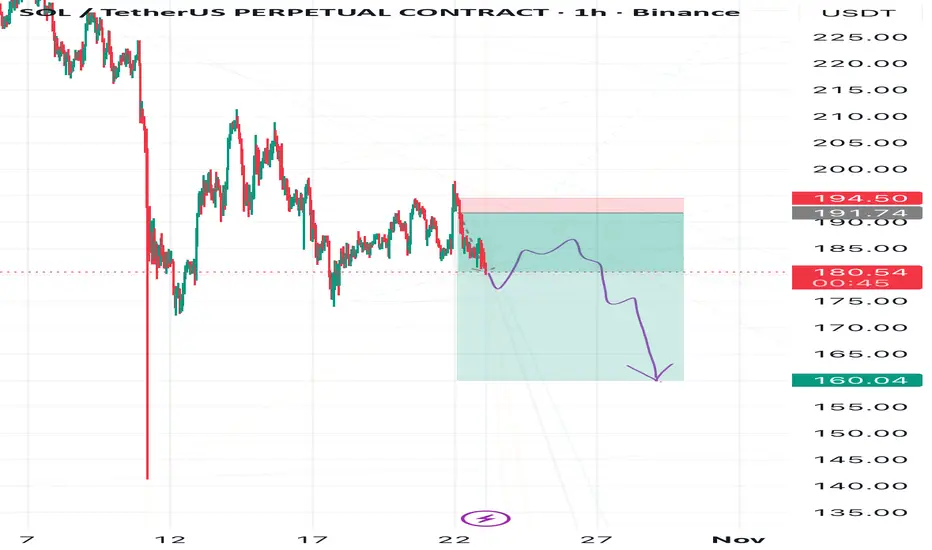
Don’t Trust the Twist — Solana’s Fall May PersistBe careful with Solana — the market might trick you into thinking a bullish reversal is forming.
In reality, the downtrend hasn’t finished yet.
A descending triangle is forming, and the breakout could be strongly to the downside.
🎯 Targets:
1️⃣ 164
2️⃣ 156
3️⃣ 138
❌ Invalidation: if price reaches
See all ideas
Summarizing what the indicators are suggesting.
Oscillators
Neutral
SellBuy
Strong sellStrong buy
Strong sellSellNeutralBuyStrong buy
Oscillators
Neutral
SellBuy
Strong sellStrong buy
Strong sellSellNeutralBuyStrong buy
Summary
Neutral
SellBuy
Strong sellStrong buy
Strong sellSellNeutralBuyStrong buy
Summary
Neutral
SellBuy
Strong sellStrong buy
Strong sellSellNeutralBuyStrong buy
Summary
Neutral
SellBuy
Strong sellStrong buy
Strong sellSellNeutralBuyStrong buy
Moving Averages
Neutral
SellBuy
Strong sellStrong buy
Strong sellSellNeutralBuyStrong buy
Moving Averages
Neutral
SellBuy
Strong sellStrong buy
Strong sellSellNeutralBuyStrong buy
Displays a symbol's price movements over previous years to identify recurring trends.
Frequently Asked Questions
SOL / TetherUS (SOL) reached its highest price on Jan 19, 2025 — it amounted to 295.83 USDT. Find more insights on the SOL price chart.
See the list of crypto gainers and choose what best fits your strategy.
See the list of crypto gainers and choose what best fits your strategy.
SOL / TetherUS (SOL) reached the lowest price of 1.03 USDT on Dec 23, 2020. View more SOL / TetherUS dynamics on the price chart.
See the list of crypto losers to find unexpected opportunities.
See the list of crypto losers to find unexpected opportunities.
The safest choice when buying SOL is to go to a well-known crypto exchange. Some of the popular names are Binance, Coinbase, Kraken. But you'll have to find a reliable broker and create an account first. You can trade SOL right from TradingView charts — just choose a broker and connect to your account.
Crypto markets are famous for their volatility, so one should study all the available stats before adding crypto assets to their portfolio. Very often it's technical analysis that comes in handy. We prepared technical ratings for SOL / TetherUS (SOL): today its technical analysis shows the sell signal, and according to the 1 week rating SOL shows the neutral signal. And you'd better dig deeper and study 1 month rating too — it's buy. Find inspiration in SOL / TetherUS trading ideas and keep track of what's moving crypto markets with our crypto news feed.
SOL / TetherUS (SOL) is just as reliable as any other crypto asset — this corner of the world market is highly volatile. Today, for instance, SOL / TetherUS is estimated as 7.66% volatile. The only thing it means is that you must prepare and examine all available information before making a decision. And if you're not sure about SOL / TetherUS, you can find more inspiration in our curated watchlists.
You can discuss SOL / TetherUS (SOL) with other users in our public chats, Minds or in the comments to Ideas.