SOLUSDT - Smart Investment!If you missed the Ethereum rally, don’t miss Solana’s.
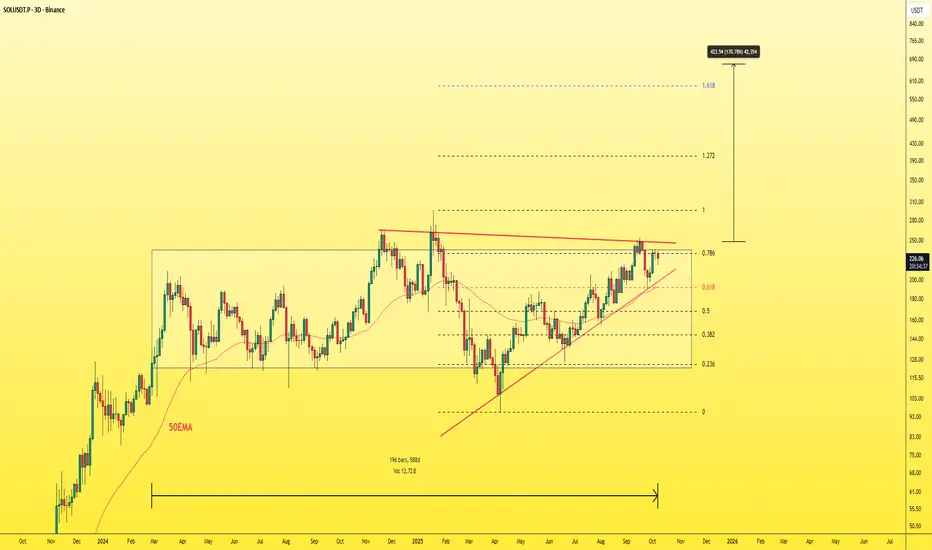
The 3-day chart looks insanely bullish — the coin has been consolidating for 588 days, almost 20 months.
Right now, it’s forming a massive triangle pattern with a minimum target of $650.
Trust me, you don’t need to put your money into crazy coins and risk losing it.
You’ve got SOL — with a strong chart and a solid market cap.
Forget those who say high market cap coins don’t move much.
Look at BNB, ETH, and BTC — they’ve all had massive runs and hit new all-time highs. It’s a much safer and smarter investment than chasing random volatile tokens.
Best Regards:
Ceciliones🎯
Trade ideas
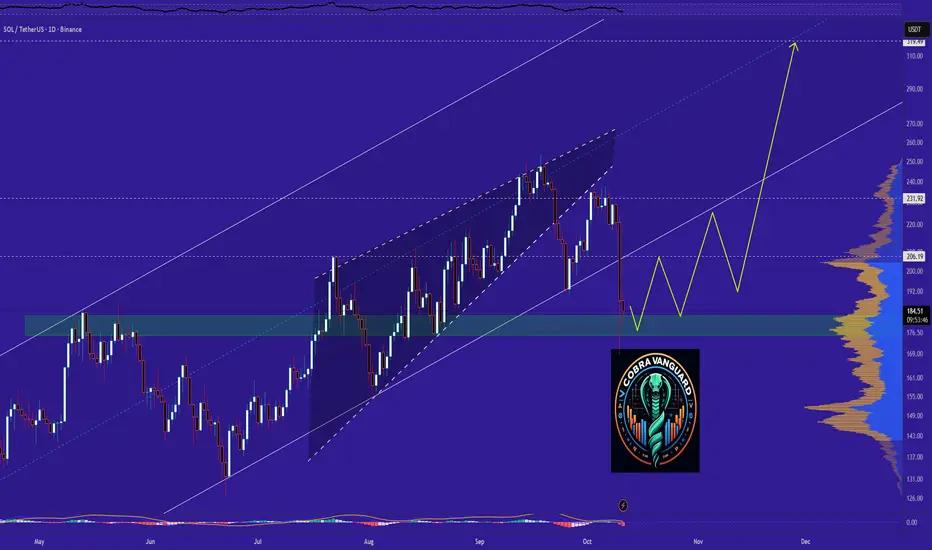
SOLANA Outlook after the Dip. What to expect NOW? has broken below its ascending channel support near $190, signaling short-term weakness. If buyers fail to reclaim this level, price could test the $150–$160 demand zone. A strong rebound from that area might restart the uptrend toward $220–$240.
The price can easily reach the shown targets from here.
Best regards CobraVanguard.💚
SOL Confirms Bearish PatternSOL Confirms Bearish Pattern
On Friday, Solana confirmed a larger bearish pattern following Trump’s comments.
So far, the pattern remains valid, showing signs of a larger decline. Whether that happens remains to be seen in the coming days or weeks.
But given that BTC has started to correct further, it is possible that SOL could fall back to at least the 170 price zone, which was also tested on Friday.
The main targets I am considering if the price moves below this clear bearish pattern:
170
135
104
You may find more details in the chart!
Thank you and Good Luck!
❤️PS: Please support with a like or comment if you find this analysis useful for your trading day❤️

SOLUSDT - Take The SOULSOUL with sol what a combination, with small stops on the top and ride all the way to the bottom of it as marked!

SOL last support area potenial of 20% gain toward 218$hi
the support and resistances on the chart are based on the previous data and weekly candlesticks if BINANCE:SOLUSDT holds this last support the potential of 20% gain is logical toward 218$

SOL — From Panic to PrecisionLast week, we witnessed a sharp, market-wide crash, a chain reaction of liquidations that flushed out overleveraged long positions. While many altcoins saw 60–90% drawdowns, the majors held relatively firm.
Among them, SOL stood out as one of the most technically precise. Price perfectly tapped the 1.1 trend-based Fib extension, in confluence with the yearly level, the 21 monthly SMA and the 0.666 retracement, providing a high probability long setup.
After that bounce, SOL revisited the lows, approaching the yearly level near $170, which remains the key structural support for maintaining bullish momentum. The support zone between $175–$170 aligns with the 21 EMA/SMA on the monthly timeframe, which currently spans $158–$170 → forming a strong macro confluence cluster that’s critical to hold.
From there, price unfolded into a clean 5-wave impulsive structure, topping within a dense resistance zone between $208–$212, reinforced by:
mOpen at $208.68
21 EMA/SMA (Daily TF) between $211–$212
0.618 Fibonacci retracement at $211.43
This area offered the perfect low-risk short entry.
Currently, SOL appears to be forming an ABC corrective pattern, likely targeting a move back into the $190–$185 range to fill imbalances and complete wave C. As another key element, the yearly open at $189.31 sits mid-range between resistance and support → a critical pivot level. That’s the region I’ll be monitoring for long setups.
🔍 Indicators used
DriftLine — Pivot Open Zones → For identifying key yearly/monthly/weekly/daily opens that act as major S/R reference points
Multi Timeframe 8x MA Support Resistance Zones → to identify support and resistance zones such as the monthly 21 EMA/SMA.
➡️ Available for free. You can find it on my profile under “Scripts” and apply it directly to your charts for extra confluence when planning your trades.
_________________________________
💬 If you found this helpful, drop a like and comment!

TradeCityPro | SOL: Market Calms After Sharp Move & RSI Support👋 Welcome to TradeCityPro!
Let’s analyze SOL, one of the most popular Ethereum killers with a market cap of $99.9 billion, currently ranking 6th on CoinMarketCap.
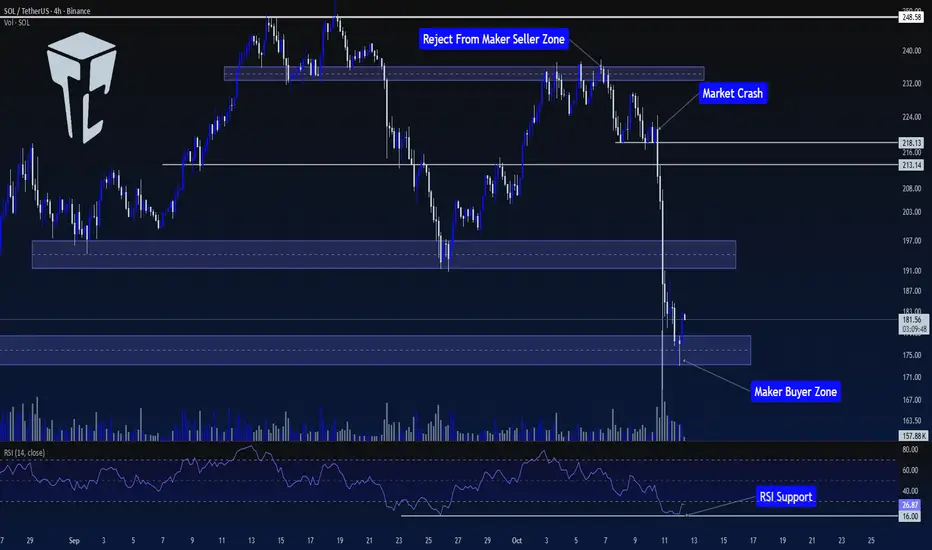
⏳ 4-Hour Timeframe
In the previous analysis, we had a Maker Buyer zone around $235. In that analysis, I mentioned that breaking this zone would be an early trigger for breaking $248.58.
🔍 However, the price never managed to sustain above this level, and after getting rejected from this zone, the price entered a corrective phase, forming a support at $218.13.
📊 After the price bounced from $218.13 for the first time, it failed to set a new high in line with previous highs and instead formed a lower high. The price returned to $218.13 again.
✔️ With the breakout of this level, coinciding with news between China and the U.S., the price started a sharp downward move, breaking through the $213.14 support.
✨ Over the course of 2-3 candles, SOL made a sharp move towards the first Maker Buyer zone, breaking it and reaching the second Maker Buyer zone.
💫 Naturally, there was a significant increase in selling volume during this move, and RSI dropped to 16, where it found support.
🧩 Currently, the market seems to have calmed down, with RSI still in the Oversell zone, but volatility has significantly decreased.
💡 Although the market has calmed, I believe the price needs to build a more structured setup before finding valid triggers, and the market conditions are not ideal for opening positions right now.
💥 So, for now, I won’t provide any triggers on this coin and will wait for more structure to form before making a better decision to open a position.
📝 Final Thoughts
Stay calm, trade wisely, and let's capture the market's best opportunities!
This analysis reflects our opinions and is not financial advice.
Share your thoughts in the comments, and don’t forget to share this analysis with your friends! ❤️
Solana Holds 190 USD – Can Buyers Defend the Level?Hello everyone,
After hitting a local top near $205, Solana (SOL) entered a correction, dropping to $192 before stabilising around the crucial $190 support. This level has repeatedly acted as a “brake zone” for previous declines, and it’s once again the focal point for traders.
Technically, SOL’s short-term structure reflects a corrective pattern with descending highs. However, the 190–195 zone remains a strong demand area. Fair Value Gaps (FVGs) appear at $194, $200, and $210 — potential retest points that may define the next directional move. The Ichimoku Cloud still leans slightly bearish, with Span A below Span B, yet the thick lower cloud base sitting near support suggests a possible rebound if buyers regain momentum.
On the macro front, Solana faces pressure from the Fed’s ongoing tightening stance, which slows risk appetite. Even so, the Solana ecosystem remains vibrant — DeFi, NFT, and layer-2 activity continue to attract long-term interest, helping sustain confidence among investors.
In the short term, failure to hold above $190 could trigger a deeper pullback toward $180. Conversely, if buyers defend this zone and push through $200, an advance toward $205–$210 may follow, paving the way for a potential trend reversal.
What do you think — is Solana ready for a rebound, or are we in for one more dip?

SOLANA LONGSOLUSDT is approaching a strong demand zone around 216–217 where previous liquidity sweep and accumulation took place. CVD and OI suggest short exhaustion, and funding rates have normalized, indicating a potential shift in momentum.
Long setup targeting 237 zone, with confirmation on bullish structure break and sustained volume recovery.
Entry: cmp
dca : 216 to 217
Target: 237
Stop-loss: Below 215
SOLANA Buying Opportunity Solana has established support at the daily trendline and successfully closed above the key daily resistance level at $191.32. The daily RSI is also indicating a potential buying opportunity, suggesting renewed bullish momentum. If this upward trend continues, the next potential target for Solana is around $250.

$Solana $250+ or DOWN 216?In our recent post, we perfectly predicted the touch of 250 and 190.
Price has now reversed off the supply zone and is making its way back up, lets see what the potential out come for the next two weeks are!
Solana (SOL/USDT) 1H Chart Analysis
Current Price: ~$232
Trend : Price is was inside a clear ascending channel, respecting support and resistance lines - however has now breached resistance.
Key Levels
Support Zones:
$225 → Psychological support + 4H FVG.
$216 → Deeper 4H FVG and strong volume node. ( + 4 Hour Fib GP )
$200 → Major psychological level + prior supply zone flip.
Resistance Zones:
$250 → Psychological resistance + demand zone.
$275 → Next major resistance if $250 breaks.
Bullish Scenario
If SOL holds above $225 and consolidates within the trend channel, price could retest $250.
Break and close above $250 may extend rally toward $275.
Bearish Scenario
Failure to hold $225 could drag SOL to the $216 FVG or even $208.
A breakdown of $208 increases risk of revisiting $200.
Summary
Market structure remains bullish as long as price respects the rising trendline.
$225 is the key short-term pivot: holding above favors $250+, losing it opens downside risk toward $216–200.
Let me know what you think!

SOLUSDT – Weak rebound, bears back in controlAfter a sharp drop on October 14, Solana made a slight recovery but quickly hit resistance at the downtrend line — where sellers stepped back in strongly. The $208 zone continues to act as a tight lid on price action, signaling that current buying pressure isn’t strong enough for a reversal.
With U.S.–China trade tensions still simmering, the overall crypto market — including SOL — remains under pressure. If the price fails to break above this descending trendline, SOL could likely fall back toward the $188 support zone, or even $175 in the next move.
In short, the main trend remains bearish, and current rebounds look more like opportunities for sellers to reload for the next push downward.

SOLUSDT LONG TRADE TO ATHSuper Bullish on SOL.
This gem is going to renew ATH very soon.
Now is a good point of entrance for Long position.
DYOR.

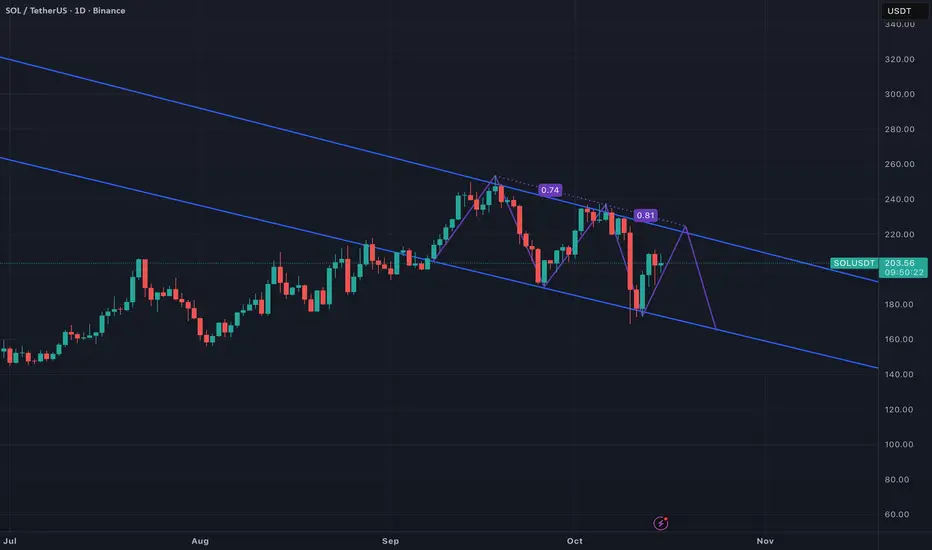
SOL – Short into 215–225 inside descending channel | TP Timeframe: 1D
Context: SOL has been printing lower highs/lows inside a clear descending channel since mid-September. Price is hovering around the channel midline and, in my view, likely to “pop” into the upper boundary before the next leg down.
Primary setup (Short):
Entry zone: Scale in on a rejection of 215–225 (upper channel + prior swing confluence).
Confirmation: Daily close rejection (wick/engulfing), loss of intraday support, or momentum/volume fade.
Stop (invalidation): >232 (conservative: 235) above the upper channel and last LH.
Targets:
T1: 195 (channel midline)
T2: 185
T3: 170 (lower channel)
Trade management: Take partials at T1/T2 and trail to breakeven; aim for ≥2R.
Alternative (bullish breakout):
If we get a daily close >232 with follow-through and 220 holds as support, the short idea is invalidated. Consider a long on retest with:
Targets: 245 → 260 area
Invalidation: Back below 220.
Why this idea:
Well-defined down-sloping channel; prior rally-fades (0.74 and 0.81 swings) show repeated supply near the upper boundary.
Clean risk box with clear invalidation above 232 and asymmetric downside to 170.
Horizon: ~1–3 weeks, depending on when the upper-band retest occurs.
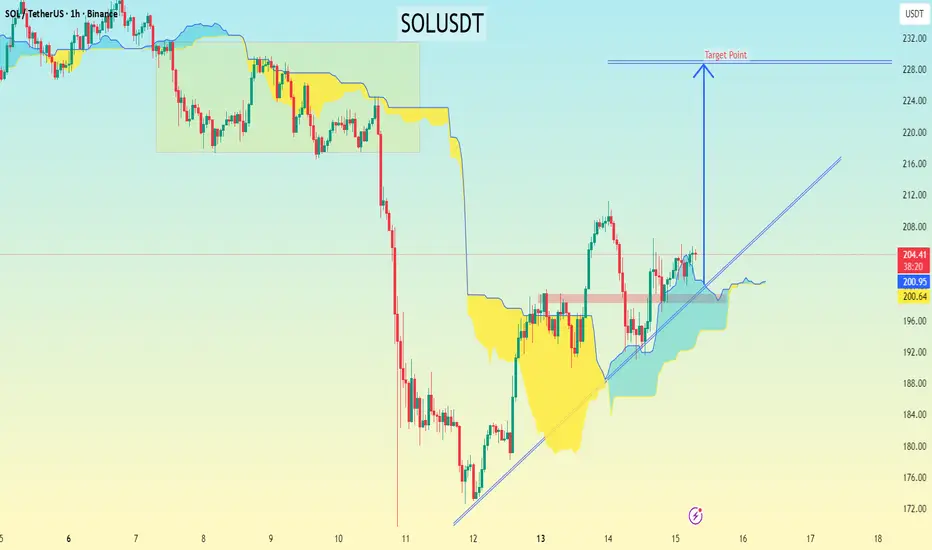
SOLUSDT chart (1-hour timeframe)...SOLUSDT chart (1-hour timeframe), here’s a detailed breakdown of the setup and the potential target based on the price structure and Ichimoku setup:
---
🔍 Chart Observations
Current price: around $205
The price has broken above the Ichimoku Cloud, confirming a short-term bullish bias.
A rising trendline from the $180 area is providing strong support.
The “Target Point” label I have drawn sits roughly around $230–232.
The cloud (Kumo) is bullish and widening, suggesting potential continuation upward.
---
🎯 Target Levels
Based on structure and Ichimoku confirmation:
1. First target (short-term): $212 — local resistance area / psychological level
2. Main target: $228–232 — aligns perfectly with my chart’s “Target Point” label and previous swing-high zone
3. Extended target (if momentum continues): $240 — strong resistance from the last consolidation before the drop
---
🛑 Stop-Loss Suggestion
Below the trendline or the Kumo support: around $198–200
(A clean break below this would invalidate the bullish setup.)
---
⚖ Trade Plan Summary
Type Entry Stop Target 1 Target 2 Risk:Reward
Long $204–206 $198 $212 $228–232 ~1:2.5–1:3
---
📈 Summary:
Trend = Bullish
Entry = On retest of $202–205 area
Target = $228–232
Stop = Below $198
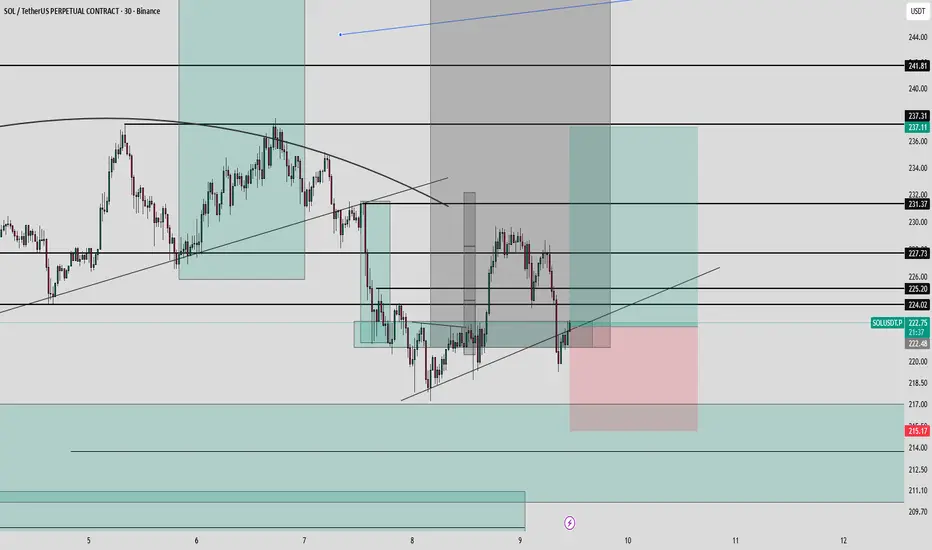
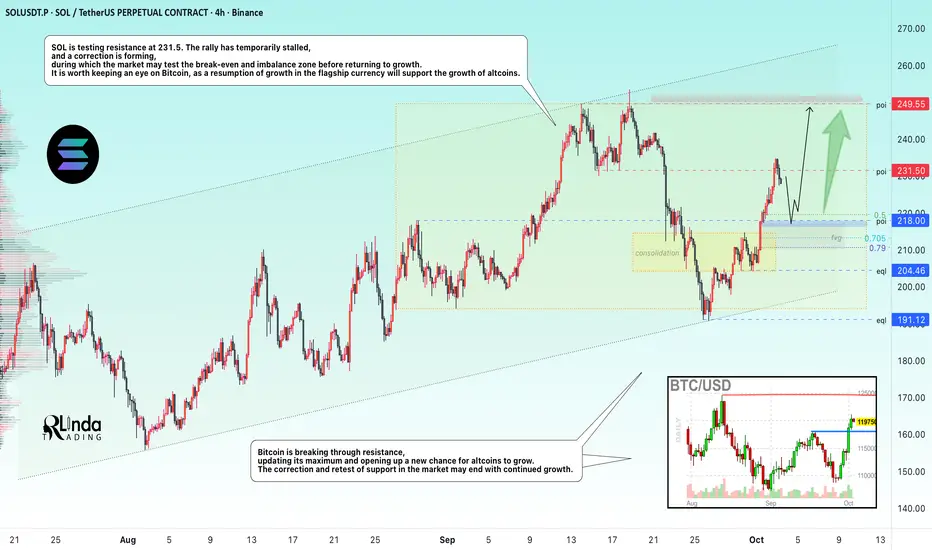
SOLANA → Retracement for consolidation before growth to 250.0BINANCE:SOLUSDT bounces off trend support, forms a reversal pattern, and enters a distribution phase, during which it updates its maximum but encounters strong resistance. What's next?
Bitcoin breaks through resistance, updating its maximum and opening up a new chance for growth for altcoins. Correction and retesting of support in the market may end with continued growth.
SOL is testing resistance at 231.5. The rally has temporarily stalled, and a correction is forming, during which the market may test the break-even and imbalance zone before returning to growth. It is worth keeping an eye on Bitcoin, as a resumption of growth by the flagship will support the growth of altcoins.
Resistance levels: 231.5, 235, 250
Support levels: 218, 205
A false breakout of 231.5 is provoking a pullback. It is necessary to monitor the further halt in price. I expect a retest of 220-218 before the price returns to growth.
Sincerely, R. Linda!
Solana Post ETF approval RallyBINANCE:SOLUSDT is expected to show a strong market rebound due to its ETF approval this week. The price may even climb above the previous high of $254 due to FOMO led buying.
Lingrid | SOLUSDT Support Hold Long OpportunityBINANCE:SOLUSDT is retracing down to the 212.8 support zone after a sharp bullish move. Price action is forming a higher low structure above the upward trendline, suggesting early accumulation before a breakout attempt. As long as the 212–210 area holds, a move toward 234–253 remains technically favored. Overall structure points to a medium-term bullish recovery phase toward the upper resistance zone.
⚠️ Risks:
A breakdown below 210 could reactivate the bearish channel toward 192.7.
Weakness in Bitcoin or broader market sentiment may slow recovery momentum.
Unexpected macroeconomic events or Fed-related commentary could increase volatility and delay breakout confirmation.
If this idea resonates with you or you have your own opinion, traders, hit the comments. I’m excited to read your thoughts!

DeGRAM | SOLUSD is holding the support zone📊 Technical Analysis
● SOL/USD is consolidating above the dynamic support near $220 after rebounding from the lower channel line, signaling potential continuation toward $248 resistance.
● Price action shows higher lows and tightening structure, indicating accumulation within a bullish continuation pattern. Holding above $220 keeps momentum intact for an upward breakout.
💡 Fundamental Analysis
● SOL benefits from rising DeFi activity and growing adoption of Solana-based projects, while investor sentiment strengthens amid broader altcoin recovery.
✨ Summary
● Long bias above $220; targets $248. Consolidation supports bullish continuation amid improving market sentiment.
-------------------
Share your opinion in the comments and support the idea with a like. Thanks for your support!

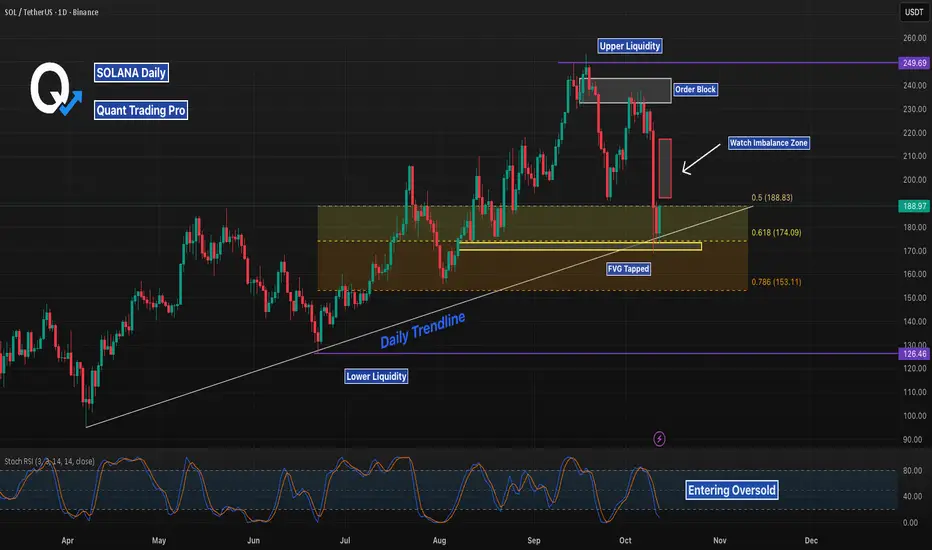
SOL Daily Recap: Breakout or Reversal Ahead?Solana (SOL/USD) recently tested the daily trendline support around $174.09 and bounced, with price action now approaching the FVG target zone near $189.55. The bullish move pushed toward the watch imbalance zone at $200, hinting at a potential breakout toward upper liquidity at $240 if momentum holds. However, the order block rejection near $210 suggests caution—watch for a bearish reversal if it fails to break, targeting lower liquidity at $153.11. With Stoch RSI entering oversold, a bounce or further dip could be next—keep an eye on $200 as the key pivot!
Support around 212.91 is crucial
Hello, fellow traders.
By "Following," you'll always get the latest information quickly. Have a great day today.
-------------------------------------
(SOLUSDT 1W Chart)
The chart may look complicated due to the drawn lines, but the key is whether the price can rise above the boxed area.
In other words, whether the price can rise above the 179.53-237.60 range and maintain its upward momentum is crucial.
-
(1D Chart)
The HA-Low indicator on the 1D chart is showing signs of forming at the 212.91 level.
Therefore, if support is confirmed around 212.91, it would be a good time to buy.
However, the HA-High ~ DOM (60) range has formed in the 236.88-237.60 range, so we need to see if it can break above this range.
If the upward breakout fails, it's time for a partial sell-off.
-
To continue the uptrend by breaking above a key zone or point,
1. The StochRSI indicator must be trending upward. If possible, it should be below the overbought level.
2. The On-By-Value (OBV) indicator must be trending upward. If possible, it should remain above the High Line.
3. The TC (Trend Check) indicator must be trending upward. If possible, it should remain above the 0 level.
If the above conditions are met, the uptrend is likely to continue.
-
Thank you for reading to the end.
I wish you successful trading.
--------------------------------------------------

Long the king, and short the "Sol" Jack ?Being long Bitcoin is being long on a healthy market rally with BTC.D bouncing, and therefore Bitcoin leading.
If BTC.D bouncing means an overall retrace on the market, I think Sol makes a good candidate for a short position to target 150s
I think the DATs and the ETF narratives are getting pretty exhausted, and that could make an extra argument, even if this is the part where it gets tricky (timing tops is hard).
Still, i think playing this with 30/40% of the Bitcoin long is EV+
Game on!

Too Early to Buy Solana? Watch the $200–210 ZoneAs mentioned in my general crypto post yesterday, I remain bullish on the broader market and still hold some altcoins at this stage.
However, that doesn’t mean we should jump in blindly, assuming this is it.
Every setup needs confirmation — and Solana is no exception.
At the time of writing, SOL/USD is trading close to my initial entry area, but price action deserves a closer look.
1. What Happened on Friday
The general market sell-off pushed Solana below both a key horizontal support and the lower boundary of its rising channel — a clear bearish technical signal.
After that, we saw a strong recovery into the weekend, with price touching the psychological $200 level overnight before facing some resistance.
2. Current Market Structure
Despite the bounce, the structure remains bearish for now.
A clean stabilization and acceptance above the $200–210 zone would be the first technical sign of a potential trend shift to the upside.
3. Trading Plan
If you’re considering a long position on Solana, I believe it’s too early to enter.
The market looks overconfident in recovery, and when everyone assumes “the bottom is in,” that’s often when a new drop comes.
Wait for confirmation!
