SOLANA BULLRUN??? $120+ Check Analysis (FREE MONEY?)Looking at Solana, We have a Buy Model on the Daily TF, Scaling down to 4H we see a MSS, scaling down to 15m we can see a buy model forming with the 4H PD arrays.
Stop loss: $98.50
Invalidation Point: Close below $94.50
SOLUSDT trade ideas

SOL Escapes Its Negative Trend and May Keep RisingBINANCE:SOLUSDT recently broke out of a medium-term negative price channel, which allowed it to break above a major resistance level as well. Over the past 48 hours, the altcoin also printed a series of higher highs and higher lows on the 4-hour chart, which could be a sign of the crypto’s trend undergoing a bullish reversal.
The 9 Exponential Moving Average (EMA) has shown a gradual increase, indicating a slight bullish momentum in the short term. Similarly, the 20 EMA has progressed modestly as well, suggesting a stabilization in the medium-term trend. These EMAs are essential indicators for identifying the trend's strength and direction.
The Moving Average Convergence Divergence (MACD) line moving closer to the signal line with the histogram values turning positive, indicates a reduction in the bearish momentum. Specifically, the histogram's shift from 0.191 to 0.501 suggests an increasing bullish sentiment among traders.
The Relative Strength Index (RSI) has fluctuated between 43.05 and 50.27, which places the Solana price in a neutral zone, neither overbought nor oversold. This neutrality in RSI indicates a balance between buying and selling pressures.
The immediate resistance level at $104.26, followed by higher resistances at $105.16, will be key hurdles for the Solana price to overcome to sustain an upward trajectory. On the downside, support levels at $102.04 and $99.9 will be critical in preventing significant drops and stabilizing the price.
Considering the technical indicators, the slight bullish signals from the EMAs and MACD, combined with the neutral stance of the RSI, suggest a cautiously optimistic outlook for the Solana price. However, the true potential movement will depend on the cryptocurrency's ability to breach the mentioned resistance levels or if it succumbs to downward pressures reaching the support thresholds.


SOLUSDT shorthi Traders
It's been a great time for bulls. However, there's a chance for bears to take control and we have to be aware of this.
If you're a bull, taking profit or closing your longs at 121 $ will be very reasonable.
121$ - It can be also an entry level for shorts.
2 targets:
- 102.59 $
- 95 $
Good luck

SOLUSDT - QUICK TRADE ANALYSISSOLUSDT is in a continuous bearish trend, we have two scenarios.
1- If SOLUSDT breaks its previous lower high which is mentioned on the chart then we will buy it after the break of resistance. There is already a bullish divergence present on the 1H timeframe. If it respects the divergence then it will break its resistance and continue its bullish trend.
2- In the Second scenario, if SOLUSDT doesn't break its resistance and continues its bearish trend we will wait for the break of Support 1 and after the break of Support 1 we will short it till Support 2. Moreover, we can also expect a reversal from support 2.
HAPPY TRADING :)

solso keey buying sol this will be last dip sol can pump havy in few days with small risk yes we can enter right now becuse we are above 200 ema

Are buyers entering the market?📊 Due to the decrease in the downward momentum of the price movement and the increase in the buying pressure in the market, in case of the failure of the upward downward pattern and the stabilization of the high price, the price may increase to the range of 106.0 🎯 and in the case of the strength of the range of 110.0 units🎯🎯.
📊 Otherwise, the price may fall to the range of 96.0 units.

Solana has reached a significant order blockSolana has reached a significant order block, indicating a potential turning point in its price action. Currently, it finds support from a well-established trend line and is exhibiting a bullish divergence on the 4-hour chart. This confluence of technical factors suggests a strong possibility of upward movement in Solana's price.

Trade Alert: Long Position on SOLUSD, Falling Wedge PatternDescription:
📉 Trade Idea Overview:
Identify a potential long trade opportunity on SOLUSD as we observe a falling wedge pattern on the 15-minute chart. We advise traders to wait for confirmation before entering, considering the dynamic market conditions.
🚩 Falling Wedge Pattern Analysis:
Delve into the specifics of the falling wedge pattern on the 15-minute chart, signaling a potential reversal from the current downtrend. Understand the characteristics of this pattern and how it may influence market dynamics for short-term traders.
📊 Technical Indicators Complementing the Bullish Trend:
Discover the supporting technical indicators that complement the falling wedge pattern, reinforcing the long trade hypothesis. Our analysis aims to provide insights into the confirmation signals aligning with the bullish outlook.
⚖️ Risk-Reward Assessment:
Evaluate the risk-reward ratio of the trade, with detailed information on entry points, stop-loss levels, and potential profit targets. Effective risk management is crucial in navigating short-term trades, and we provide a comprehensive overview to assist in your decision-making process.
📈 Dynamic Market Sentiment:
Consider the dynamic market sentiment surrounding SOLUSD, with a brief exploration of any immediate fundamental factors influencing the short-term outlook. A holistic approach ensures a well-informed trading strategy.
🚨 Disclaimer:
Trading involves inherent risks, and past performance does not guarantee future results. Prior to making any trading decisions, conduct thorough research, and consider your risk tolerance. Consultation with a financial advisor is recommended for personalized advice.
📉 Conclusion:
Embrace the long trade opportunity presented by the falling wedge pattern on the 15-minute chart of SOLUSD. Whether you're an experienced trader or new to short-term trading, this analysis provides valuable insights to navigate the complexities of the market. #SOLUSD #FallingWedgePattern #LongTrade #TechnicalAnalysis #livetraderx #tradeitpro
(Note: This post is created based on the information provided and does not constitute financial advice. Please conduct your own research and consult with a financial advisor before making any trading decisions.)


SOL/USDT 1D TIMEFRAMEThe sol/usdt is forming Bullish Bat Harmonic Pattern. Prior to this the potential entry is at 54 and 30. The 0.886 of XA leg is at 30 giving us good risk reward ratio.
TYOR, DYOR!

SOLUSDTsmart money concept analysis: Don't get caught in whale traps.
What do you think of this idea? What is your opinion? Share it in the comments📄🖌
If you like the idea, please give it a like. This is the best "Thank you!" for the author

SOLANA H&SSolana showing H&S in 4h tf
It will hit the order block in 4h tf which is indicated in the chart
Manage your risk
Bulls will start tomorrow after the FOMC report

$SOLBreak of pattern...continue 5th wave down to 94 range.
Then we go back up....grab liquidity 1st.

Solana 🐻 I was stopped out on my previous analysis of Solana, which suggests that there is likely to be a correction soon. As a result, I have taken a short position.


Solana (SOL): Pump or Dump?Now that Solana has had a nice rejection from upper zones, it is near an important zone, which will determine which of those two patterns we will see ("double top" or "cup and handle).
We are monitoring closely, as we might see some liquid movement here soon!
Swallow Team

SOLUSDT → combining several patternhello guys...
solana formed an upside-down head and shoulder pattern on the broken trendline!
on the other hand, we can see a similar cup and maybe a handle pattern!
on the other side, this coin made a top normal head and shoulders on a lower time frame!
so I suppose this coin will touch the 94$ area 📉 and then will be prepared for another upward movement to 129$!📈
___________________________
💻📞☎️ always do your research.
💌📫📃 If you have any questions, you can write them in the comments below, and I will answer them.
📊📌❤️And please don't forget to support this idea with your likes and comment

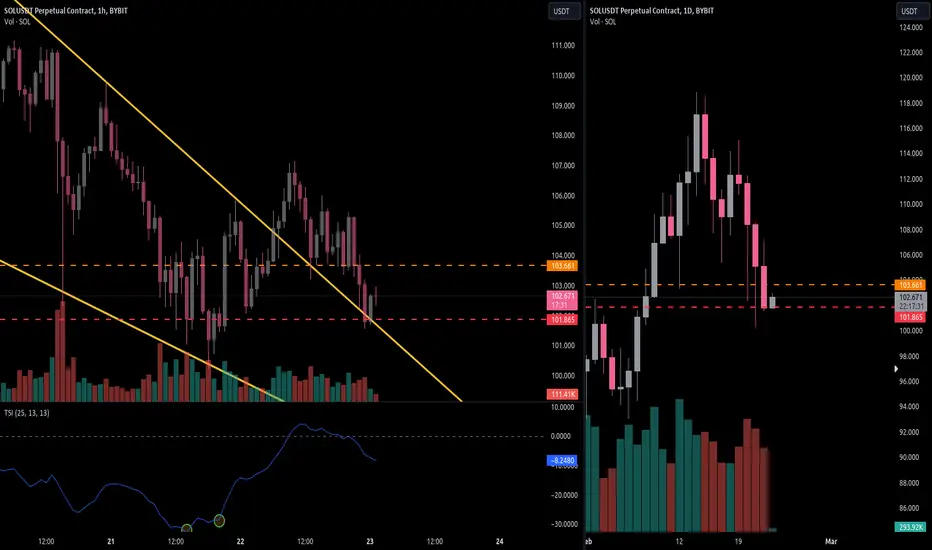
Solana scalpingI have entered a long position in Sol, as there is a mini divergence on the RSI indicating a potential quick profit opportunity.

#Sol #long #idea If Solana holds this level, I expect the price to jump due to a divergence in price and RSI.

Solana Long Position Failed Trade Review So the trade I took at 21:00 UTC stopped out...
The candle at 23:00 took it out by a smidge and price may still continue downward after publishing this post.
We can see that price so far has touched the trend line twice and the trend line seems to now be acting as support. So I will be looking for a re-entry on another long trade.
The failed trade has made take pause and ask my self a few questions
1. Did I develop a strong bias over the last day, as I saw the price action develop a reversal? (or so I thought). In doing so, did this affect my judgement on timing of entry and stop loss positioning.
2. Should I have waited for a bullish candle confirmation on the Daily time frame?
3. Should I have have placed a long position on the breakout of the trend line and collected what I could from the move?
What do you guys think?
Until the next trade :)
Long Position on SOLUSDTAnalysis:
Bullish Divergence in RSI: A bullish divergence is observed in the Relative Strength Index (RSI), indicating potential upward momentum.
Stop Loss Protection: The Point of Control (POC) from the volume profile can be used to protect the stop loss, providing a key support level.
Take Profit Levels:
TP1: Set the first take-profit level between the 23% and 38% Fibonacci retracement levels.
TP2: Place the second take-profit level between the 50% and 61% Fibonacci retracement levels.
TP3: Target the third take-profit level at the 78% Fibonacci retracement level.
Use of Gray Rectangles: Gray rectangles, derived from open interest and representing areas with the highest volume, are used to set the take-profit levels.
Trade Plan:
Entry: Consider entering a long position based on the bullish divergence observed in the RSI.
Stop Loss: Protect the trade with a stop-loss order placed below the Point of Control (POC) from the volume profile.
Take Profit:
TP1: Close a portion of the position at the first take-profit level between the 23% and 38% Fibonacci retracement levels.
TP2: Take additional profits at the second take-profit level between the 50% and 61% Fibonacci retracement levels.
TP3: Target the final portion of the position at the 78% Fibonacci retracement level.
Risk Management: Ensure proper risk management by allocating an appropriate portion of your capital to this trade and adjusting position size accordingly.
Note: Always conduct thorough analysis and consider using additional technical indicators or confirmatory signals before executing any trades. Risk management is crucial to protect your capital in volatile markets.

Sol Daily Chart Analysis Sol Daily Chart Analysis
Again beautiful tume to buy back sol & enjoy the ride
cheers and support my ideas
