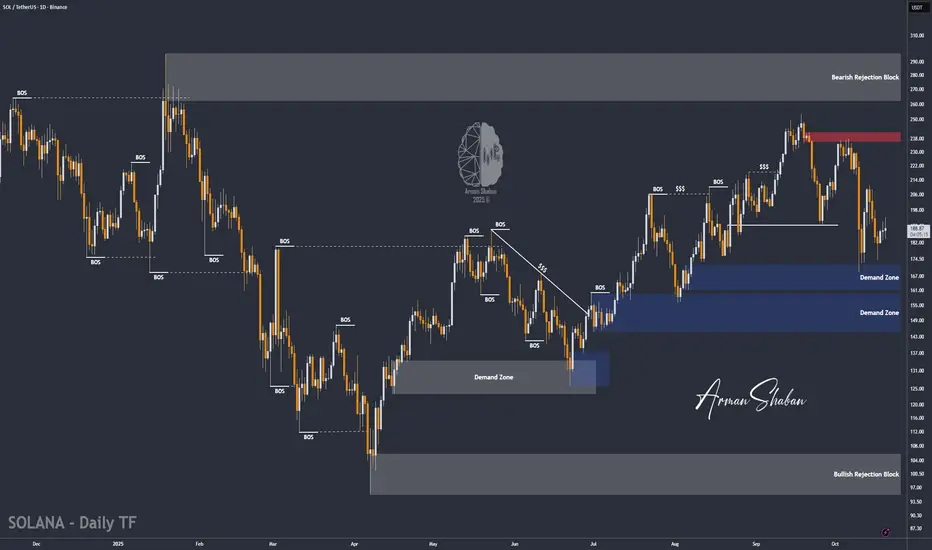
SOL/USDT | SOL Update – Recovering After Volatile Swings!By analyzing the #Solana (SOL) chart on the daily timeframe, we can see that after a sharp drop to around $169, SOL quickly rebounded to $211, then faced another correction back to $174. Since holding steady above $170, the price has regained momentum and is now trading near $190, showing signs of renewed strength.
If SOL manages to maintain stability above the $170–$175 zone, the bullish structure remains intact. The next upside targets are $211, $216, $238, and $254 , where short-term reactions may occur before further continuation.
The overall outlook remains bullish , but you should watch closely to see if SOL can sustain its momentum above current levels — this could be the start of a new leg higher.
Please support me with your likes and comments to motivate me to share more analysis with you and share your opinion about the possible trend of this chart with me !
Best Regards , Arman Shaban
Trade ideas
$SOL (DAILY): GOLDEN POCKET as tough RESISTANCE, big move soonCRYPTOCAP:SOL is getting ready for a bigger move soon after being squeezed into a corner, or an apex between an ascending 6-month-long trendline and horizontal resistances overhead.
Notably, the GOLDEN POCKET zone resistance, once again, but #sol is more bullish than many other large-caps.
Still, it has to follow the latest HIGHER LOW with a higher high next, so the main level to watch is $210 to $215. Close a strong volume candle above and LONGS should be mandatory. 50 MA must be reclaimed first, as far as I'm concerned, this is my filter. $214 right now.
Some mild bullish HIDDEN OBV divergence, always a good sign. Too many resistances overhead for an entry at market prices.
TRIGGER BUYS between $215 and $220 a good option for now, otherwise maanage an entry manually. Need a SOLANA vs CRYPTOCAP:BTC analysis next.
👽💙

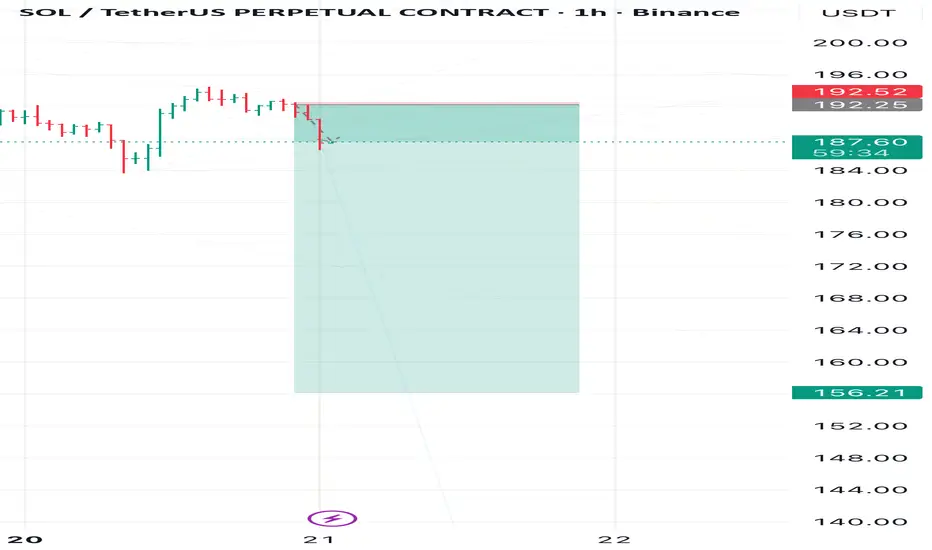
Solana correction completed — next bearish wave aheadAfter a short-term correction, Solana (SOL) is showing signs of renewed bearish momentum.
The recent upward move looks like a retracement within a larger downtrend structure.
🔹 Current outlook: Bearish
🔹 Updated target: 156 (previously 164)
🔹 Invalidation: Breakout above the marked resistance zone on the chart
As long as the price remains below resistance, I expect continuation toward the lower support area.
A confirmed breakout above this zone would invalidate the bearish scenario and shift the bias to bullish.
#Solana #SOLUSD #CryptoAnalysis #TechnicalAnalysis #PriceAction #Altcoins #BearishSetup #TradingView #MarketStructure
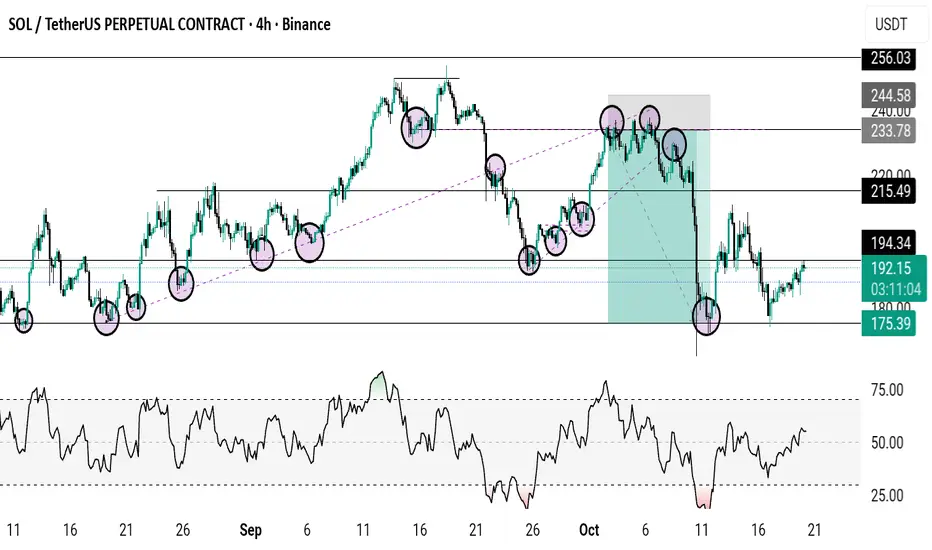
Solana 20 oct 2025 analysis if today 20 oct 2025 daily close we can stand the price above 191, possibly we can continue rally up

Something worth learning If you connect the dots together you'll see it matches trendlines and zones and also having multiple confluence in trading will give you an edge in the market
So many ways and strategies out there.
Break and retest is one of them it's simple and effective
I use Break and retest and others like RSI
The blck lines represent zones and if you check my entry and exit you'll see zones
Also on the RSI the exit is below 30% while the entry if above 70%
Note: sometimes RSI can be above 70% and below 30% for a long time doesn't it will reverse
That's why you use other confluences like strong zone or trendline
Don't just trade with OVERBOUGHT AND OVERSOLD
If this was helpful
Drop a like and comment 👍
Be careful with SOLANA !!!It can be said that the price has broken out of this triangle and may experience a solid upward move. However, before the rally, it will likely liquidate long positions once.

SOL Uptrend Intact — Key Support at 182.7Last week, Solana also continued its downward move but quickly recovered after breaking an important level. At the moment, the price is in an uptrend, and as long as it stays above 182.7, the target range is 214–215 .
If 182.7 breaks, a drop toward 153 can be expected.

SOLANA SOLUSDTSOLANA bullish catalysts
Approval of Spot Solana ETFs: The US Securities and Exchange Commission (SEC) is expected to approve spot Solana ETFs imminently, potentially by the end of October 2025. ETF approval tends to open the doors for mainstream institutional and retail investors, likely injecting billions of dollars into SOL's market and significantly boosting demand and price.
Alpenglow Upgrade: Solana's upcoming Alpenglow network upgrade, projected for Q1 2026, will transition Solana from proof-of-authority to proof-of-stake consensus. This upgrade is expected to boost transaction speeds to over 100,000 TPS and improve network scalability and security, supporting broad adoption and enhancing Solana's competitive edge over other blockchains like Ethereum.
Strong On-chain Metrics and Institutional Adoption: Solana exhibits robust on-chain activity—65,000 transactions per second, $9.3 billion total value locked (TVL) in DeFi, and 32 million unique wallets. Institutional holders currently own approximately 13 million SOL, reflecting growing confidence by major players including Visa and PayPal.
Macro-Economic Tailwinds: Expectations of Federal Reserve rate cuts encourage appetite for risk assets like crypto. Alongside improved liquidity conditions, this sets a favorable macro backdrop for SOL's price appreciation.
Market Position and Ecosystem Growth: Solana is a leading smart contract platform with rapid development, high developer engagement, and dominance in niches like DeFi and NFTs, strengthening its growth potential.
I dont know what else to say other than Solana crashing is coming
key demand floor
@supplyroof break and close new demand floor 211.45
@130.2- @129.5
@76.71 my choice
layer by layer.
@41.52
#solusdt #solana #crypto.

SOLANA SOLUSDTSOLANA bullish catalysts
Approval of Spot Solana ETFs: The US Securities and Exchange Commission (SEC) is expected to approve spot Solana ETFs imminently, potentially by the end of October 2025. ETF approval tends to open the doors for mainstream institutional and retail investors, likely injecting billions of dollars into SOL's market and significantly boosting demand and price.
Alpenglow Upgrade: Solana's upcoming Alpenglow network upgrade, projected for Q1 2026, will transition Solana from proof-of-authority to proof-of-stake consensus. This upgrade is expected to boost transaction speeds to over 100,000 TPS and improve network scalability and security, supporting broad adoption and enhancing Solana's competitive edge over other blockchains like Ethereum.
Strong On-chain Metrics and Institutional Adoption: Solana exhibits robust on-chain activity—65,000 transactions per second, $9.3 billion total value locked (TVL) in DeFi, and 32 million unique wallets. Institutional holders currently own approximately 13 million SOL, reflecting growing confidence by major players including Visa and PayPal.
Macro-Economic Tailwinds: Expectations of Federal Reserve rate cuts encourage appetite for risk assets like crypto. Alongside improved liquidity conditions, this sets a favorable macro backdrop for SOL's price appreciation.
Whale Accumulation: Recent price dips saw large holders ("whales") increase their Solana holdings substantially.
Market Position and Ecosystem Growth: Solana is a leading smart contract platform with rapid development, high developer engagement, and dominance in niches like DeFi and NFTs, strengthening its growth potential.
I dont know what else to say other than Solana crashing is coming
key demand floor
@supplyroof break and close new demand floor 211.45
@130.2- @129.5
@76.71 my choice
layer by layer.
@41.52
#solusdt #solana #crypto.

SOLANA SOLUSDTSOLANA bullish catalysts
Approval of Spot Solana ETFs: The US Securities and Exchange Commission (SEC) is expected to approve spot Solana ETFs imminently, potentially by the end of October 2025. ETF approval tends to open the doors for mainstream institutional and retail investors, likely injecting billions of dollars into SOL's market and significantly boosting demand and price.
Alpenglow Upgrade: Solana's upcoming Alpenglow network upgrade, projected for Q1 2026, will transition Solana from proof-of-authority to proof-of-stake consensus. This upgrade is expected to boost transaction speeds to over 100,000 TPS and improve network scalability and security, supporting broad adoption and enhancing Solana's competitive edge over other blockchains like Ethereum.
Strong On-chain Metrics and Institutional Adoption: Solana exhibits robust on-chain activity—65,000 transactions per second, $9.3 billion total value locked (TVL) in DeFi, and 32 million unique wallets. Institutional holders currently own approximately 13 million SOL, reflecting growing confidence by major players including Visa and PayPal.
Macro-Economic Tailwinds: Expectations of Federal Reserve rate cuts encourage appetite for risk assets like crypto. Alongside improved liquidity conditions, this sets a favorable macro backdrop for SOL's price appreciation.
Whale Accumulation: Recent price dips saw large holders ("whales") increase their Solana holdings substantially, signaling confidence in a bullish recovery and potential breakout above key resistance levels ($190 to $300).
Market Position and Ecosystem Growth: Solana is a leading smart contract platform with rapid development, high developer engagement, and dominance in niches like DeFi and NFTs, strengthening its growth potential.
I dont know what else to say other than Solana crashing is coming
key demand floor
@supplyroof break and close new demand floor 211.45
@130.2- @129.5
@76.71 my choice
layer by layer.
@41.52
#solusdt #solana #crypto.

$SOL (DAILY): double PIVOT ZONE, KEY TESTCRYPTOCAP:SOL finally in a perfect spot for a POTENTIAL REVERSAL to the upside.
First of all, still a downtrending asset, but it's declined enough to start watching it closely, it just had two BULLISH retests of a nicely confluenced support level of 200 MA + an ASCENDING TRENDLINE. Also near the typical 0.786 fib retracement level ($178).
This last bounce could become a HIGHER LOW, so I'm watching the volumes for a confirmation, nothing bullish yet, but at least the selling has been easing off.
#solana will become BULLISH again above $206 and above $218, I will personally wait for a true market verification during the weekdays, apparently the #ETFs have been approved. This could be a bit of a 'sell-the-news-event'.
Break below that stacked support area with volume would suggest a BEAR MARKET for SOLANA. Just my 2 cents.
💙👽

Soul odor your sol Short-term momentum is bullish on 1m chart. Breaking the $187.00 resistance should lead to a rapid continuation move.
For long 187.10 TP 189.90
But for short 184.90 TP 182.2
A failure to hold $185.00 would confirm weakness, likely triggered by a rejection at $187.00, suggesting a push to re-test the lows of the day.

[SeoVereign] SOLANA BEARISH Outlook – October 18, 2025Today, as of October 18, I would like to share my bearish outlook on Solana.
This analysis is based on two main factors.
First — Bearish Bat Pattern
Currently, Solana has entered the PRZ (Potential Reversal Zone) of the BAT pattern.
This zone is typically regarded as a classic reversal area where selling pressure intensifies
after an excessively extended upward movement.
In particular, weakening buying momentum is observed on short-term candlestick charts,
gradually increasing the possibility of a downward reversal.
Second — Bearish 1.13 Shark Pattern
The Shark pattern, introduced by Scott Carney, is a variation of the harmonic pattern.
The 1.13 zone generally acts as a short-term overbought and exhaustion area,
often marking points where bearish reversals frequently occur.
Currently, the price is approaching this 1.13 extension zone,
which can be technically interpreted as a region with a strong likelihood of a bearish reversal.
Accordingly, the average target price is set around 176.77 USDT.
Depending on future chart developments,
I will continue to provide updates regarding position management and any changes to this outlook.
Thank you.

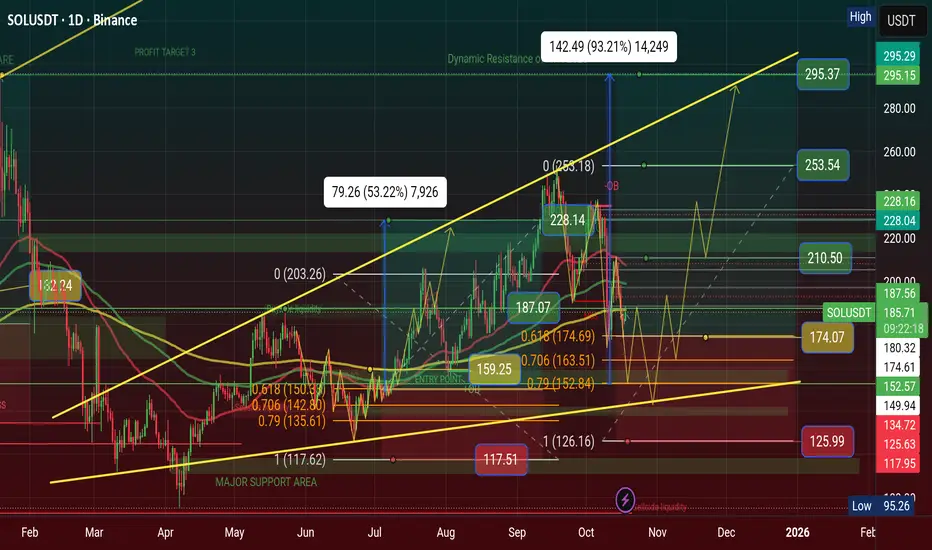
$SOL Showing Inverse Descending Triangle Pattern, $333 in 2026 CRYPTOCAP:SOL Showing Inverse Descending Triangle Pattern, $333 in 2026
💹 Inverse Descending Triangle Pattern
When This pattern will showing a chart than Price is waveing Descending Triangle Range of areas. Price will showing inverse and price moved too. we can make a trade plan to High area and low area. I'm using my Golden Fibonacci Tool, there are 3 point area of Buy position.
💲Position Setup: Open Long Position have 3 point areas, $152, $163, $174 and stoploss below area is $117. The Major Support Area is $101—$111 and Dynamic Resistance of ATH area is $293. My Long Position Target areas $210, $253, $293 and Incredible Price Target $333 areas in 2026
My Previous Long Setup will Hit $228 and complete my Trades. you can see my Previous analysis on this chart and now Waiting for confirmation of golden zone of Golden Fibonacci tool areas.
#Write2Earn #BinanceSquareFamily #Binance #SOL #SUBROOFFICIAL
Disclaimer: This article is for informational purposes only and does not constitute financial advice. Always conduct your own research before making any investment decisions. Digital asset prices are subject to high market risk and price volatility. The value of your investment may go down or up, and you may not get back the amount invested. You are solely responsible for your investment decisions and Binance is not available for any losses you may incur. Past performance is not a reliable predictor of future performance. You should only invest in products you are familiar with and where you understand the risks. You should carefully consider your investment experience, financial situation, investment objectives and risk tolerance and consult an independent financial adviser prior to making any investment.
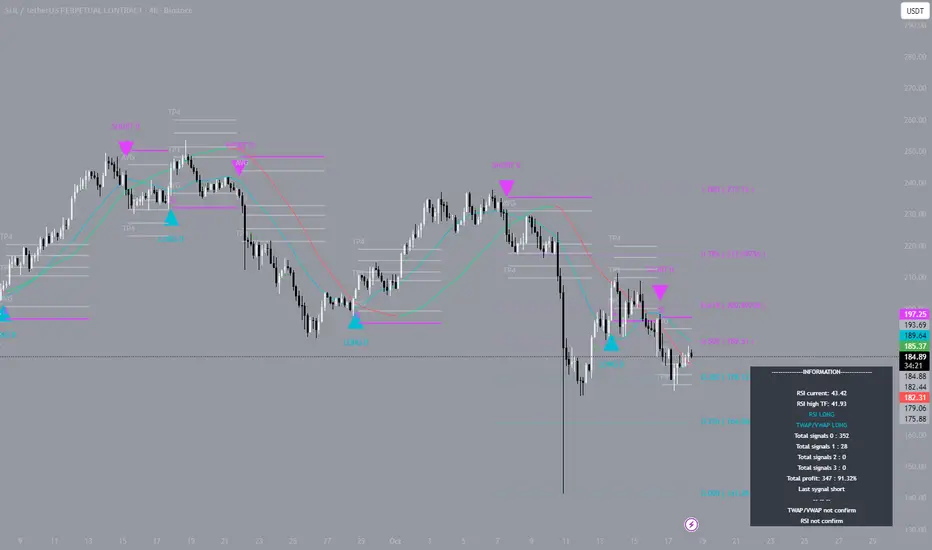
SOL: Stability in ChaosSince October 7, the Solana market has been in turbulence, with drawdowns, sharp reversals, and liquidity spikes. But it’s in periods like these that a systematic approach proves its strength. I opened the first entry on October 7 and closed it at the second take-profit level with modest 1.5x leverage. Then came a pause, and on October 13 I entered again without leverage, cautiously, locking in about 1.5% profit. It was already clear the strategy works even in a turbulent phase. When the next move began on October 16, I followed my proprietary system. The trade unfolded cleanly along the structure: four consecutive take-profit levels, about 7% profit with 2x leverage. Discipline and visual control of levels is what prevented losses.
On TradingView, over 90% of successful traders use multiple indicators at the same time, but the key is always the same: the ability to spot patterns and ignore noise. This systematization makes trading deliberate rather than an emotional chase.
Global Shadow Banking SystemIntroduction
The global financial system is vast and complex, with countless institutions facilitating the movement of money, credit, and investment around the world. While traditional banking systems — composed of central banks, commercial banks, and regulated financial intermediaries — are well known and strictly supervised, another parallel financial network operates mostly outside traditional regulatory frameworks. This network is known as the shadow banking system.
Shadow banking plays a crucial role in providing liquidity and credit to global markets, but it also introduces significant risks due to its lack of transparency and oversight. Understanding this system is vital to grasp how modern finance truly functions — both its strengths and its vulnerabilities.
What Is Shadow Banking?
The term “shadow banking” was first coined by economist Paul McCulley in 2007 to describe credit intermediation that occurs outside the traditional banking system. In simple terms, shadow banking involves non-bank financial intermediaries that perform similar functions as banks — such as lending, borrowing, and credit creation — but are not subject to the same regulatory oversight.
These entities can include:
Money market funds
Hedge funds
Private equity firms
Structured investment vehicles (SIVs)
Finance companies
Insurance companies (in certain activities)
Peer-to-peer (P2P) lenders
Securitization conduits
Investment banks (in off-balance-sheet activities)
Although they do not take deposits like traditional banks, shadow banking entities borrow funds and provide credit through instruments like repos (repurchase agreements), asset-backed securities, and commercial paper.
Origins and Evolution of the Shadow Banking System
The shadow banking system began to grow rapidly in the 1980s and 1990s, coinciding with financial deregulation and the rise of securitization. The following developments shaped its evolution:
Financial Innovation:
The creation of mortgage-backed securities (MBS) and collateralized debt obligations (CDOs) allowed banks to offload loans from their balance sheets. These securities were then sold to investors, enabling more lending without increasing regulatory capital requirements.
Regulatory Arbitrage:
Traditional banks faced strict capital and liquidity rules. To circumvent these constraints, financial institutions began creating off-balance-sheet entities, such as SIVs and conduits, that could perform similar lending and investment functions without being bound by regulatory limits.
Globalization of Finance:
As capital markets became interconnected, the shadow banking system evolved into a global network of credit intermediation. Funds flowed freely between developed and emerging markets, creating a vast pool of liquidity.
The 2008 Financial Crisis:
Before the global financial crisis, the U.S. shadow banking system grew to rival the size of the traditional banking system. However, when the housing bubble burst, many shadow banking entities collapsed due to a sudden liquidity freeze. Lehman Brothers, Bear Stearns, and various SIVs exemplified the dangers of excessive leverage and opacity.
Post-Crisis Restructuring:
Following 2008, regulators introduced measures like the Dodd-Frank Act in the U.S. and Basel III globally. Yet, the shadow system adapted — new forms emerged in fintech, asset management, and private credit markets, making the sector once again a central force in global finance.
Structure and Functioning of Shadow Banking
The shadow banking system performs credit intermediation in several steps, often involving complex chains of transactions:
Funding Sources:
Shadow banks obtain short-term funding from institutional investors, money market funds, or repo markets.
Credit Transformation:
These funds are used to purchase long-term, higher-yield assets — such as loans or securities — thereby transforming short-term liabilities into long-term investments.
Maturity Transformation:
Just like banks, shadow entities borrow short-term and lend long-term, earning profit from the difference in interest rates (the “maturity spread”).
Liquidity Transformation:
Illiquid loans are converted into marketable securities through securitization, increasing liquidity and investor access.
Leverage:
Shadow banks often rely heavily on leverage to amplify returns. This amplifies both profits and risks, particularly during market downturns.
Essentially, shadow banking acts as an alternative credit channel, fueling corporate financing, real estate investment, and consumer lending, especially when traditional banks are constrained by regulation or risk aversion.
Major Components of the Global Shadow Banking System
1. Money Market Funds (MMFs)
MMFs provide short-term financing to corporations and financial institutions. They invest in low-risk securities but can become unstable during crises when investors rapidly withdraw funds.
2. Securitization Vehicles
Entities like SIVs package loans (such as mortgages or auto loans) into tradable securities. These instruments spread credit risk across investors but can become opaque and risky when underlying asset quality deteriorates.
3. Hedge Funds and Private Credit Funds
Hedge funds engage in high-leverage strategies, while private credit funds lend directly to corporations, especially mid-sized firms that cannot easily access bank financing.
4. Repurchase Agreement (Repo) Markets
Repos are short-term collateralized loans between institutions. They are a vital funding source for shadow banks but can dry up quickly during financial stress.
5. Fintech and Peer-to-Peer (P2P) Lending
In the modern era, technology-driven platforms offer loans directly to consumers and businesses, bypassing banks entirely. These digital intermediaries are a fast-growing segment of shadow banking.
Benefits of Shadow Banking
Despite its “shadowy” reputation, the system provides several key benefits:
Credit Expansion:
Shadow banking supplements traditional lending, ensuring that households and businesses have access to credit even when banks tighten lending standards.
Market Liquidity:
By transforming illiquid assets into tradable securities, it enhances market depth and efficiency.
Innovation and Competition:
Shadow banks often pioneer financial products and technologies that traditional banks later adopt.
Diversified Funding:
Companies can raise funds through multiple channels, reducing dependency on commercial banks.
Global Capital Mobility:
Cross-border shadow banking allows global investors to access emerging market opportunities, promoting financial integration.
Risks and Challenges
While shadow banking provides flexibility and liquidity, it also poses significant systemic risks due to its structure and lack of oversight:
1. Lack of Transparency
Many shadow banking activities occur off-balance-sheet, making it difficult for regulators and investors to assess true risks.
2. Leverage and Liquidity Mismatch
Borrowing short-term to fund long-term assets creates vulnerability to sudden funding withdrawals — the same dynamic that triggered the 2008 crisis.
3. Contagion Risk
Although shadow banks are “non-banks,” they are deeply interconnected with the traditional financial system through repo markets, derivatives, and investment linkages. A shock in one sector can rapidly spread across the financial network.
4. Regulatory Arbitrage
Since shadow banks operate outside strict capital rules, they may engage in riskier behavior for higher returns, undermining the purpose of banking regulations.
5. Market Volatility
Shadow banks often amplify boom-and-bust cycles through speculative trading and leveraged investments.
6. Moral Hazard
Investors might assume that shadow banks, like regular banks, will receive government support during crises, encouraging excessive risk-taking.
Global Distribution and Scale
According to data from the Financial Stability Board (FSB), the global shadow banking system — or “non-bank financial intermediation (NBFI)” — manages over $60 trillion to $70 trillion in assets. Major regions include:
United States: Dominates global shadow banking through investment funds, securitization, and repo markets.
Europe: Hosts large asset management and insurance-linked shadow banking entities.
China: Rapidly expanded shadow banking via trust companies and wealth management products, though regulatory tightening has slowed growth.
Emerging Markets: Growing involvement through fintech lending, private credit, and offshore investments.
This vast scale means that shadow banking now accounts for nearly half of global financial assets, making it indispensable — but also potentially destabilizing.
Regulatory Responses and Reforms
Post-2008, global regulators recognized the need to monitor and manage shadow banking risks more effectively.
1. Financial Stability Board (FSB) Framework
The FSB introduced a global framework to track and regulate non-bank financial intermediation. It classifies entities by their risk profile and potential for systemic impact.
2. Basel III and Capital Requirements
Stricter capital and liquidity rules for banks have indirectly reduced risky off-balance-sheet exposures, though some activities migrated further into the shadows.
3. Dodd-Frank Act (U.S.)
Improved transparency for derivatives, money market funds, and securitized products, requiring higher disclosure and stress testing.
4. European Union Regulation
The EU introduced the Alternative Investment Fund Managers Directive (AIFMD) and Money Market Fund Regulation to supervise hedge funds and MMFs.
5. China’s Crackdown
Since 2017, China has aggressively regulated its shadow banking sector, consolidating wealth management products and reducing trust loan exposures.
Despite these measures, the system remains dynamic and elusive, constantly evolving to exploit new loopholes or technological innovations.
The Role of Fintech and Digital Shadow Banking
The rise of fintech, cryptocurrencies, and decentralized finance (DeFi) has ushered in a new era of shadow banking. These platforms offer credit, trading, and yield generation outside traditional supervision.
Examples include:
Stablecoins acting as quasi-deposits.
Crypto lending platforms mimicking traditional money markets.
Decentralized protocols providing automated liquidity and lending.
While innovative, these systems introduce fresh risks — from cybersecurity and fraud to the absence of legal recourse — that mirror early shadow banking vulnerabilities in new digital forms.
Future Outlook
The global shadow banking system is unlikely to disappear. Instead, it will continue to evolve and expand, driven by three forces:
Financial Innovation:
As new financial technologies emerge, shadow banking will adapt to meet the demand for alternative funding and investment products.
Regulatory Gaps:
Tighter banking regulations often push activities into less-regulated areas. Unless global oversight becomes more comprehensive, risk migration will persist.
Investor Demand for Yield:
In an environment of fluctuating interest rates and low returns, investors seek higher-yielding products — a demand that shadow banks readily fulfill.
However, global financial stability depends on balancing innovation with regulation. Enhanced data sharing, transparency requirements, and coordinated international supervision are essential to prevent another systemic crisis.
Conclusion
The global shadow banking system represents both the ingenuity and the fragility of modern finance. By providing liquidity, credit, and market flexibility, it complements traditional banking and fuels economic growth. Yet its opacity, interconnectedness, and potential for contagion make it a double-edged sword.
As the boundaries between banking, capital markets, and technology blur, understanding and regulating shadow banking is one of the most important challenges facing policymakers and investors today. The key lies in ensuring that the system’s light — innovation and liquidity — is not overshadowed by its dark side of hidden risk and instability.

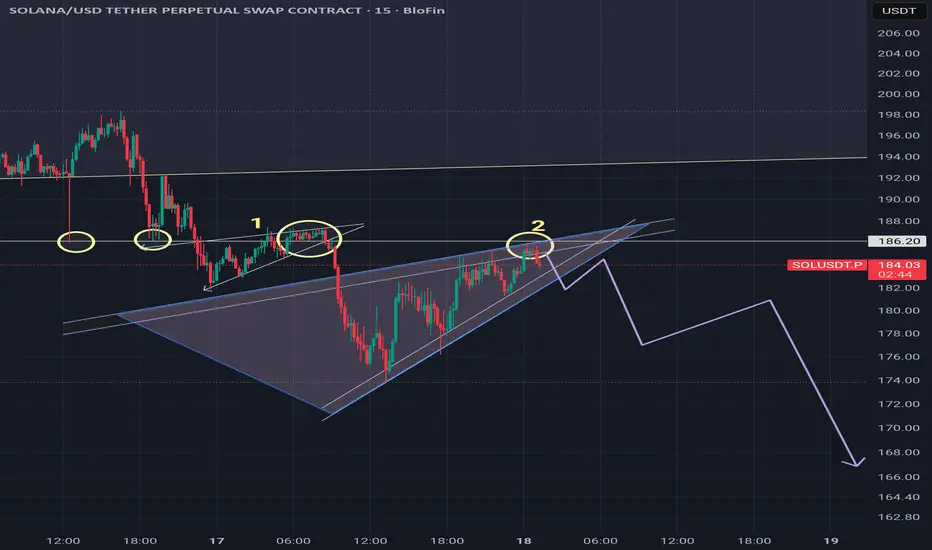
Sol Decreasing! ScenarioVol 1. Scenario
Ascending wedge worked well on the left of the screen.
If the same panter works price will drop as the screen you see.
sol longAfter taking sellside liquidity, price shifted structure and formed a bullish order block (+OB) in discount. A clear market structure shift (MSS) followed by multiple breaks of structure (BOS) confirms bullish intent.
Currently trading within the fair value gap (FVG) and showing displacement above short-term highs — expecting continuation toward the next buyside liquidity zone around 198.17.
Bias: Bullish
Sellside liquidity swept ✅
MSS + BOS confirmed ✅
+OB and FVG holding as support ✅
Alligator MAs showing early momentum alignment ✅
As long as SOL maintains structure above 183, I’m looking for expansion into the premium side of the range targeting 198+.
#SOL #SOLUSDT #ICTConcepts #SmartMoney #OrderBlock #Liquidity #CryptoTrading #FVG

TA on SolanaWeekly chart shows CRYPTOCAP:SOL hitting major support. We need to stay above these levels to avoid dropping further.

TradeCityPro | SOLUSDT Ready for a Sharp Drop!👋 Welcome to TradeCityPro Channel!
Let’s start today’s review with Solana (SOL) — one of the strongest and most recognized altcoins in the entire crypto market. Known for its high-speed transactions, low fees, and growing DeFi and NFT ecosystem, Solana has consistently been among the top performers in every bullish cycle. But like the rest of the market, it hasn’t been immune to the recent wave of volatility and corrections.
🧩 Market Context
Over the past few days, the market has experienced a strong correction phase, mostly triggered by the uncertainty coming from global financial news and risk-off sentiment among investors. Solana, which was trading comfortably above 217.77, saw a sharp drop from that level, leading to a decline toward the 176.15 support zone — a key area where buyers have historically shown strong interest.
At the moment, Solana is oscillating within this support range, attempting to stabilize after the drop. This phase is quite crucial because it determines whether the market is preparing for another leg down, or if it’s about to build a base for recovery.
📉 Bearish Scenario (Short Setup)
If the market sentiment remains weak and 176.15 fails to hold, we can expect another sharp downward move.
The key here is to wait for confirmation — specifically, a break and close below 176.15 with strong volume.
To increase accuracy and reduce risk, it’s better if this breakdown happens after forming a lower high, showing that sellers are gaining control again.
In that case, traders could open a short position, targeting the next support areas below — possibly near 165–160 depending on the momentum of the move.
📈 Bullish Scenario (Long Setup)
On the other hand, if Solana continues to range around this zone or performs a fake breakdown (fakeout) below 176.15 and then quickly reclaims it, this would be a strong bullish signal.
Such a reaction often indicates that smart money is accumulating positions while shaking out retail traders who panic sell at the bottom.
Considering Solana’s overall bullish structure on higher timeframes (Daily and Weekly), a fakeout recovery here could set the stage for a trend continuation move to the upside.
In that case, once price breaks above the short-term resistance — typically around 185–190 — traders could consider long positions with targets toward 200–210.
🎯 Summary
🔴 Short Setup:
Wait for a confirmed breakdown below 176.15
Ideally after forming a lower high
Target range: 165–160
🟢 Long Setup:
Watch for a fakeout or range continuation around 176–180
Confirmation: breakout above 185–190
Target range: 200–210
💬 Final Thoughts:
Solana remains one of the most technically strong and fundamentally solid projects in the market.
While short-term volatility is high, these kinds of deep corrections are often opportunities for disciplined traders to position themselves before the next major move.
Patience, confirmation, and proper risk management are key here — the chart will soon reveal whether SOL is ready for another leg up or a deeper retracement.

sol-usdtYesterday I said that if it breaks $200, it will go up, but it didn't confirm the break 🕯
It currently has a valid support of $177, so I don't think it will break easily.

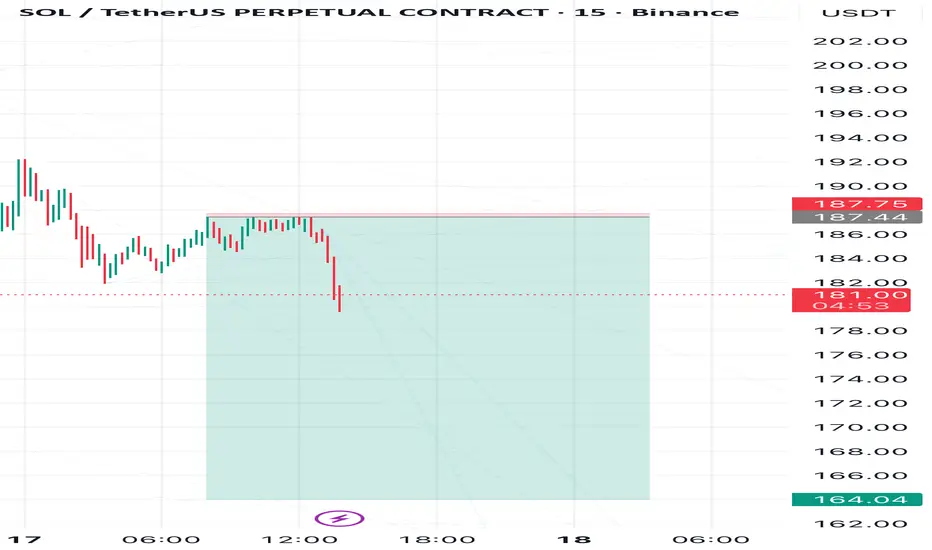
SOL Bears Still in Control — Eyes on 164Solana has repeatedly confirmed its plans to move lower toward the 164 level.
The 187.4 level is a particularly strong support, so a breakout above it would mean the plan is invalidated.
Follow me for consistent technical analysis on Solana