An importance of funding rateSee the chart and check funding rate on your exchange. As soon as exchanges put funding rate to +0.01% price tends to go downwards. So close your long positions during these events.
#trends
Trade ideas

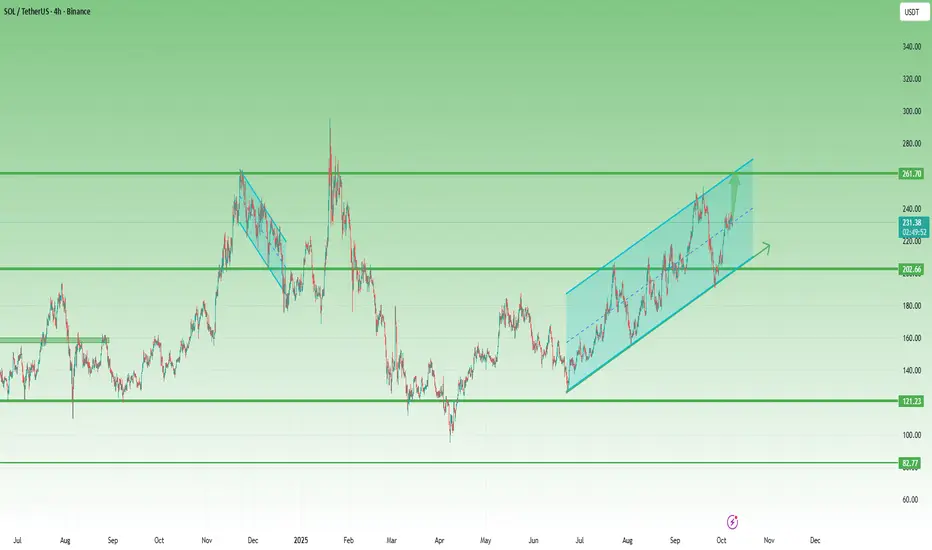
Solana in an Ascending Channel – Bulls Must Hold Above 215After the strong correction from 300 to below 100, Solana finally started to recover. Following an impressive 90% rebound, the price corrected again but managed to form a higher low just above the 120 support zone — a constructive signal for medium-term buyers.
Since then, Solana has been trading inside an ascending channel, showing consistent bullish control with well-defined higher highs and higher lows.
Recently, the market spiked slightly below 200, only to confirm the lower boundary of this channel before bouncing back.
In my previous SOLUSDT analysis, I mentioned that it was imperative for bulls to hold the 200 level to validate the ongoing reversal structure — and that’s exactly what happened. The market respected this support zone perfectly, leading to a 15% advance since then.
At the time of writing, Solana is consolidating near the midline of the ascending channel, suggesting a temporary pause before the next potential leg higher.
If this consolidation breaks to the upside, the next key target for bulls is 260, a confluence resistance formed by the upper boundary of the channel and the November 2024 swing high.
________________________________________
🔹 Summary
• Strong support: 200 (confirmed)
• Ideal bullish threshold: Above 215
• Next resistance: 260 followed by 300
• Structure: Ascending channel – continuation pattern
________________________________________
In conclusion, Solana remains bullish while holding above 200, but ideally, the price should stay above 215 to preserve upside momentum.
A breakout above 240 would likely trigger a test of 260 followed by 300, which becomes very probable— the next key resistance zone. 🚀
SOL/USDTCRYPTOCAP:SOL has clearly formed a double bottom pattern, signaling strong reversal momentum. The target aligns with the end of the blue arrow, and once confirmed, it’s set for an explosive move to the upside.

SOL Long ScalpTimeframe 15m
Konservatif = Waiting for reject candle (Bullish Engulfing/Green Hammer)
Aggressive = Limit Order

SOL-USDTFailure to break $265 🔽
And on the other hand above the bottom of $226🔼
Let either the resistance be broken for a buy
Or the support number I mentioned be lost for a sell on Solana 🔽💲

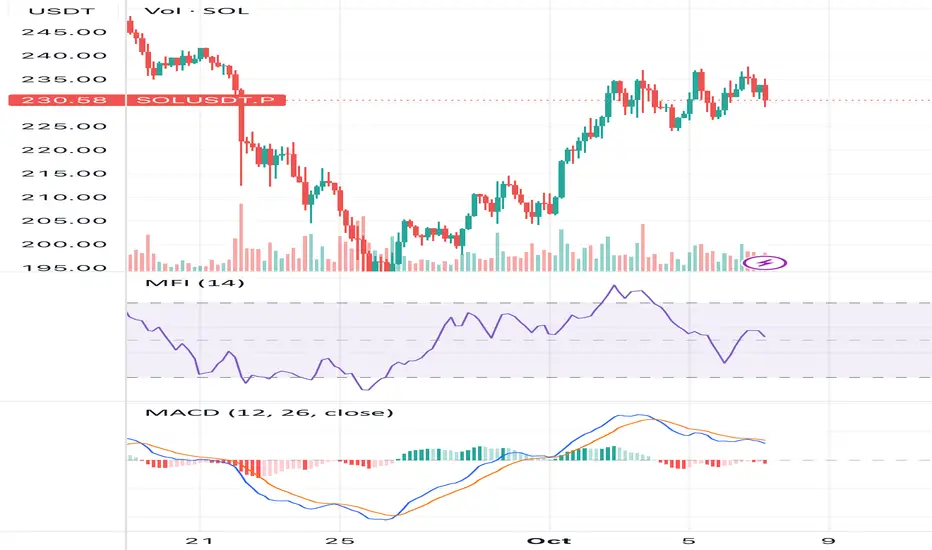
Triggers: 4h-close below 235 and/or < 230.9 (Don20-Mid) with RSIWhat does it mean now
1. The structure is "bullish but thin": the price is at the tops of Donchian/BB/Keltner, ADX ~33 and CMF>0 confirm the trend, but the MACD-hist −0.11, a series of bearish divergences (RSI/MFI/OBV), and a low OI (z −1.34) indicate that the momentum is going without a noticeable set of futures positions.
2. Squeeze ON ~13 bars: the market is compressed, and an impulse exit is likely.
3. Profile: a strong HVN core of 202-208 (POC ~207.9), we are trading above, VAH ~239.7 near the current price → above the supply zone.
4. Premium to VWAP ~+1.1σ: there is upward space, but it is already "not cheap" relative to average demand.
⸻
Key levels
• Resistance: 237.75 (Donch-High 20/55) → 239.66 (VAH) → 244.9–245.0 (LVN-thin zone).
• Supports: 235–231 (BB/EMA20/Don20-Mid 230.9) → 224.0–221.2 (BB-/KC-low) → 207.9 (POC) → 202–208 HVN-cluster → 197.9 (Don55-Low zone of the upper range).
⸻
Scenarios and triggers (not financial advice)
A) Basic — rotation/balance above the averages with a check of 230–232
Why basic: Squeeze ON, MACD goes out, divergences are bearish, and OI is low — more often, the market "chews" the level before choosing a direction.
• Triggers: 4h-close below 235 and/or < 230.9 (Don20-Mid) with RSI<55 / MACD weakening, without OI growth.
• Targets: 231 → 224–221 (edge of bands/channels). Deeper — retest 207–208 (POC/HVN) if the impulse fades.
• Invalidator: quick return and fixing > 237.8.
B) Pulse break-up (Squeeze-release)
• Trigger: 4h-closing > 237.8 + buffer ≈ +0.1·ATR ≈ +0.45$ (i.e. > 238.25) and holding above 237.8 at CMF≥0, OBV↑, preferably OI↑.
• Targets: 239.7 (VAH) → 244.9–245.0 (LVN) → with good OI, expand to higher levels.
• Invalidator: return < 235 on increased volume.
C) Bearish reversal from VAH/Don-High
• Trigger: rebound from 237.8–239.7 with 4h-close < 235, RSI↓, MACD-hist in the red, OI↑ on the red candle (inflow of shorts).
• Targets: 230.9 → 224–221 → 207–208.
• Invalidator: re-capture > 238.3 with OI not falling.
⸻
Tactics (example of logic)
• Pullback long (conservative): monitor demand in 231–232 (candle reaction + CMF≥0, OBV↑). Stop — below 224-221, targets — 235 → 237.8 → 239.7.
• Impulse long (aggressive): after 4h-close > 238.25 (breakdown with buffer), partial fixation at 239.7, trail to 244.9–245.0.
• Countertrend short: only with a clear rejection in the 237.8–239.7 zone + confirmation (RSI/MFI down, MACD-histo < 0, OI↑). Targets are 235 → 230.9 → 224–221; stop is at ~240–241.
⸻
Briefly: what to expect
• Base: consolidation/rotation in 231–238 with a risk of moving to 224–221 until momentum and OI confirm a breakout.
• If we gain a foothold above 238.25, we can expect an upward move to 239.7 → 244.9–245.0.
• If we lose 230.9, we can expect an upward move to 224–221, and if we are weak, we can expect an upward move to 207–208.
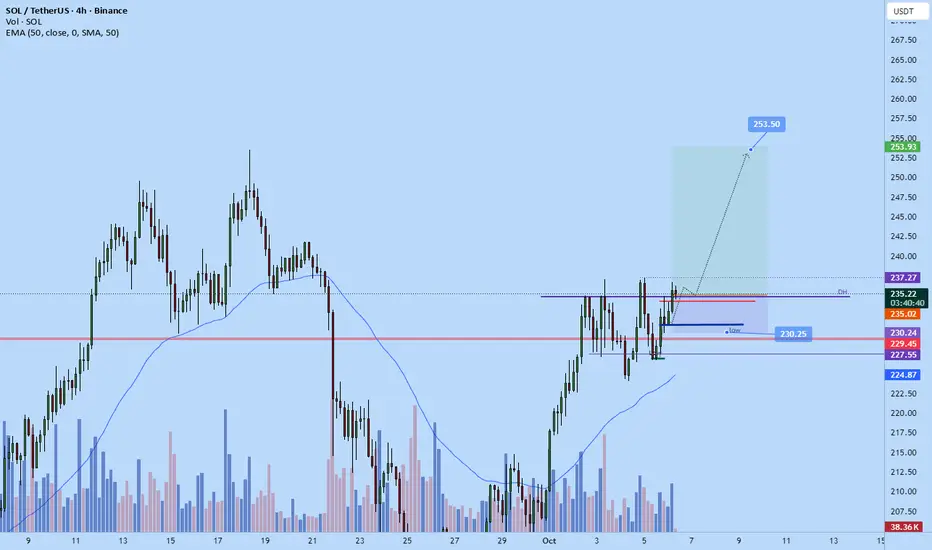
solana swing long back to ATHOpened up a swing long position a while ago on solana. Slowing down on the intraday trades and scalps for now as the market been getting too volatile for me.
Sl: 230.25
Exit limit order set to : $253.5
Roughly 4RR from current entry.
Long the king, and short the "Sol" Jack ?Being long Bitcoin is being long on a healthy market rally with BTC.D bouncing, and therefore Bitcoin leading.
If BTC.D bouncing means an overall retrace on the market, I think Sol makes a good candidate for a short position to target 150s
I think the DATs and the ETF narratives are getting pretty exhausted, and that could make an extra argument, even if this is the part where it gets tricky (timing tops is hard).
Still, i think playing this with 30/40% of the Bitcoin long is EV+
Game on!

SOLUSDTSOLUSDT
I expect the price to go to 250 zone, the latest hh and if the price is not making a new hh then i expect the price to go down to 212 zone and bounce from there if the support stay.


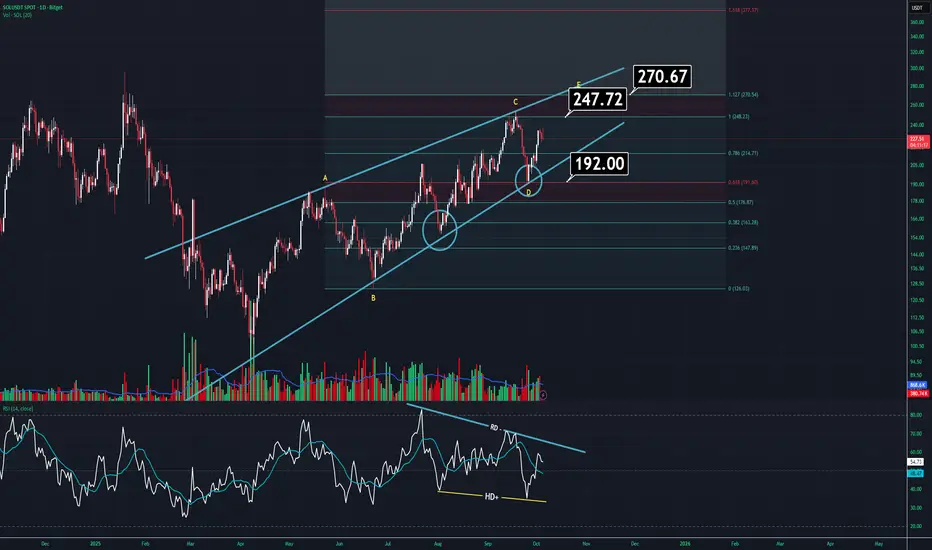
SOLANA UPDATE (1D)SOL is currently at a decision point, mainly due to both the ongoing recession and the delayed ETF approvals.
On the daily chart, it’s getting squeezed inside a large wedge pattern. Normally, it should make one more top before breaking down. However, just to be clear — if price drops below 192, there’s a strong possibility of a sharp sell-off. That’s where both the character shift and wedge breakdown would occur.
Some additional details:
Volume is flat and indecisive. It’s moving in line with the wedge, which isn’t a great sign. Typically, this kind of volume behavior is seen during wedge formations.
The RSI looks unusual — there are both negative and hidden bullish divergences. If you’re wondering which one matters more, it’s the hidden bullish divergence — it’s the stronger signal here.
If the recent high is broken, we could see SOL climbing towards the 270 region, after which we’ll know whether the wedge remains valid. However, in general, the outlook doesn’t look too strong at the moment.
$SOL Analysis🚨 CRYPTOCAP:SOL Analysis 🚨
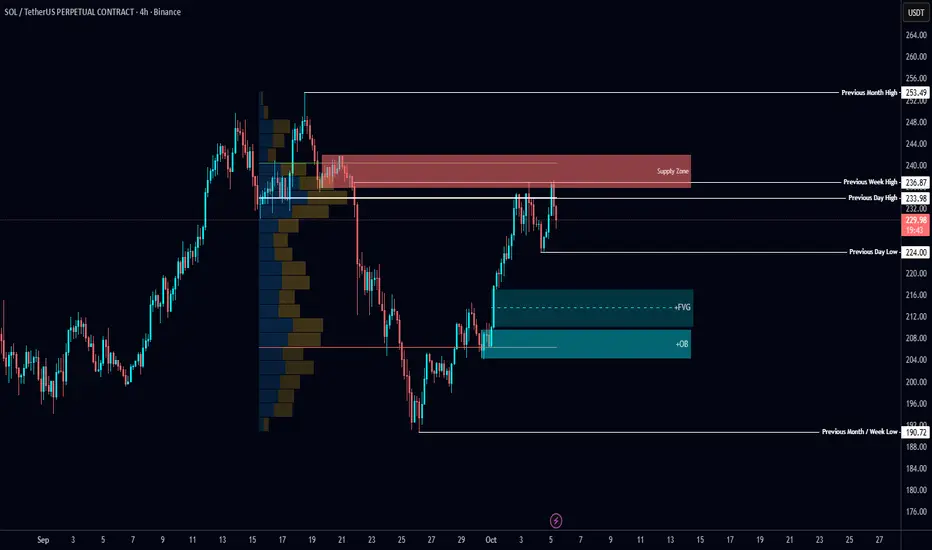
CRYPTOCAP:SOL tapped the Supply Zone and swept previous week’s high for liquidity 👀
Now trading below POC.
⚡ If this flips, an easy path opens to the previous month’s high.
📉 Otherwise, I’ll wait for confirmation to short and target bullish OB + FVG levels below.

TradersCity Pro | Solana Bulls Eye Breakout Beyond Resistance👋 Welcome to TradeCity Pro!
In this analysis, I’ll be breaking down Solana (SOL),one of the most popular “Ethereum Killer” projects, currently ranked #6 on CoinMarketCap with a market cap of $122.87B.
⌛️ 4-Hour Timeframe
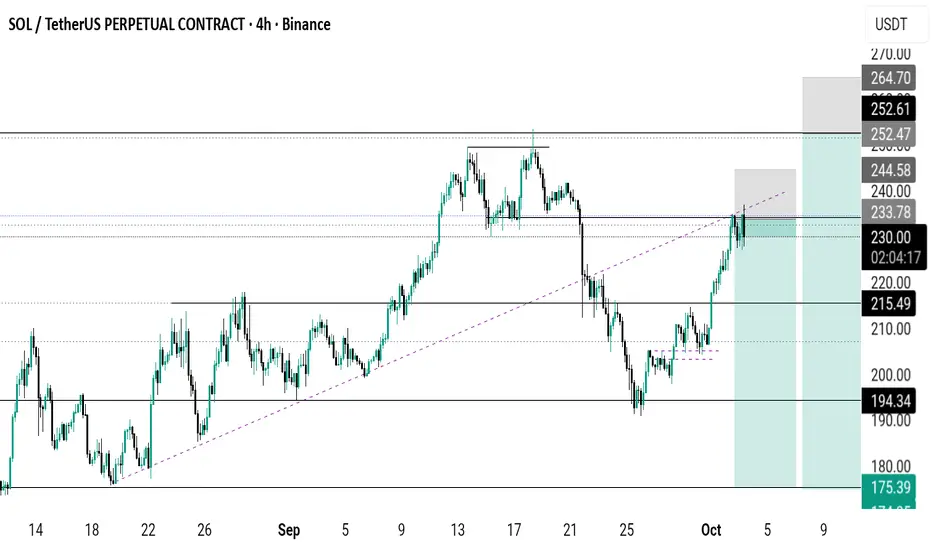
On the 4-hour chart, Solana started a bullish move after being supported at the $194 zone. Once it broke the trigger at $213.14, it rallied strongly toward the next resistance zone I’ve marked on the chart.
✨ At the moment, that bullish wave has cooled off. The RSI has exited the overbought zone, and price has been rejected from the resistance ceiling.
✔️ The next bullish trigger we’re watching will be a clean breakout of this resistance zone. On future retests, we can identify the exact resistance level more precisely and use it as an actionable entry trigger.
⭐ The main resistance for SOL is at $248.58. A breakout here would confirm the start of a larger bullish wave in the higher cycles. That’s why it’s important to already have a position before this breakout—so if the level flips, you’re not left behind and your earlier long runs into solid profit.
🔍 If price pulls back, the outlook remains bullish as long as SOL stays above $213.14. In that case, I see more probability for the next bullish leg than for a trend reversal.
📊 However, if $213.14 breaks and price consolidates below it, that would be the first confirmation of a bearish shift and a possible trend reversal.
📝 Final Thoughts
Stay calm, trade wisely, and let's capture the market's best opportunities!
This analysis reflects our opinions and is not financial advice.
Share your thoughts in the comments, and don’t forget to share this analysis with your friends! ❤️

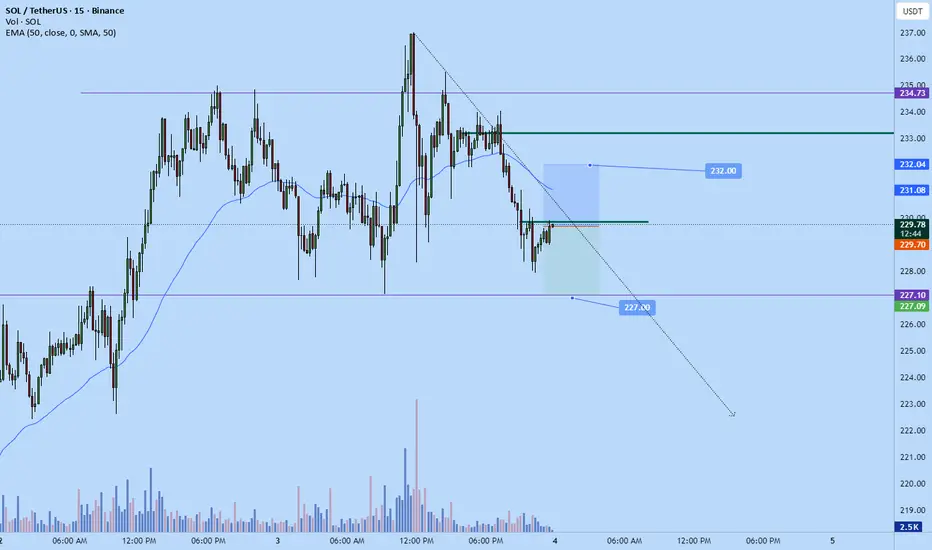
Sol scalp shortJust went short on sol
Scalping to $227
1:1
Sl: 232
Market correcting on daily tf. Likely will push down to $227 before any continuation back up
Solana long to $253.5Solana long to $253.5
Sl: 225.7
Tp: 253.5
Anticipating trend continuation back to the highs soon


SOL: Ready for a Big MoveWe can see CRYPTOCAP:SOL is currently in a period of accumulation, just like it was back in 2021 before a massive rally . The key rising support line has been holding up strong, and after periods of accumulation, the price has consistently exploded upwards, reaching new highs.
Right now , the price is approaching its previous all-time high (ATH), and if history repeats itself, we could be in for another "boom" phase. The price is holding well above the key support, which strengthens the bullish outlook.
Keep an eye on the price action around the ATH level, if we break through, it could signal the next major leg up. This setup looks very similar to past accumulation phases that led to significant price jumps.
#PEACE
Stay tuned for more updates

SOLGetting ready to ride
We saw a big pump on crypto following BTC rise and we are slowing down
If I get this then I'm riding sol all the way
Let's see how BTC plays out
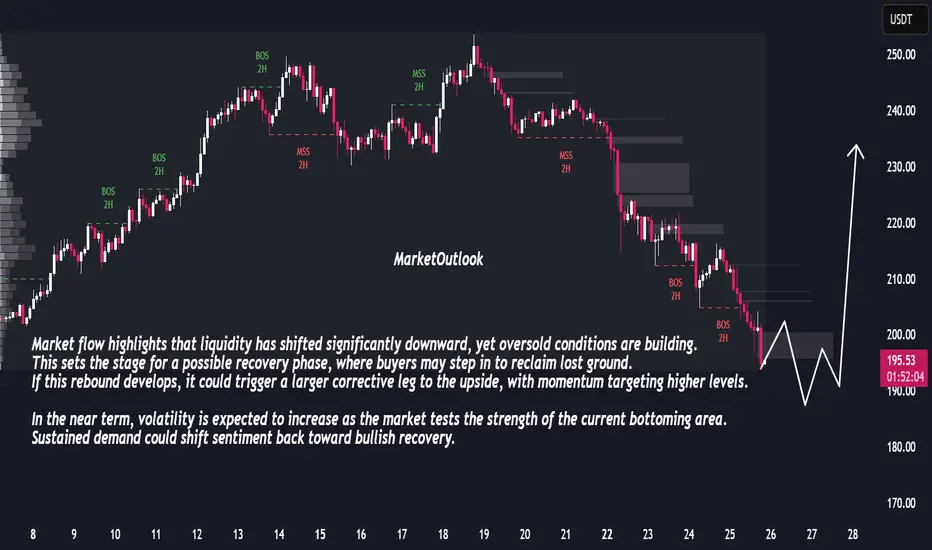
Bullish Reversal Ahead: Market Prepares for Sharp RecoveryThe market has been under consistent selling pressure, with a clear sequence of bearish breaks in structure confirming downside control. Price has now entered a zone where momentum shows signs of slowing, suggesting potential exhaustion in the recent decline. The sharp extension lower indicates that sellers may be reaching a short-term limit, creating conditions for a corrective rebound.
Market flow highlights that liquidity has shifted significantly downward, yet oversold conditions are building. This sets the stage for a possible recovery phase, where buyers may step in to reclaim lost ground. If this rebound develops, it could trigger a larger corrective leg to the upside, with momentum targeting higher levels.
In the near term, volatility is expected to increase as the market tests the strength of the current bottoming area. Sustained demand could shift sentiment back toward bullish recovery.
Solana SOL price analysis📞 Rumor has it that as soon as the global geopolitics reach a “temporary lull”, the following ETFs will be launched
Solana ETF is the most likely to be the next one (but there are at least 2 coins more on the list, which we will talk about in the coming days)
🪙 So, are you ready to buy CRYPTOCAP:SOL in your investment portfolio? For example, in the range of $117-123
🤖 Maybe we need to launch a long trading bot OKX:SOLUSDT so that it can buy in micro portions on the current possible price correction to get a “tasty price” as a result
◆ Would you like to join such a trading bot and copy them?
◆ And then compare the results with all “ETF candidates”
_____________________
Did you like our analysis? Leave a comment, like, and follow to get more

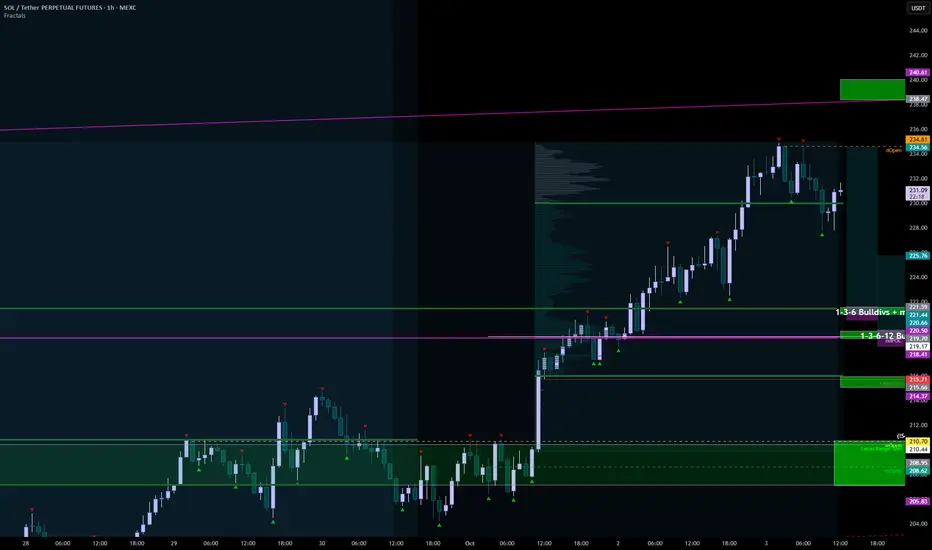
SOL 03.10At 3 AM (when else, only when we're sleeping) R1 reacted, with weakness in beardivs + mfd divs 1-3-6-12-24m, and corrected by 3%.
BUT
1) they left almost equivalent positions,
2) the daily session closed almost without a shadow above,
3) there are no diversifiers on the indicator, and there are fat mfds on mfd 1h and higher.
I think we'll go to 240, but there's a slight correction right now. At 240, it will be possible to part-take profit from the main long from 192. But how and when we'll get there is unclear. If Bitcoin starts to move into the 117-115 zones today within the console, Salt could even move from the current levels to the key support zone around 210, but for now, it needs to lose another 220 and 216 to do so.
Support zones:
221-221.5
219-219.6
215-215.9
207-210.7
Resistance zones:
238.4-240
255-256.4
SOLANA LONG SETUP Liquidity Run: BTC & ETH swept lows to take out stops.
SMT Divergence: SOL held strong while majors dipped → bullish imbalance.
Bullish Order Block (OB): Price is rejecting from a demand zone after the SMT confirmation.
Fair Value Gap (FVG): Above current price, likely to be rebalanced as SOL seeks higher prices.
🎯 Bias: Bullish on SOL
Entry: Off the OB rejection after SMT confirmation
Target: 240+ (premium array)
Invalidation: Below 228 (sell-side liquidity)
