Buy/Sell (long/short) areas for major cryptos part IIIthis is a continuation of the successful part II analysis:
note for this part III is that the green zone mid october which it seems to be a good bottom for future red zones.
November looking like a potential full green month, maybe we see a good run around then.
gl
Trade ideas

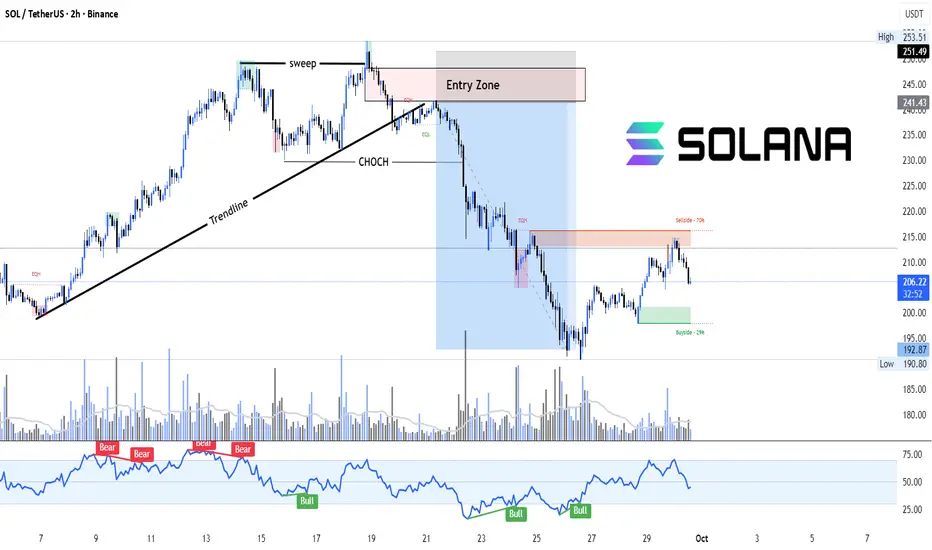
SOL: From Sweep to Selloff – Supply in ControlSolana (SOL/USDT) recently broke below a strong trendline after a liquidity sweep and clear Change of Character (CHOCH). Price retested the supply zone (Entry Zone) before continuing its downward move, showing a classic bearish market structure shift.
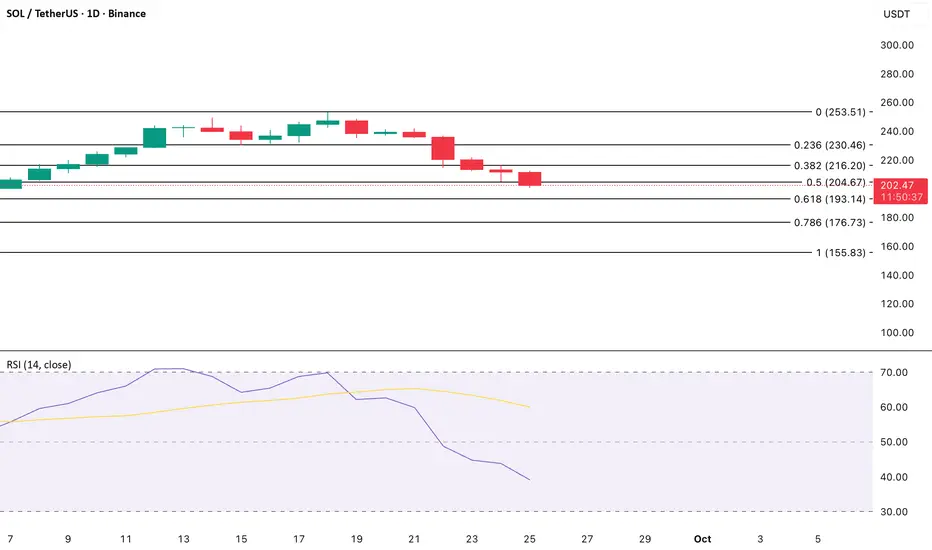
Currently, price is reacting from a sell-side zone (~70% retracement), with potential downside targets toward the buy-side liquidity (~29% retracement). RSI also reflects bearish divergence confirmation from the highs, aligning with the structural shift.
Key Highlights:
Engulfing candle + Trendline break + CHOCH confirmed bearish bias.
Entry Zone retest offered high-probability short setups.
Current rejection from supply signals further downside.
RSI divergence strengthens bearish case.
Solana rising wedge tests trendline support ahead of macro catalStructure: After a strong multi‑month rally, SOL is coiling in a rising wedge. The price sits above a key ascending trendline but below a descending resistance line from its recent peak.
Momentum: Moving averages are converging and volume has tapered off, suggesting momentum is slowing.
Key triggers: A clear breakout above the descending resistance would signal renewed strength; a breakdown through the trendline could extend the pullback toward lower support.
Risk factors: Macro events—non‑farm payrolls, the monthly inflation report, and the late‑October Fed meeting—may trigger volatility across markets.
Trade idea:
Bullish: Wait for a daily close and retest above the wedge; use stops below the recent swing low; aim for the next major resistance zone.
Bearish: Watch for a close below the ascending trendline; short a retest of that level with stops above; target the next demand area.
Reminder: Manage risk carefully and adapt as market conditions evolve.

[SOL] ATH HuntingAfter massive liquidations on the crypto space, I am willing to add to my long here and definitely on CRYPTOCAP:SOL since it's my biggest position (and winner).
Great Trade !
Sol market snapshotIf SOL cannot break above 245, there is a chance of forming a reversal pattern — Head and Shoulders (H&S). The right shoulder should not exceed the head.
Main conditions of the Head and Shoulders pattern:
Three peaks:
Left shoulder — the first local peak formed after the price rises.
Head — a higher peak following the left shoulder.
Right shoulder — a peak approximately at the same level as the left shoulder, formed after the decline from the head.
Neckline:
Connects the lows between the left shoulder and the head, and then between the head and the right shoulder.
The neckline can be horizontal or slightly sloping.
A break below the neckline confirms the pattern and signals a potential price decline.
Volume:
Volume is often high at the left shoulder, may be higher or lower at the head, and usually decreases at the right shoulder.
Declining volume during the formation of the right shoulder strengthens the bearish reversal signal.
Movement after the breakout:
After breaking the neckline, the price is expected to fall approximately the same distance as from the neckline to the head’s peak.

SOL TA 29.09The sectors are already 10% away from the important zone, and I don't see any signs of a decline from the current level. The most important resistance is R1 (211-212.5) – if we break it, there's a high chance we'll finally be able to renew the ATH. After R1, the nearest normal resistances are at 235-240.
The closest vital support zone is still relevant – 190-193. There's nothing particularly significant before it, just a couple of local minor ones, but they could trigger further growth.

SOL LONG : Time for $300?Pullback to 0.618 fib complete.
Looks like it's time for another leg up. Is it time to test $300 for SOL?.

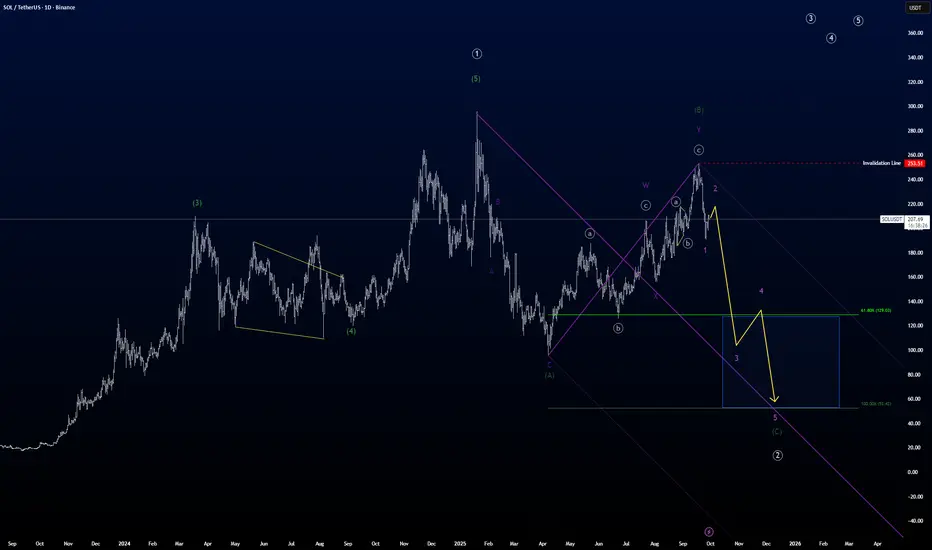
SOL is messy but is going through a correction.SOLs last move up in white primary ((1)) was not as large compared to the move up prior to that, which we can't see on the picture. So I guess we still have a large 3rd of a 3rd to come in a move up.
But first we still need to finish this correction SOL is in right now.
I believe SOL is doing a flat correction in a primary degree, so it takes some time to get through.
It looks like the green (B) wave is finally done, and now we just need the green intermediate (C) to finish. The 1st wave of that c-wave is almost over if not already, so anticipate a correction up in purple 2nd wave.
When that 2nd wave is done, SOL will move into a strong move down in wave purple 3 following the yellow path.
double (()) indicates circle on chart.

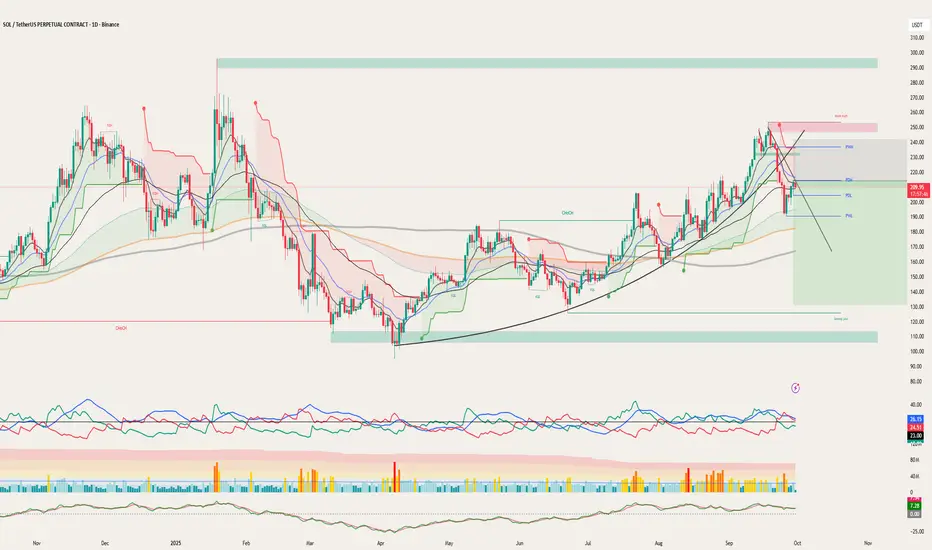
SOLUSDT 1D - Bulls back in control with Golden Cross and channelOn the daily chart, SOLUSDT is forming a bullish continuation structure. After the Golden Cross (MA50 crossing MA200), the price is now pulling back toward the midline of the ascending channel and the 0.5 Fibonacci level at 166.38. This confluence with the broken trendline and 200 EMA makes this zone a prime technical area of interest.
Support: 166.38 (0.5 Fibo), EMA200 (161.77), broken trendline
Resistance: 182.84–189.67 (Fibo 0.705–0.79), 206.54, target - 255.93 (Fibo 1.618)
This retracement looks healthy, supported by higher volume during the prior bullish leg. As long as the 166.38–161.77 zone holds, continuation toward 206.54 and potentially 255.93 is on the table.
Fundamentally, Solana remains a key L1 narrative with strong traction in DePIN and AI-linked dApps. The rising TVL and investor sentiment support the trend.
Watch price action around 166 for confirmation - this is the battleground.

SOL/USDT 1D chart review 1. General trend
• A strong upward trend has been underway since June (orange trend marked).
• Recently, we had a very strong rally to around USD 250, but there was a violent correction.
2. Support and resistance
• resistance:
• USD 214 (local resistance, the market has bounced down here).
• 230 USD (strong resistance).
• USD 250 (peak, main resistance).
• Support:
• USD 193 (here the price is currently fighting).
• 176 USD (another strong support - earlier consolidation).
• USD 158 (key support, fracture could mean a change in the trend).
3. STOCHASTIC RSI
• Currently in the sales zone (nearly 0) → may suggest that the market is approaching a local hole and a potential reflection.
4. Scenarios
• Bullish:
If support is supported at 193 USD, possible reflection in the direction of USD 214, and after breaking this level - an attack on USD 230.
• Bearish:
If the price pierces $ 193 down, the next goal is 176 USD, and below even USD 158.
5. Summary
• The market is in correction after strong height.
• At the moment, the key level is 193 USD. Maintaining this support can be reflected.
• However, breaking 193 will open the road to 176.
• RSI shows the sale → short -term relief.

..../..../ SOLUSDT ..../..../..../..../..../..../so this is how i think i analyse with price action and i like to see how do you think so LEAVE A COMMENT
also be carefull now market is risky now we tought btc will go up but now we are going bearish but there is still a little hope that btc go up NOW and we are hiting some important support if we brake them we gonna have a whole new trend with a whole new plan
take care

$sol long SOL/USDT | LONG Position Active
Chart Time: Sep 26, 2025 | 09:56 UTC-4
Just entered a LONG position on SOL/USDT.
Current levels to watch:
Entry Zone: Around $192 - $196
Near-term Target: $215.02 (+21.0% from entry)
Key Support: $192.69 - $194.74
Price is showing strength after consolidating near the $195 region. The setup suggests momentum building toward the $215 resistance level.
Will monitor closely for any break above $199 for confirmation of continuation.
Risk Disclaimer: Trade with caution, set stops, and manage risk accordingly.

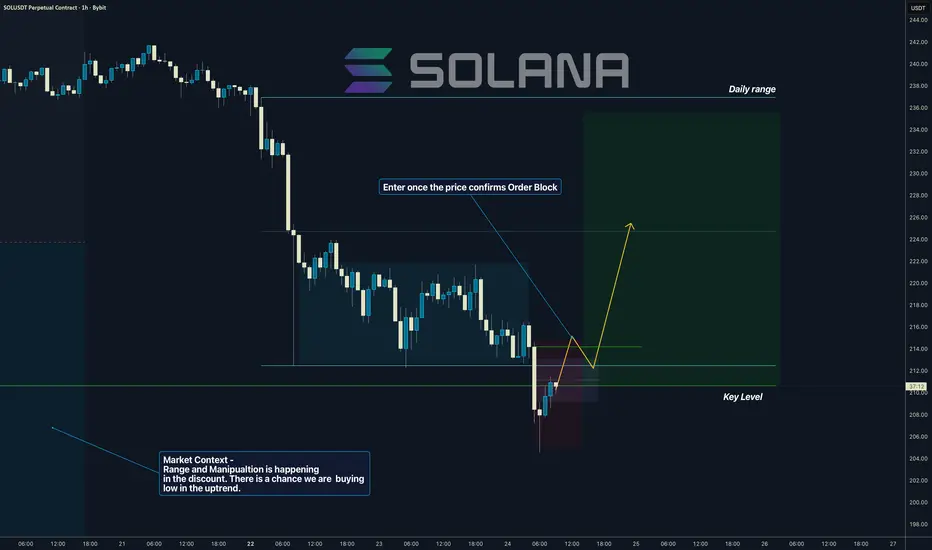
Solana I Daily Range I the discount - Manipulation phaseHi Traders, Solana is in the discount territory. Which means we are below a 50% of the latest up swing which is giving us nice trader probability for the patter.
📍
I have explained Premium / Discounts in this thread below
Price has created nice range which is being manipulated at this moment. In other words
market makers are loading liquidity.
📍I have explained liquidity in the thread below
📍At this stage when we are in the manipulation phase we dont know yet, if price will go up. Hence we must wait for the Order block confirmation which I explained in this thread bellow.
Once it all aligns and price switch in to the distribution phase there is a change for bullish move which is in sync with this HTF perspective.
💊 Note: this is just a probability. Win rate of this method is above 70% if you trade it with the right market context.
“Adapt what is useful, reject what is useless, and add what is specifically your own.”
David Perk aka Dave FX Hunter ⚔
SOLUSDT: Strong Uptrend with Solid SupportSOLUSDT is currently showing a strong upward trend thanks to the stability of the cryptocurrency market and a positive risk sentiment from investors. The Solana (SOL) token is receiving significant support from fundamental factors, such as a stable commodities market and the pressure on the US dollar due to the Federal Reserve's interest rate cuts.
From a technical perspective, SOLUSDT is testing the important support level at $199.00. If this level holds, the likelihood of a rebound and continuation of the uptrend is very high. The next resistance level is expected to be at $218.00, and if this level is breached, the price could continue towards $230.00.
The upward trend line remains intact, providing positive signals for the next move. Based on both fundamental and technical factors, SOLUSDT is likely to maintain its upward momentum if the support at $199.00 holds.

SOL RSI Signals Sustained Bearish MomentumSolana’s daily chart paints a clear picture of weakening demand as its Relative Strength Index (RSI) plunges to 39.07.
The RSI is a momentum indicator that measures overbought and oversold conditions, with levels above 70 reflecting overbought territory and below 30 signaling oversold.
At its current reading, SOL sits firmly in bearish territory, showing that selling pressure is outweighing buying momentum.
While the market may not yet be facing a capitulation phase, the outlook remains tilted to the downside. If bearish sentiment lingers, downward momentum could persist in the near term.
Solana$It seems that Solana has reached its price peak, and I’m expecting a correction.
Of course, the price may decline gradually in stages

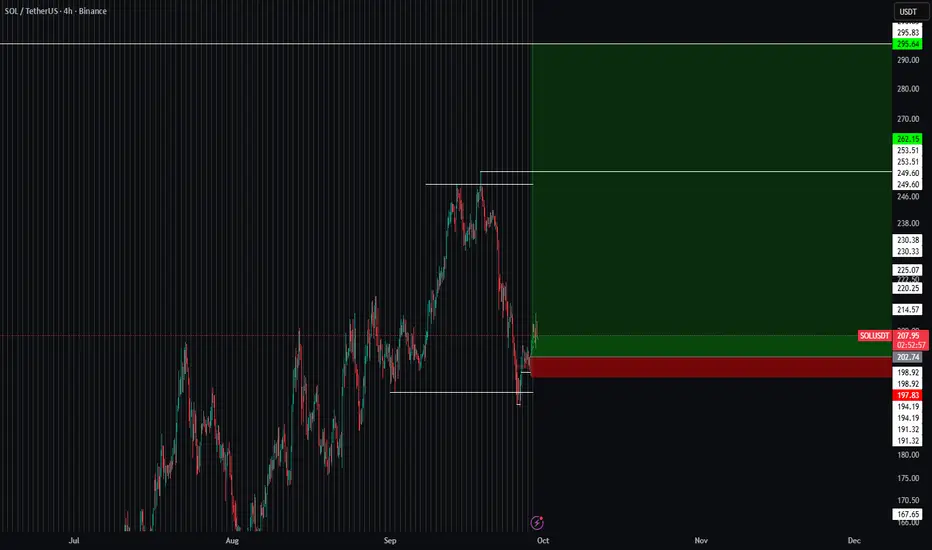
#SOLUSDT SHOWING BULLISH DIVERGENCE AT 4 HOURS TIME FRAMECurrent Structure:
SOL is currently trading around $204.65, testing the lower range after breaking below a short-term trendline. The chart highlights a bullish divergence on RSI, suggesting potential upside momentum.
Key Levels:
Entry Zone: $213.22
Stop Loss (SL): $202
Take Profit 1 (TP1): $223.78
Take Profit 2 (TP2): $252
Market Context:
The chart shows a falling wedge breakout setup, often a bullish reversal pattern.
RSI has marked a bullish divergence, signaling potential strength building despite recent price drops.
Price is near a major demand zone (green area) around $200–$193, which adds confluence to the bullish case.
Bullish Targets:
TP1 ($223.78): Aligns with previous liquidity area and fair value gap (FVG).
TP2 ($252): Major resistance zone where sellers may step in again.
Bearish Risk:
If SOL breaks below $202 support, it could revisit deeper demand zones near $193 and even $185.

$SOL bearish but long entry markedSolana made double top and currently correcting and grabbing liquidations. Marked is the zone from where i will be longing and placing stoploss at 180$. however i will be taking 2x leverage maximum.

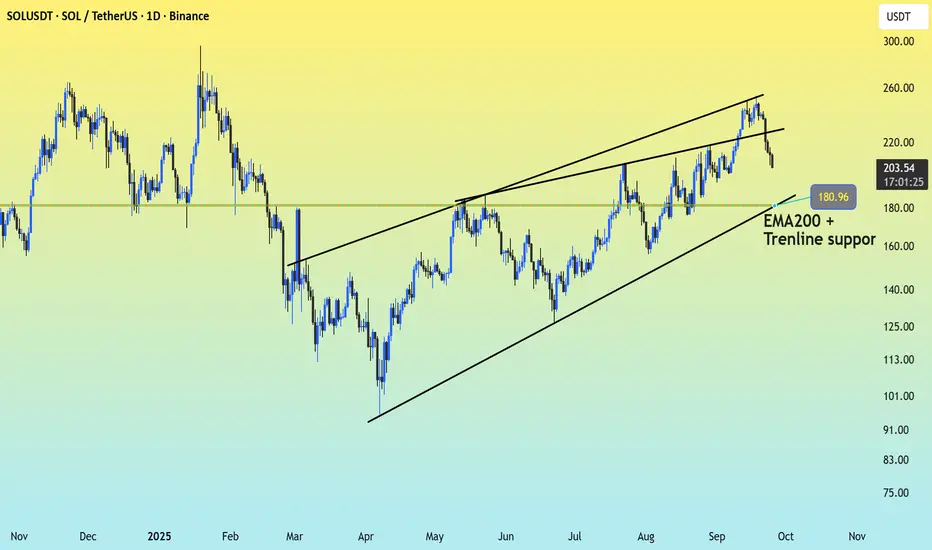
SOL at a Crossroads — Bounce or Breakdown AheadThe breakdown from the rising wedge is a bearish signal, suggesting a potential continuation of the downtrend.
Immediate Support: The next strong support lies around $181, which aligns with both the 200-day EMA and the ascending trendline support. This confluence zone will be crucial in determining if the bulls can defend the uptrend.
Resistance Levels: On the upside, resistance is seen near $220, which was the lower boundary of the wedge and may now act as resistance. Stronger resistance remains around $240–260.
Outlook: If SOL holds the $180 support, it may attempt a rebound. However, a breakdown below this level could accelerate bearish momentum, targeting the $150–160 range.
SOLUSDT Strong Rejection at Key Support – 230.00 Incoming!Hey everyone, Ken here!
SOLUSDT has been quite interesting lately. After a sharp decline from the channel’s top, the price broke through the support zone, often referred to as the neckline, and reached a key support area below. Here, we saw a strong rejection wick, which clearly indicates that buyers have stepped in and are ready to take control of the market.
With this setup, I predict that the 230.00 level will be a reasonable target in the short term. The strong rejection at this support zone suggests a high potential for a reversal.
Feel free to leave a comment if you agree with this prediction, or if you have a different perspective. Let’s discuss and share our ideas!

