SOL LONG : Falling Wedge CompleteThink we've seen the last leg down of this falling wedge pattern. Breakout wave up with a target of around $195 first before retracing to $158.
Real long entry begins after retracement with a final year target of above $250
Trade ideas

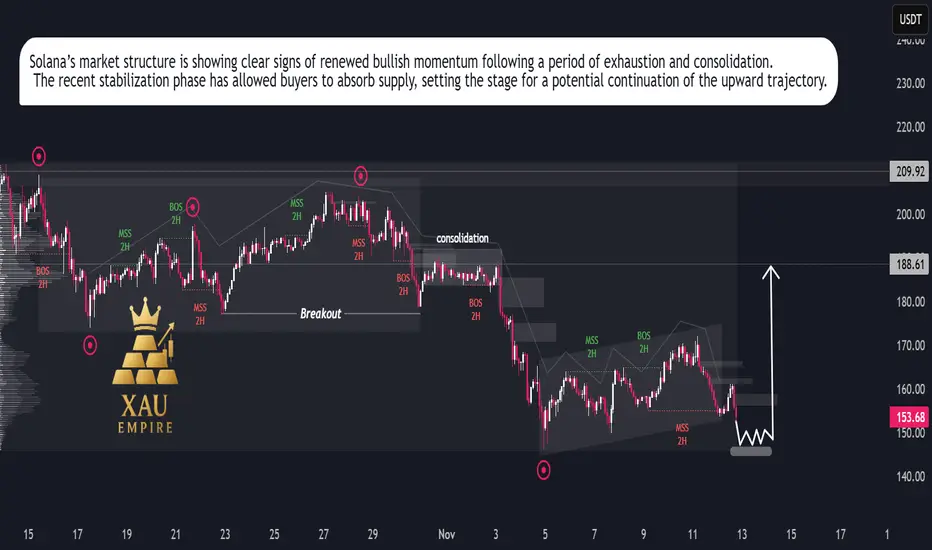
SOL/USDT – Bullish Momentum Rising, Rally Setup in ProgressSolana is showing renewed strength after an extended corrective phase, suggesting that the recent slowdown was a temporary reaccumulation rather than the start of a new downtrend. Price action has begun to stabilize, reflecting growing investor confidence and increasing participation from buyers at discounted levels.
Market flow indicates that selling pressure is fading, while buying volume has started to build up gradually. The recent structure reflects a healthy market rotation, where weaker hands are being replaced by strategic buyers positioning for the next expansion phase.
Momentum appears to be shifting in favor of the bulls, supported by consistent higher reactions after each dip and a clear compression pattern that often precedes strong directional movement. This behavior points toward a potential continuation of the broader uptrend, with expectations for renewed growth as market sentiment strengthens.
Overall, Solana’s current price behavior suggests the market is preparing for another bullish leg. As volatility contracts, the probability of an impulsive upside expansion increases, signaling that the next significant move is likely to unfold in favor of buyers.
#SOLANA is TRADING ON A 1785 DAYS LONG WEEKLY SUPPORT!SOLANA is trading on a 5-year-long weekly trendline support. What happens next will be worth watching.
Best lower entry zone: $125 to $135.
DYOR, NFA

SOLUSDT – Bearish Flag Breakdown in Progress
SOLUSDT on the daily timeframe appears to be confirming a bearish flag breakdown, indicating that the recent consolidation phase may have served as a continuation pattern within a broader downtrend. The price rejected resistance around the flag’s upper boundary and is now extending lower, suggesting renewed seller strength.
The RSI remains below the midline, reflecting persistent bearish momentum without signs of reversal yet. Immediate supports lie around 145.7 and 136.5, where price may look for a temporary pause or reaction.
Should the pair close below this zone with volume, the flag pole projection scenario could play out, opening room for a deeper retracement. Conversely, any sustained move back above 158–161 would negate the bearish continuation outlook and indicate a possible structural recovery.

SOL-USDT
If Solana can break its trendline upward
and maintain above the downtrend line 💥
Its conditions will improve a bit, and it could have a short-term rise toward $150 📈📈
Solana's short-term support is still at $139 🔼✔️

SOL Capital Sector. Price Slice 159.6973 🏷 SOL Capital Sector. Price Slice
🏷 He Remembers” — The SOL Sector Is Not a Level. It Is a Memory
🏷 Он Вспоминает» — Сектор SOL — Это Не Уровень. Это Память.
🏷 16.11.2025
🏷 Сектор капитала. Ценовой срез.
🏷 159.6973 — At the time of publication, the price had not yet been reached. ( на момент публикации цена не достигнута )
🏷 142.5641 — Level confirmed. ( уровень подтвержден )
🏷 This is not analysis.
This is archaeology of capital.
The past is not gone.
It is waiting.
And it remembers…
everything.
— The Architect
🏷 Это не анализ.
Это археология капитала.
Прошлое не ушло.
Оно ждёт.
И оно помнит…
всё.
— Архитектор

SOLUSDT – When Buyers Start to Lose MomentumAfter an exciting short-term rally, Solana is beginning to show signs of losing steam , as buying pressure weakens around the $167–$170 zone — an area aligning with the long-term descending trendline .
The technical picture is tilting slightly in favor of the bears: price has been repeatedly rejected near $170, forming a pattern of lower highs, while trading volume continues to decline. This indicates that buyers no longer have enough strength to break through the current downtrend structure.
If this scenario persists, Solana could pull back toward the $153 support zone, where buying activity previously emerged. Holding above this level will be crucial in determining whether the market can consolidate again or extend its decline further.
Overall, the short-term bearish trend remains dominant. Unless a strong catalyst or fresh liquidity enters the market, Solana may continue to drift lower within the current descending channel — a necessary “step back” before the next potential bullish phase begins.

SOLI don’t think CRYPTOCAP:SOL will go any lower from here. It’s sitting on a major support level and looks ready to reverse. In my opinion, this feels like a classic shakeout before the next major uptrend. When everyone least expects it, CRYPTOCAP:SOL will start pushing higher.

Smart Money footprint in next Days On SolHello team
Sol move better than others to fill LONG FVGs
by the time sol losing dominance
But You should know " Every cycle in Crypto is temporiry pirod time "
In next few hours or days Solana Would reach 120 $ ( Smart money footprint zone )
and sudenly pump more than 5% in few hours
This is not My financial advice
DYOR
But this would be an opportity , One from Milions opportinities in financial market
I GOT STOCKED so Drop a comment bellow to help me show that I am not robot to TrafingView 😁
#TradeWithMky Trade smart

SOLUSDT | 30m Bullish SetupAfter the sell-side sweep and SMT divergence, SOL respected the bullish order block (OB) and started structure shift.
Alligator lines have opened upward, showing momentum alignment for a possible continuation.
Setup Details:
🟩 Entry: 155.5 – 156.0
🔻 Stop Loss: below 150.5 (beneath OB)
🎯 Targets:
TP1 → 160.5
TP2 → 164.0
TP3 → 170.0
Looking for continuation higher as long as we hold above the OB.
Bill Williams’ Alligator + SMT confluence = strong bullish bias.
#SOL #SOLUSDT #Crypto #TradingView #ICT #SMC #BillWilliams #PriceAction #SmartMoney

Solana 4H 13/11For Solana on the 4-hour timeframe, I see a bullish flag pattern, and hopefully, it will play out soon. My target is the all-time high. Seeing how ETH and BNB have already reached their all-time highs, I believe Solana will follow next.

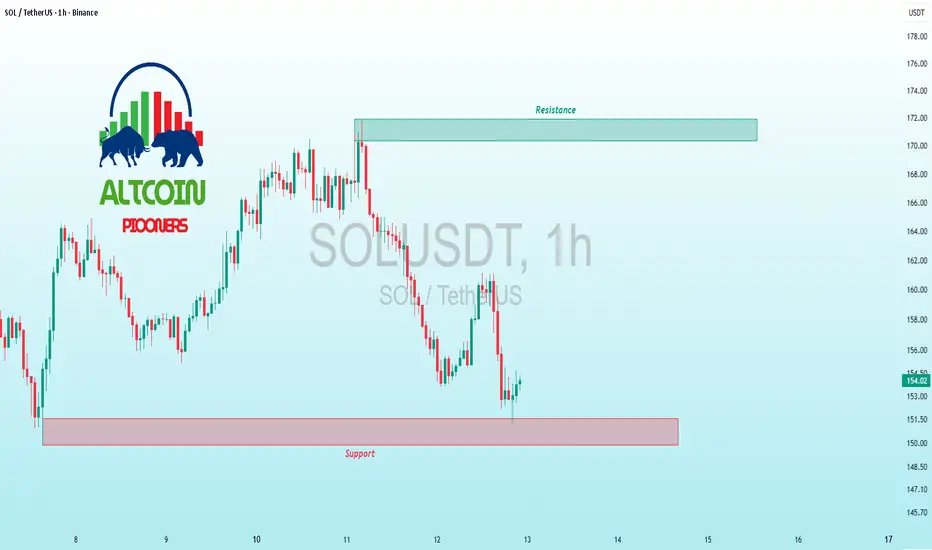
$SOL Support Fortress – Breakout Brewing?BINANCE:SOLUSDT CRYPTOCAP:SOL Support Fortress – Breakout Brewing?
Current trend: SOL's in a resilient base after volatility spike, clinging to 151.5 support amid broader alt weakness—bullish hammers forming, hinting at accumulation phase 🛡️.
Hold support? Very likely; volume clusters below and RSI bounce from 30 scream buyer control.
Breakout above resistance? Eyes on 178 clear for momentum shift—could trigger 8-10% rally if BTC cooperates 🚀.
Dip risk? Capped at 148 if rejection lingers, but low downside conviction.
Target: Initial 180 on flip; extended 190 with conviction.
Indicators tracking: RSI for reversal pops, Volume delta on greens, and Fibonacci 61.8% retrace 📊.
#SOLTrading #AltcoinBase #CryptoRebound
SOLANA SHORT : $100 USD Next SOL price now in very evident bearish down trend after rejection at $240 region. Looking at the daily chart next possible support is around $94 - $100 region . Wouldn't expect any bullish action until then

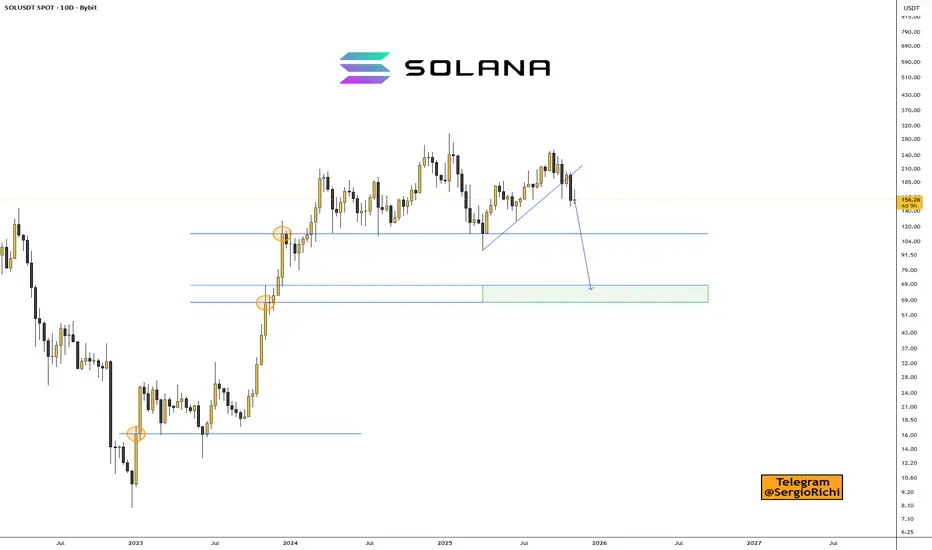
Quick overview for Solana (Nov 12, 2025)CRYPTOCAP:SOL / #Solana Quick overview for Solana (Nov 12, 2025)
We've broken the trendline and are now trading below it on the 10-day timeframe.
No price rebound in sight, so the priority is to wait for a correction with the nearest targets at $60–$70, where we can look for entry points.
Coinglass is sneaky—they won't let you view data beyond a 3-month chart 😡.
➖ Essentially, there's a large order on Coinbase at $52 and on Binance at $79.
➖ We'll focus on $60–$70 and make decisions from there.
Charts:
SOLUSDT 30min | Bullish 🔵 Alligator Positioning
Lips: 156.52 | Teeth: 156.15 | Jaws: 156.38
Price trading ABOVE all 3 lines → bullish alignment
Tight coil suggests imminent expansion
Market Structure
Sell-side Liquidity: Swept below 157.78
🎯 Optimal Trade Entry
Primary Long: 157.80-158.00 (current zone)
Secondary Long: 157.15-157.40 (OB retest)
Stop Loss: Below 156.10 (Alligator cluster break)
💰 Profit Targets
TP1: 160.00 (immediate resistance)
TP2: 162.50-165.00 (momentum zone)
TP3: 170.00-171.63 (liquidity target)
Bullish alignment intact - buying Alligator support for push toward liquidity above
#SOL #TradingView #ICT #Alligator #Bullish

#SOL/USDT Bullish trend analysis Read The caption#SOL
The price is moving within an ascending channel on the 1-hour timeframe and is adhering to it well. It is poised to break out strongly and retest the channel.
We have a downtrend line on the RSI indicator that is about to break and retest, which supports the upward move.
There is a key support zone in green at the 154 price, representing a strong support point.
We have a trend to stabilize above the 100-period moving average.
Entry price: 156
First target: 156.80
Second target: 158
Third target: 160
Don't forget a simple money management rule:
Place your stop-loss order below the green support zone.
Once the first target is reached, save some money and then change your stop-loss order to an entry order.
For any questions, please leave a comment.
Thank you.

SOL-USDTYesterday I mentioned the possibility of a correction down to $152, and well, it came down exactly to that support level and reacted well to it 🕯🕯
As long as it stays above this level, it can continue its upward path to $164 🔼💲

Solana is approaching a key support around $150.If this level breaks, the next strong buy zone is $120–100, where the lower channel boundary and main liquidity sit.
The market still looks weak no point catching a falling knife.
No need to buy after a -6% drop.
If we see a clear reaction from $150 fine, there’s a setup.
But the best accumulation zone is still lower, closer to $100.
📉 Base scenario: break $150 → test $120 → possibly $100.
📈 Bullish case: bounce from $150 → reclaim $170 → back inside the channel.
Stay calm. The market rewards patience, not emotions.

Bitcoin: Is the bottom in? Bonus: ETH and SOLThis video will prepare you for the unexpected.
Bitcoin is somewhat forming what would look like a bottom, but the bigger timeframe forms a somewhat scary picture. So, I decided to describe the market condition to make sure you are prepared for various scenarios.
Bonus: Outlook on ETH and SOL

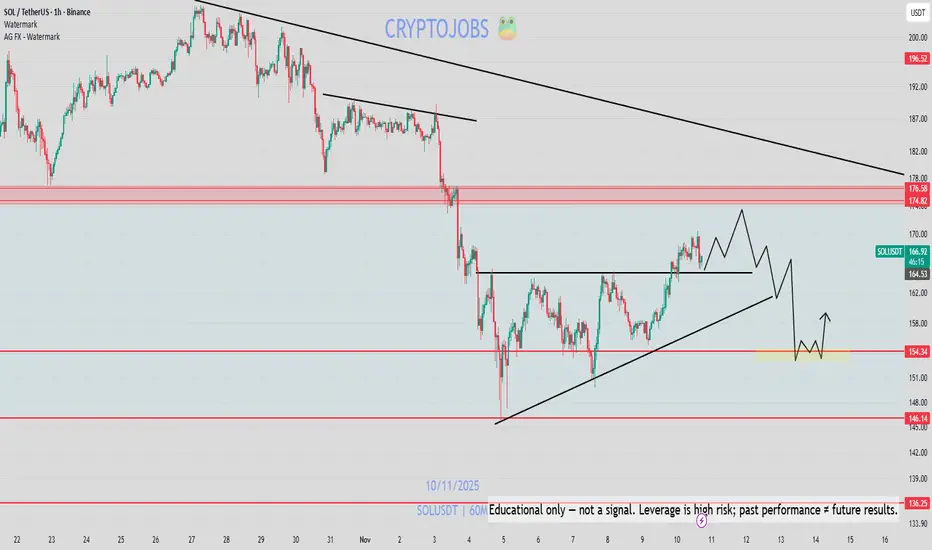
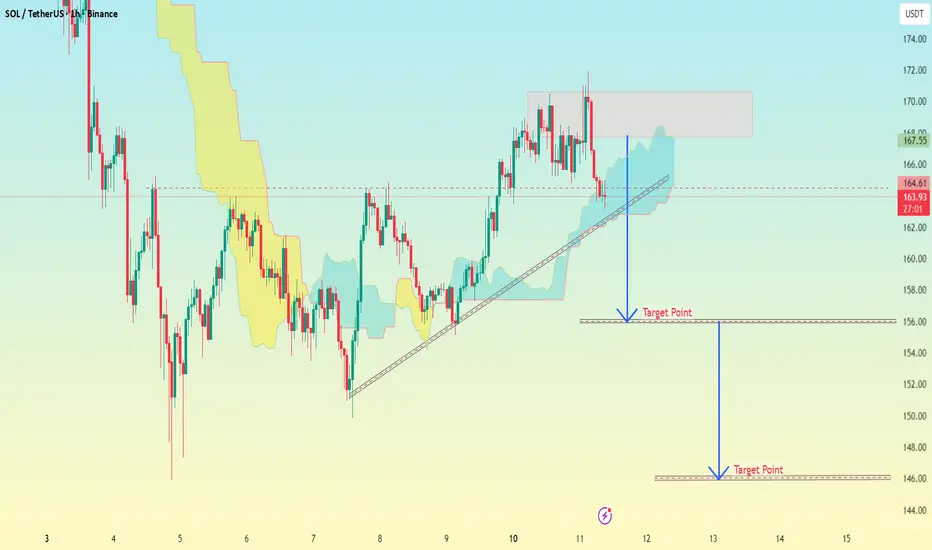
(SOL/USDT 1H timeframe...(SOL/USDT 1H timeframe on Binance):
Here’s what I can interpret from the structure shown:
Current Price: Around $164
Support Trendline: Rising from around $158 → $164 (now price has slightly broken or retested this line)
Resistance Zone: Highlighted in red box near $169–$172
Two Target Points are drawn on the chart:
🎯 Target 1:
The first blue arrow (labeled Target Point) points to around $156.
→ This is likely the first downside target after trendline break.
🎯 Target 2:
The second blue arrow (lower one) points to around $146–$147.
→ This is my extended or final bearish target if the price continues falling.
---
🔍 Summary:
Level Type Target Zone
Target 1 Short-term $156
Target 2 Major target $146–$147
---
⚠ Tip:
If SOL closes below $162 on 1H or 4H candle → high chance to move toward $156.
If it loses $156 support, then $146 becomes realistic.
But if SOL reclaims and closes above $168–$170, the bearish setup fails and bullish continuation toward $174+ can begin.
#SOL/USDT is going to breakout from descending channel 18% gain#SOL
The price is moving within an ascending channel on the 1-hour timeframe and is adhering to it well. It is poised to break out strongly and retest the channel.
We have a downtrend line on the RSI indicator that is about to break and retest, which supports the upward move.
There is a key support zone in green at the 162 price, representing a strong support point.
We have a trend to stabilize above the 100-period moving average.
Entry price: 164
First target: 166
Second target: 168
Third target: 171
Don't forget a simple money management rule:
Place your stop-loss order below the green support zone.
Once the first target is reached, save some money and then change your stop-loss order to an entry order.
For any questions, please leave a comment.
Thank you.

SOL-USDTAfter the upward movement, a correction is taking place, and if it can maintain the support level set at 164, this move can be considered a pullback to the trend line, and the upward movement toward the upper trend line could continue 📊🔴Otherwise, the correction could continue down to 153 dollars 🔼📌

SOL - UPDATE: CRYPTOCAP:SOL - update: 🟥
Remember, I posted this view few days ago.
Prices retested exactly the previous breakout (key support) around 170 - 175$.
If this level act as resistance, we could see another dump & lower low! 📉
Prices could move sideway for a while, but:
My initial outlook called for the 130$ level as bottom.
Judging by my weekly & daily view, For now this setup is valid under key resistances.
Daily = Bearish
Weekly = Neutral
At the opposite:
155$ must hold on daily basis to expect a downtrend reversal & breakout📈.
A downtrend breakout would surely lead to a push toward 180$ or even 200$+ 🟩
More infos & data in my charts! #dyor - H1 possible setup