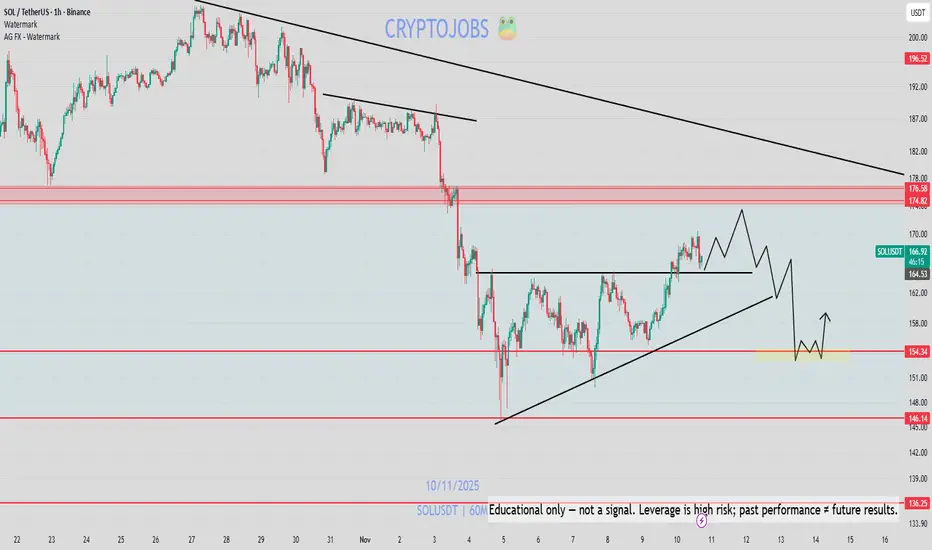
#SOL/USDT is going to breakout from descending channel 18% gain#SOL
The price is moving within an ascending channel on the 1-hour timeframe and is adhering to it well. It is poised to break out strongly and retest the channel.
We have a downtrend line on the RSI indicator that is about to break and retest, which supports the upward move.
There is a key support zone in green at the 162 price, representing a strong support point.
We have a trend to stabilize above the 100-period moving average.
Entry price: 164
First target: 166
Second target: 168
Third target: 171
Don't forget a simple money management rule:
Place your stop-loss order below the green support zone.
Once the first target is reached, save some money and then change your stop-loss order to an entry order.
For any questions, please leave a comment.
Thank you.
Trade ideas

SOL-USDTAfter the upward movement, a correction is taking place, and if it can maintain the support level set at 164, this move can be considered a pullback to the trend line, and the upward movement toward the upper trend line could continue 📊🔴Otherwise, the correction could continue down to 153 dollars 🔼📌

Bitcoin: Is the bottom in? Bonus: ETH and SOLThis video will prepare you for the unexpected.
Bitcoin is somewhat forming what would look like a bottom, but the bigger timeframe forms a somewhat scary picture. So, I decided to describe the market condition to make sure you are prepared for various scenarios.
Bonus: Outlook on ETH and SOL

SOL: Very clear Head & Shoulders pattern visibility📊If we compare the D1 charts on BTC and Solana, we can see that on Solana's chart, we have a MUCH MORE clear image of the Head and Shoulders formation - that is why it is always worth spending extra time to compare the correlating charts to get the full picture if some evidence is missing or hidden under the market noise.
⚠️This might be an indication of a strong drop even further if the BTC major 75k support line were to collapse. Be cautious!

SOL-USDT
It is inside the same channel I told you about yesterday 💲💲
If it doesn't break above the top of the channel and the descending channel isn't broken 📊
The first support level is at $127, and if the correction continues, it might even go down to $121 🚨🔽

My plan to next mov of SOLMy outlook for SOL’s next move is that it will bounce hard, but heavy selling will likely come in during that move. In other words, a sudden sell-off might hit in the middle of the upward move; something that may look like a normal correction at first but turns out deeper than expected. After that, the price might climb a bit again, but we should wait and stay cautious until things become clearer.

Head and Shoulders forming for SOLHead and Shoulders forming for SOL
Possible bounce from here to 195$

SOL-USDT🔤🔤🔤
Solana is in a downtrend channel 💰💰
which has shown a good reaction at the channel's bottom.
Two important support levels for Solana are the $127 range and then $121 🔽📊
On the other hand, the first resistance is the top of this channel at $137, and if this is broken, the next target will be $143 📣🔼

SOLANA RETRACEMENT INCOMINGFollowing that impressive downward surge, a true force of momentum, we can reasonably anticipate a retracement upward to address those overlooked volume nodes left behind. Stay vigilant on the overall market structure; hold for a confirmed break, and cross-reference with the Cumulative Volume Delta (CVD) to time that short term pullback effectively. it's been a solid week so far, packed with solid setups, and the horizon promises even more to come.

SOLANA, November 15 Two Possible Correction Scenarios — One Outcome
In my view, Solana is currently forming a corrective structure.
At this moment, there are two scenarios:
🟧 Orange Scenario
The ABC corrective pattern has likely just completed, and Solana may follow the orange arrow toward 126 and potentially even lower.
🟪 Purple Scenario
The current flat ABC structure may actually represent wave A of a larger ABC correction — similar to what happened in Bitcoin right before its recent drop (see my recent BTC post where I expected 94K).
If this scenario plays out, Solana could first rise toward 144–146, and only then move down to 126.
I previously mentioned that I was waiting for Solana at 136 — and we’ve already seen that level.
I also expect 124, and possibly even lower.
But for now, I keep my short-term target at 126.
My global target is 112, but first, let’s see how exactly Solana approaches 126 — this will help confirm whether it truly intends to move below that level.
Let’s see which path Solana prefers — personally, I’m leaning toward the orange one.
⚠️Disclaimer: This is not financial advice or a call to action — only my personal vision.
🚀If you don’t want to miss updates, feel free to follow, leave reactions, or drop a comment.
Your support truly motivates me to continue posting regular Solana updates.

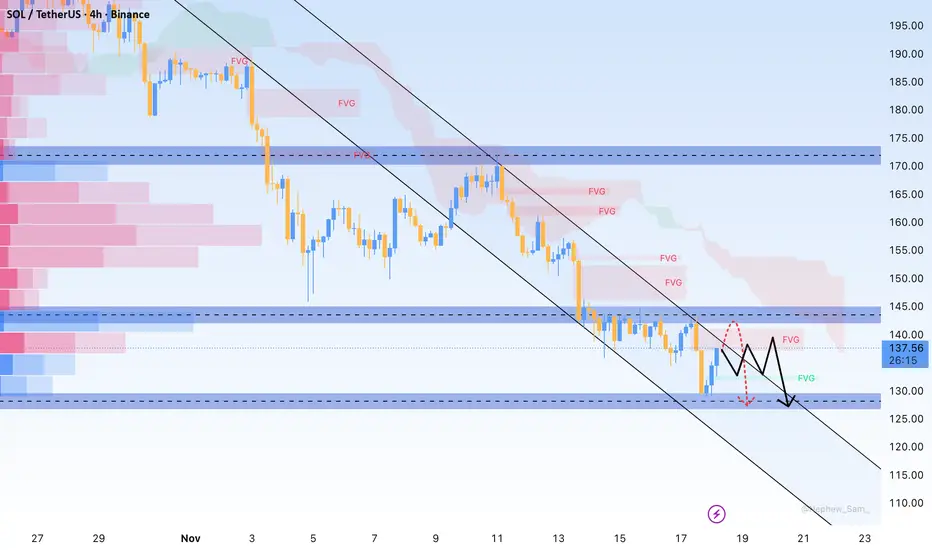
SOL Pulls Back to Key Support Before Its Next Major MoveHello everyone, after a sharp rebound from 132 USD to 137 USD, SOL is now pulling back and trading around the key 135 USD support — a zone that previously triggered a strong bullish reaction. Selling pressure returned as price touched 137 USD, where the red FVG and Ichimoku cloud converge, slowing buyers down. Meanwhile, broader crypto sentiment has softened as the stronger USD and expectations of delayed Fed cuts reduce risk appetite, especially for assets that rallied aggressively like SOL.
With the current market structure, SOL may continue to retreat toward 132–130 USD — an area packed with green FVG and deep liquidity, also the zone where buyers previously stepped in with conviction. A solid reaction here could send SOL back to retest 135–137 USD before choosing its next major direction. But if 130 USD breaks, the downside could extend toward 125 USD.
This is a critical moment to watch price behavior — a clean bounce from 132–130 USD could set the stage for the next recovery leg. Do you think SOL can defend this support?
SOLUSDT SOLUSDT touched a historical line. What is going to happened in future. Is SOL again going back to 8 again? Lets see...DYR.
Happy Trading ☺️

SOL 1H – Long Bias
After the strong downside move, SOL swept sell-side liquidity, tapped into the 1H demand block, and printed a shift in short-term orderflow. The market is now showing the early signs of reversal → continuation, with price consolidating above the reclaimed imbalance.
Key confirmations visible on the chart:
Sell-side liquidity taken
Return into 1H FVG + OB
Alligator compression → early curl up
Price trading back above the mitigation zone
Clear inefficiencies above acting as magnets
This gives us a clean long continuation setup as long as the demand at the lows holds.
📌 Trade Parameters
Entry:
📍 141.70 – 142.20
Stop Loss:
📍 134.94
🎯 Take Profits
TP1: 150.00
TP2: 155.00
TP3: 160.50


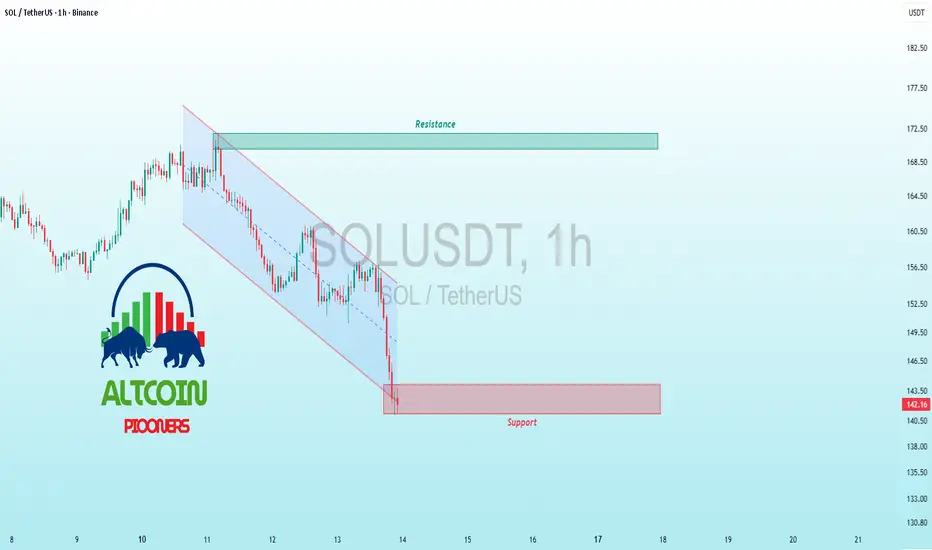
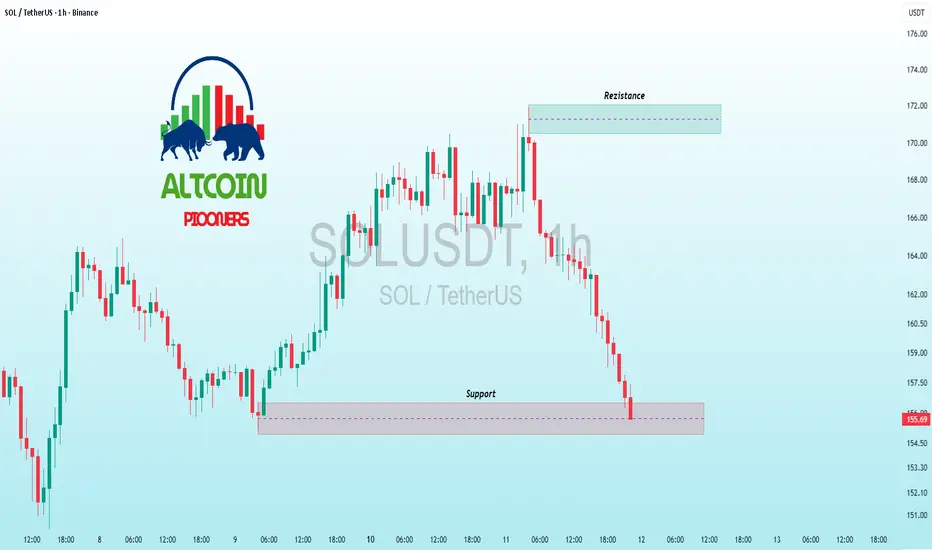
$SOL Channel Test – Bulls Defend or Bears Dominate?BINANCE:SOLUSDT CRYPTOCAP:SOL Channel Test – Bulls Defend or Bears Dominate?
Current trend: SOL's hugging the descending channel lower boundary, dipping to 143.5 support after rejection from 182 highs—classic pressure cooker with thinning red volume signaling possible relief 🛡️.
Hold support? Strong potential yes; hammer candles and prior confluence zone could draw buyers for a squeeze play.
Breakout above resistance? On horizon if 182 flips—igniting 7-10% rally to channel top 🚀.
Dip risk? Moderate to 140 on break, but oversold prevents panic flush.
Target: Upside 160 short-term; downside 138 buffer.
Indicators tracking: RSI (30, oversold bounce), Channel slope, and OBV divergence 📊.
#SOLTrading #CryptoChannel #AltcoinPioneers
SOL-USDTMy view on Solana is still the same: as long as it keeps its support at $150, it can continue to rise towards the static resistance at $165 🔼🔼💲💲

SOLANA BOUT TO MOON!Here is some play for you so seems bullish on 1hr time frame as it shows a strong bullish candle and continue to make that bullishness

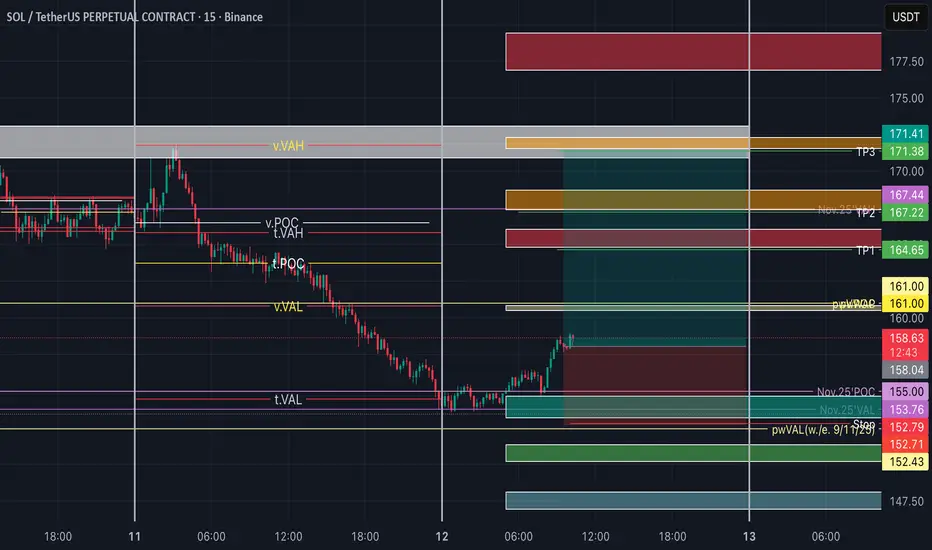
SOL Long position (12/11/25)Take Profit 1 = $164.6
(*Nov11.tVAH + Nov11.vPOC + Nov10.VAL + Fibonacci confluence)
Take Profit 2 = $167.2
(*monthly.VAH + Nov10.POC + Fibonacci confluence)
Close Long (tp3) = $171.4
(*Single Prints from Nov3 + Nov11.tVAH + Fibonacci confluence)
Stop = $152.8 (*monthly.VAL + Nov11.tVAL + Fibonacci confluence)
SOL bull?
The overall structure remains **bullish for now**.
Price is approaching the **golden ratio Fibonacci level**, which aligns with **liquidity clusters** seen both on **Hyblock open interest** and **liquidation heatmaps**.
This zone is expected to act as a **key resistance**, as such levels are **rarely broken on the first attempt** — often leading to a **short-term pullback or consolidation**.
If the price manages to **hold above this area**, continuation of the upward move becomes likely; for now, it’s best to **observe the market reaction** around this critical zone.

Solana Battle at 150!Hello, is everyone watching Solana (SOLUSDT) fight?
Currently, SOLUSDT is still under downward pressure after breaking the old support zone (new resistance) and the price continues to be rejected at the main trendline resistance.
The 150-160 zone is acting as an important reaction zone, a short technical recovery may appear before continuing to decrease when it cannot hold this zone.
On the other hand, the market shows signs of altcoin cash flow weakening slightly when BTC is regaining its capitalization advantage.
In addition, the liquidity of the crypto market at the beginning of the week has not clearly recovered, making SOL's recovery difficult to sustain.
In my personal opinion, when breaking through the current support zone, the possibility of going down to the 130-140 zone is quite high.
What do you think, is this zone worth observing for short-term shorts? Or should we wait for a clearer signal in the small frame?
Share your views in the comments below!

$SOL Rebound from Support, Breakout Potential?BINANCE:SOLUSDT CRYPTOCAP:SOL Rebound from Support, Breakout Potential? 📊🌊
SOL's 1H trend turns bullish, snapping back from core support at ~155 with increasing volume—buyers defending hard!
High odds of holding, pushing for breakout above 170 resistance toward 185 target.
Deeper dip unlikely (watch 150), but secure stops.
Monitoring RSI at ~53 (rising), 50 EMA bounce, and MACD flip positive.
Solana surge incoming! 🚀
#SOL #CryptoTrading #AltcoinBull
$SOL Bull Run Testing Resistance?BINANCE:SOLUSDT CRYPTOCAP:SOL Bull Run Testing Resistance?
SOL's 1H chart roaring bullish, surging to 166.87 highs and eyeing resistance at 170—breakout could target 175 quick, but pullback to support 155 risks if momentum stalls.
Strong uptrend vibes!
Key indicators: RSI overbought at 70 (watch divergence), 50MA rising, volume spiking. 🌊🚀
#SOL #Solana #AltcoinPioneers

SOL - UPDATE: CRYPTOCAP:SOL - update: 🟥
Remember, I posted this view few days ago.
Prices retested exactly the previous breakout (key support) around 170 - 175$.
If this level act as resistance, we could see another dump & lower low! 📉
Prices could move sideway for a while, but:
My initial outlook called for the 130$ level as bottom.
Judging by my weekly & daily view, For now this setup is valid under key resistances.
Daily = Bearish
Weekly = Neutral
At the opposite:
155$ must hold on daily basis to expect a downtrend reversal & breakout📈.
A downtrend breakout would surely lead to a push toward 180$ or even 200$+ 🟩
More infos & data in my charts! #dyor - H1 possible setup