Soul odor your sol Short-term momentum is bullish on 1m chart. Breaking the $187.00 resistance should lead to a rapid continuation move.
For long 187.10 TP 189.90
But for short 184.90 TP 182.2
A failure to hold $185.00 would confirm weakness, likely triggered by a rejection at $187.00, suggesting a push to re-test the lows of the day.
Trade ideas

sol longAfter taking sellside liquidity, price shifted structure and formed a bullish order block (+OB) in discount. A clear market structure shift (MSS) followed by multiple breaks of structure (BOS) confirms bullish intent.
Currently trading within the fair value gap (FVG) and showing displacement above short-term highs — expecting continuation toward the next buyside liquidity zone around 198.17.
Bias: Bullish
Sellside liquidity swept ✅
MSS + BOS confirmed ✅
+OB and FVG holding as support ✅
Alligator MAs showing early momentum alignment ✅
As long as SOL maintains structure above 183, I’m looking for expansion into the premium side of the range targeting 198+.
#SOL #SOLUSDT #ICTConcepts #SmartMoney #OrderBlock #Liquidity #CryptoTrading #FVG

SOL LONG : Ready for $250Following that price crash to $175 looks like price reversal is underway with $190 acting as new support area around short term 0.5 fib.
Market conditions are bullish right now, expecting a move to $250 from here

Solana 300 by year end?Looking at the charts, it's been a slow, sluggish grind, and it's now at the same price as March 2024!!! looking at the trend, we need a large cash injection - the rsi is lowering. if eth goes up then solana should get some love. if the bitcoin cycle is extended then maybe it will reach 400 by may. but it's all if's!

SOL-USDTThere is an important trend line
that is blocking the path. If it manages to get this downtrend line out of its way 🪙🪙
it can start its ascent in the form of a new lag according to the path I have specified 🔼📌
SOLUSDT: Downtrend Formation, Possibilities Of Short.Hello everyone,
After last week liquidation on the crypto market, SOL have been scaling on a descending channel as we observe in the outline, with areas of lower lows and highs acting as support and resistance in the levels.
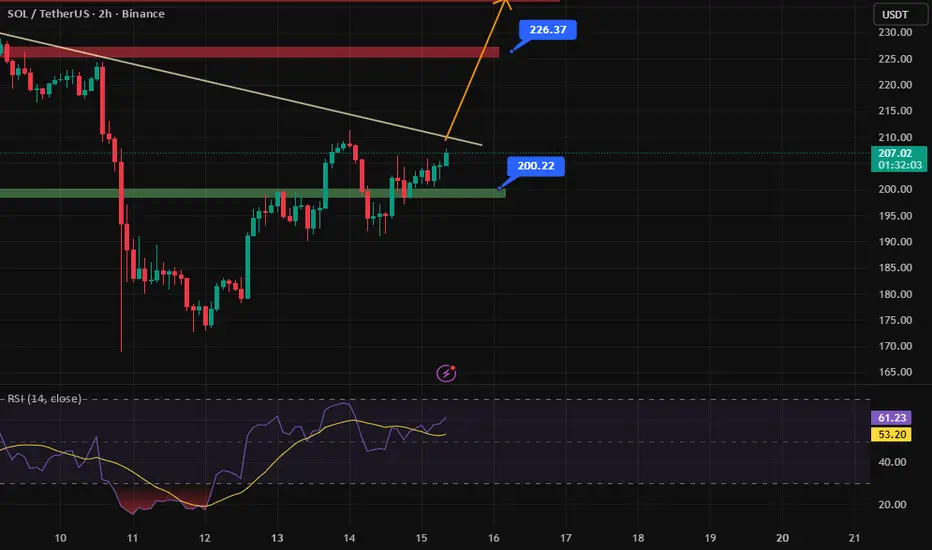
Technically in respect to the structure SOL might move toward the next lower highs at $226 before taking another pullback as potential retest points, with a partial target below $161.
On this occasion, traders can utilize this zones as possible Buy and Sell confirmation position.
Share your thoughts on this analysis..
Follow up thanks for reading.

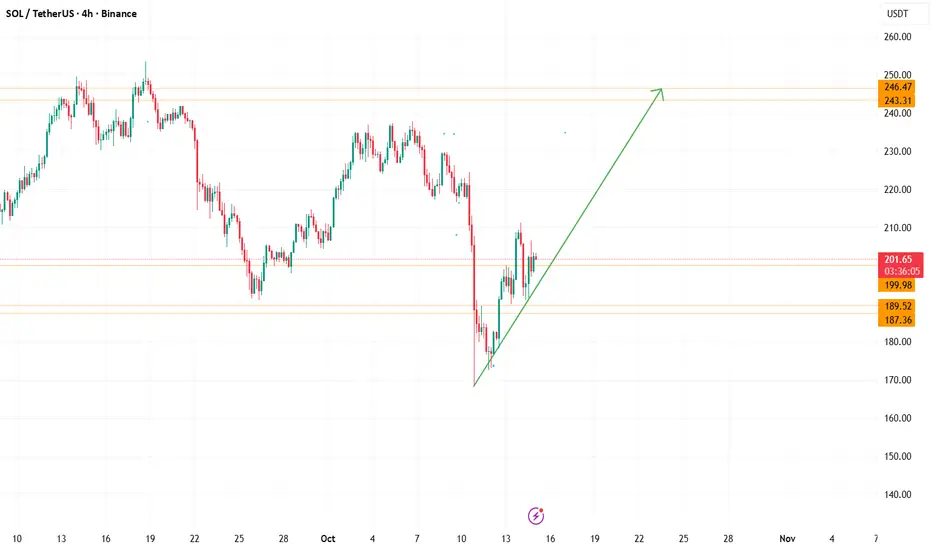
SOL heading to 243-246 SOL going test the highs again as the first 2 weeks of October are over, i expect a sharp correction after.
SOL Sellers Regain Control as Bearish Momentum BuildsSOL appears to be under renewed selling pressure on the daily chart, with indicators signaling a growing bearish outlook. The Balance of Power (BoP) shows sellers dominating the market, indicating that momentum has shifted against buyers.
Typically, when the BoP turns negative, it reflects increasing control by sellers and potential for further downside movement.
This suggests that the current market sentiment for SOL remains weak, with bears maintaining the upper hand in the short term.

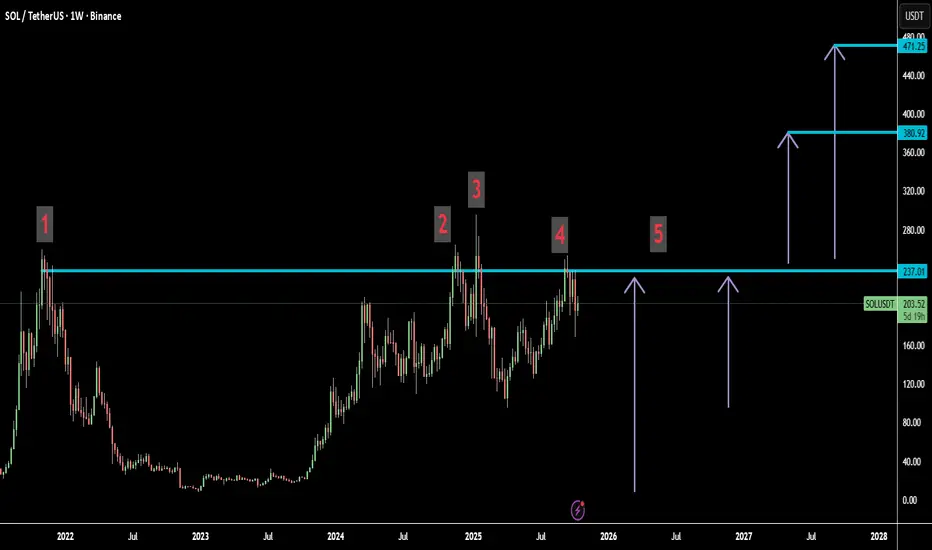
The Unbreakable Wall? 5th Test of Major ResistanceHello, traders!
I'm back with an analysis of the SOLUSDT chart on the Weekly timeframe. My focus today is on a critical resistance level that Solana has tested multiple times, and the price action is suggesting a significant move could be on the horizon.
Support around 212.91 is crucial
Hello, fellow traders.
By "Following," you'll always get the latest information quickly. Have a great day today.
-------------------------------------
(SOLUSDT 1W Chart)
The chart may look complicated due to the drawn lines, but the key is whether the price can rise above the boxed area.
In other words, whether the price can rise above the 179.53-237.60 range and maintain its upward momentum is crucial.
-
(1D Chart)
The HA-Low indicator on the 1D chart is showing signs of forming at the 212.91 level.
Therefore, if support is confirmed around 212.91, it would be a good time to buy.
However, the HA-High ~ DOM (60) range has formed in the 236.88-237.60 range, so we need to see if it can break above this range.
If the upward breakout fails, it's time for a partial sell-off.
-
To continue the uptrend by breaking above a key zone or point,
1. The StochRSI indicator must be trending upward. If possible, it should be below the overbought level.
2. The On-By-Value (OBV) indicator must be trending upward. If possible, it should remain above the High Line.
3. The TC (Trend Check) indicator must be trending upward. If possible, it should remain above the 0 level.
If the above conditions are met, the uptrend is likely to continue.
-
Thank you for reading to the end.
I wish you successful trading.
--------------------------------------------------

SOL: intraday transactionsAfter a strong decline, intraday trades can be traded. While the long position is open, the part has already been fixed

Bullish Divergence on Sol/USDT, Buy Setup TradeSolana/USDT has printed a Bullish Divergence on RSI. If the price starts to move up, it can give us a 1:1 trade here. Let's see how it goes...
Note: This is a low-risk trade. Do not take high risk and avoid leverage.

Solana Recovery: Watching 178.2 Solana is also showing price recovery after last week’s crash. The key level to maintain the upward correction is 178.2 . Volatility will likely decrease to previous levels over the next few days.
Support lies in the 168.8–175.5 range — in this area, I expect a quick recovery above 178 , otherwise, the decline may continue toward 155 . Resistance is in the 216–224 range, but the price has already reacted from the 200 level, so I’m watching for a potential breakout of the current high.

SOLANA Buying Opportunity Solana has established support at the daily trendline and successfully closed above the key daily resistance level at $191.32. The daily RSI is also indicating a potential buying opportunity, suggesting renewed bullish momentum. If this upward trend continues, the next potential target for Solana is around $250.

SOL/USDT – Daily OutlookAfter forming a potential harmonic structure, SOL seems to be following a corrective path from point B (0.789 Fib) toward a possible C leg around the 0.886 retracement zone — an area that could act as a strong support.
If the pattern completes, we might see a bullish reaction from that zone, targeting:
1st Target: 345.5 USDT (1.27 Fib extension)
2nd Target: 412 USDT (1.618 Fib extension)
However, failure to hold near the C zone could lead to deeper retracements before any significant reversal.
📊 Overall, I’m watching for a confirmed bounce at C before considering long positions.
#SOLUSDT #HarmonicPattern #CryptoAnalysis #TradingView

Sol Next StepsBINANCE:SOLUSDT SOL is expected to retrace from $195 toward $175–160, possibly dipping into the $140–150 weekly buy zone before reversing. The chart outlines a bearish correction within a larger bullish structure, targeting $213–222 then $240+. SMA confluence and liquidity zones support a mid-term accumulation before breakout.

Too Early to Buy Solana? Watch the $200–210 ZoneAs mentioned in my general crypto post yesterday, I remain bullish on the broader market and still hold some altcoins at this stage.
However, that doesn’t mean we should jump in blindly, assuming this is it.
Every setup needs confirmation — and Solana is no exception.
At the time of writing, SOL/USD is trading close to my initial entry area, but price action deserves a closer look.
1. What Happened on Friday
The general market sell-off pushed Solana below both a key horizontal support and the lower boundary of its rising channel — a clear bearish technical signal.
After that, we saw a strong recovery into the weekend, with price touching the psychological $200 level overnight before facing some resistance.
2. Current Market Structure
Despite the bounce, the structure remains bearish for now.
A clean stabilization and acceptance above the $200–210 zone would be the first technical sign of a potential trend shift to the upside.
3. Trading Plan
If you’re considering a long position on Solana, I believe it’s too early to enter.
The market looks overconfident in recovery, and when everyone assumes “the bottom is in,” that’s often when a new drop comes.
Wait for confirmation!

SOL/USDT Update — Bullish Trend Structure and Resistance Ahead“🚨 Solana vs Tether: Bullish Heist on SOL/USDT 💰”
📊 Description
Market: SOL/USDT
Bias: Bullish (Swing / Day Trade)
✅ Trade Plan
Entry: 🎯 Any good support / demand area — stay alert & flexible.
Stop Loss: 🛡️ “Thief SL” @ 160.00 USDT — this is my SL, not yours. Manage your own risk!
Targets (TP):
• 🎯 Target 1: 215.00 USDT
• 🏁 Target 2: 240.00 USDT
⚠️ Heads up: Use your discretion. Do not blindly follow my SL/TP — trade responsibly, at your own risk.
🔍 Key Insights / Logic
🚧 Expect resistance & traps near 215–240 — don’t get stuck in overbought zones.
📈 Momentum is building; structure is favorable on retests.
🔊 Watch volume on impulsive moves — rising volume = strength.
🔄 Related pairs / correlation watch:
• BINANCE:SOLBTC — strength vs BTC strengthens the bullish case.
• BINANCE:ETHUSDT — altcoin momentum may carry SOL upward.
• BINANCE:BNBUSDT — BNB strength can support ecosystem flow.
✨ “If you find value in my analysis, a 👍 and 🚀 boost is much appreciated — it helps me share more setups with the community!”
#SOL #SOLUSDT #Solana #CryptoSwing #CryptoDayTrade #AltcoinAnalysis #TradingViewIdeas #CryptoFun

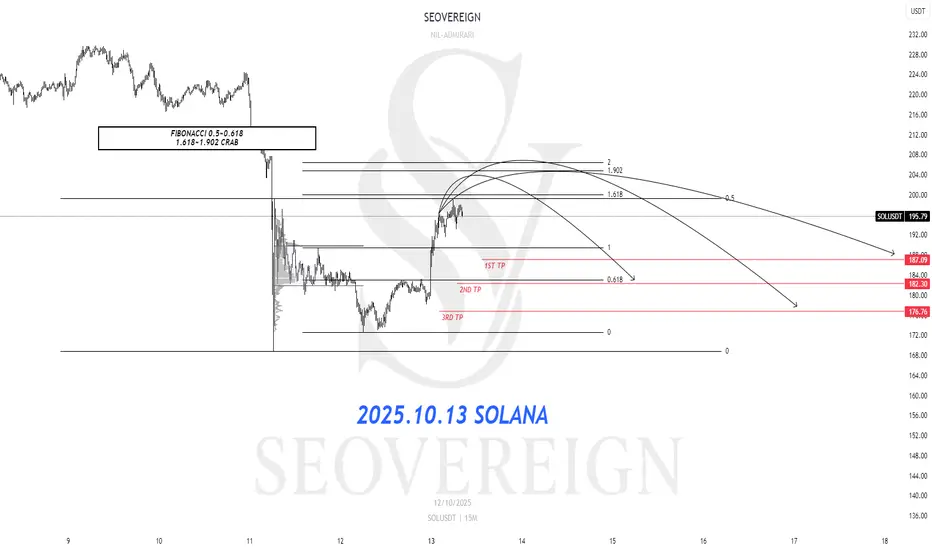
[SeoVereign] SOLANA BEARISH Outlook – October 13, 2025Today, I would like to share my bearish outlook on Solana as of October 13.
The first basis for this view lies in the 0.5–0.618 Fibonacci retracement zone.
This zone is known as a key area where, after a correction within an uptrend has completed, short-term rebounds tend to be limited and a bearish reversal often follows.
In particular, the 0.618 level—often referred to as the “golden retracement ratio”—typically serves as a strong resistance point where selling pressure re-emerges after an excessive pullback.
Currently, Solana’s upward momentum appears to be slowing within this 0.5–0.618 range, suggesting that the upper resistance pressure is gradually intensifying.
The second basis is the 1.618–1.902 CRAB pattern.
While the Potential Reversal Zone (PRZ) of a traditional Crab pattern is located at the 1.618 extension of the XA leg, it is often observed in real market conditions that prices extend up to the 1.902 level before a sharp reversal occurs.
This range indicates that the market has entered an overheated phase, and strong corrective waves frequently emerge when the pattern completes.
Accordingly, the average target price is set around 182 USDT.
Depending on how the chart unfolds,
I will provide further updates to this idea, including position management and any significant changes.
Thank you for reading.
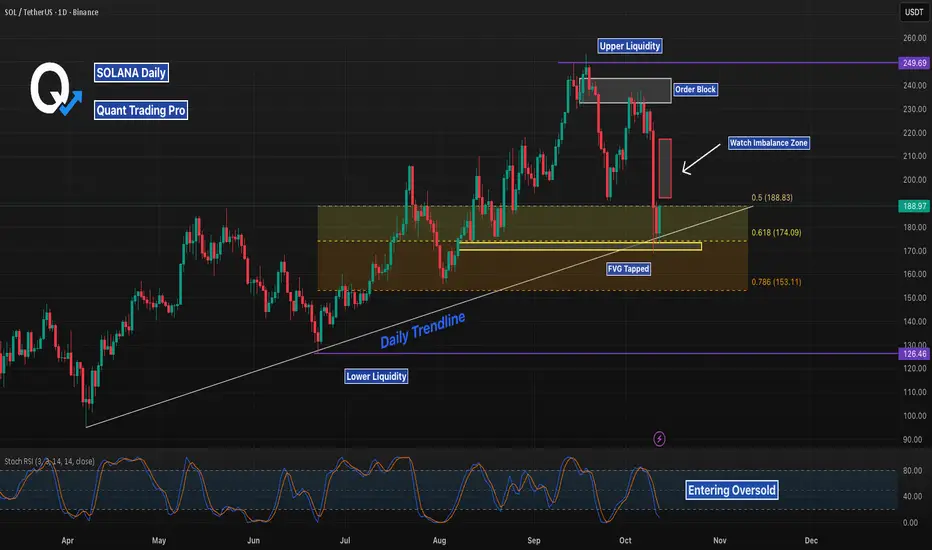
SOL Daily Recap: Breakout or Reversal Ahead?Solana (SOL/USD) recently tested the daily trendline support around $174.09 and bounced, with price action now approaching the FVG target zone near $189.55. The bullish move pushed toward the watch imbalance zone at $200, hinting at a potential breakout toward upper liquidity at $240 if momentum holds. However, the order block rejection near $210 suggests caution—watch for a bearish reversal if it fails to break, targeting lower liquidity at $153.11. With Stoch RSI entering oversold, a bounce or further dip could be next—keep an eye on $200 as the key pivot!
SOLUSDT 1D#SOL is trading within an ascending channel on the daily chart. It is currently sitting on the daily SMA200 and is expected to move toward the top of the channel. In that case, the potential targets are:
🎯 $202.36
🎯 $228.57
🎯 $261.97
In case of a breakdown below the channel, the downside targets are:
$150.65
$140.07
⚠️ Always remember to use a tight stop-loss and maintain proper risk management.

TradeCityPro | SOL: Market Calms After Sharp Move & RSI Support👋 Welcome to TradeCityPro!
Let’s analyze SOL, one of the most popular Ethereum killers with a market cap of $99.9 billion, currently ranking 6th on CoinMarketCap.
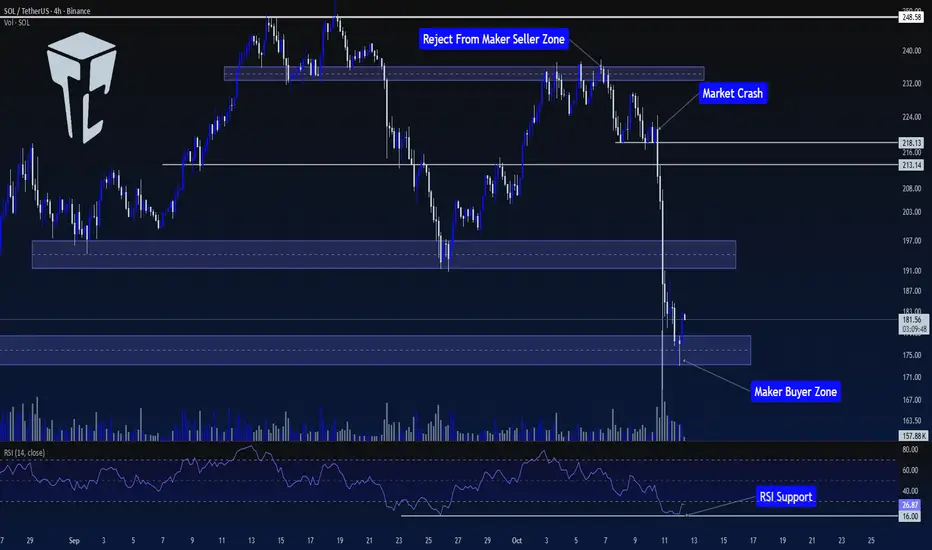
⏳ 4-Hour Timeframe
In the previous analysis, we had a Maker Buyer zone around $235. In that analysis, I mentioned that breaking this zone would be an early trigger for breaking $248.58.
🔍 However, the price never managed to sustain above this level, and after getting rejected from this zone, the price entered a corrective phase, forming a support at $218.13.
📊 After the price bounced from $218.13 for the first time, it failed to set a new high in line with previous highs and instead formed a lower high. The price returned to $218.13 again.
✔️ With the breakout of this level, coinciding with news between China and the U.S., the price started a sharp downward move, breaking through the $213.14 support.
✨ Over the course of 2-3 candles, SOL made a sharp move towards the first Maker Buyer zone, breaking it and reaching the second Maker Buyer zone.
💫 Naturally, there was a significant increase in selling volume during this move, and RSI dropped to 16, where it found support.
🧩 Currently, the market seems to have calmed down, with RSI still in the Oversell zone, but volatility has significantly decreased.
💡 Although the market has calmed, I believe the price needs to build a more structured setup before finding valid triggers, and the market conditions are not ideal for opening positions right now.
💥 So, for now, I won’t provide any triggers on this coin and will wait for more structure to form before making a better decision to open a position.
📝 Final Thoughts
Stay calm, trade wisely, and let's capture the market's best opportunities!
This analysis reflects our opinions and is not financial advice.
Share your thoughts in the comments, and don’t forget to share this analysis with your friends! ❤️
SOL last support area potenial of 20% gain toward 218$hi
the support and resistances on the chart are based on the previous data and weekly candlesticks if BINANCE:SOLUSDT holds this last support the potential of 20% gain is logical toward 218$
